Pedosphere 26(5): 699–708, 2016 doi:10.1016/S1002-0160(15)60078-9 ISSN 1002-0160/CN 32-1315/P c 2016 Soil Science Society of China ⃝ Published by Elsevier B.V. and Science Press
Mapping Soil Texture Based on Field Soil Moisture Observations at a High Temporal Resolution in an Oasis Agricultural Area YANG Renmin1,2 , LIU Feng1 , ZHANG Ganlin1,∗ , ZHAO Yuguo1 , LI Decheng1 , YANG Jinling1 , YANG Fei1,2 and YANG Fan1,2 1 State
Key Laboratory of Soil and Sustainable Agriculture, Institute of Soil Science, Chinese Academy of Sciences, Nanjing 210008 (China) 2 University of Chinese Academy of Sciences, Beijing 100049 (China) (Received April 7, 2015; revised June 20, 2016)
ABSTRACT Due to the almost homogeneous topography in low relief areas, it is usually difficult to make accurate predictions of soil properties using topographic covariates. In this study, we examined how time series of field soil moisture observations can be used to estimate soil texture in an oasis agricultural area with low relief in the semi-arid region of northwest China. Time series of field-observed soil moisture variations were recorded for 132 h beginning at the end of an irrigation event during which the surface soil was saturated. Spatial correlation between two time-adjacent soil moisture conditions was used to select the factors for fuzzy c-means clustering. In each of the ten generated clusters, soil texture of the soil sample with the maximum fuzzy membership value was taken as the cluster centroid. Finally, a linearly weighted average was used to predict soil texture from the centroids. The results showed that soil moisture increased with the increase of clay and silt contents, but decreased with the increase of sand content. The spatial patterns of soil moisture changed during the entire soil drying phase. We assumed that these changes were mainly caused by spatial heterogeneity of soil texture. A total of 64 independent samples were used to evaluate the prediction accuracy. The root mean square error (RMSE) values of clay, silt and sand were 1.63, 2.81 and 3.71, respectively. The mean relative error (RE) values were 9.57% for clay, 3.77% for silt and 12.83% for sand. It could be concluded that the method used in this study was effective for soil texture mapping in the low-relief oasis agricultural area and could be applicable in other similar irrigation agricultural areas. Key Words:
digital soil mapping, fuzzy c-means clustering, low relief, particle-size distribution, semi-arid region, water content
Citation: Yang R M, Liu F, Zhang G L, Zhao Y G, Li D C, Yang J L, Yang F, Yang F. 2016. Mapping soil texture based on field soil moisture observations at a high temporal resolution in an oasis agricultural area. Pedosphere. 26(5): 699–708.
INTRODUCTION Soil texture affects soil water and nutrient processes and thus is an important input for many hydrological modelling and climate change predictions (Prentice et al., 1992; Potter et al., 1993; Chen and Dudhia, 2001). Traditional soil mapping requires field survey and particle-size distribution (PSD) laboratory analysis, which is labor-intensive, time-consuming and expensive. This makes it difficult to correctly represent the spatial variation of soil texture considering the limited number of samples. Many studies on digital soil mapping (DSM) have been carried out based on soil-landscape models (Boer et al., 1996; McKenzie and Ryan, 1999; Chaplot et al., 2000; Carr´e and Girard, 2002; Henderson et al., 2005). The soil-landscape models intend to model the relationships between soil properties and soil-forming ∗ Corresponding
author. E-mail:
[email protected].
factors (McBratney et al., 2003). However, in low-relief areas, topographical covariates usually show little spatial variability, making it difficult to predict soil texture using these covariates (Liu et al., 2010, 2012; Zhu et al., 2010). There are three main approaches for mapping soil texture over low-relief areas. The first approach is based on geostatistical interpolation of a large number of soil sampling points. Geostatistical techniques are frequently used for soil texture mapping (Oberth¨ ur et al., 1999; Meul and Meirvenne, 2003; Liu et al., 2006). The soil property at unsampled sites is predicted by modeling spatial structure of the property from soil samples and then applying a Kriging interpolator with the fitted model. A large number of samples are generally needed to adequately model the spatial variation of soil, and well-distributed samples are usually required to interpolate over the study area with acce-
R. M. YANG et al.
700
ptable uncertainty. The second approach is based on single-date multispectral remote sensing data. By analyzing the relations between spectral reflectance and soil properties, models have been established using data from various sensors, including Landsat Thematic Mapper (TM), SPOT, IKONOS, Advanced Very High Resolution Radiometer (AVHRR) and airborne spectroscopy (Coleman et al., 1993; Barnes and Baker, 2000; Odeh and McBratney, 2000; Sullivan et al., 2005; Demattˆe et al., 2007, 2009). The third approach is based on time-series remote sensing images. Mattikalli et al. (1998) developed a regression model for the ratio of clay and effective saturated hydraulic conductivity in terms of time-series changes in brightness temperature and soil water content. Chang and Islam (2000) constructed two Artificial Neural Network models to classify soil texture into three categories from time series of soil moisture. They found that different soil texture classes can be distinguished from the range of soil moisture from field capacity to permanent wilting point during the soil drying phase. To improve the classification accuracy and classify soil into more than three groups, Chang et al. (2003) used a simple prototype-based classifier to classify soil texture into six categories by using multiple-drying-cycle brightness temperature. A calibration method was proposed to infer soil texture and hydraulic properties using remotely sensed estimats of soil moisture in relation to the soil drying (Santanello et al., 2007). Liu et al. (2012) mapped soil texture over low-relief areas using environmental covariates derived from time series of moderate-resolution imaging spectroradiometer (MODIS) data after a rainfall event. To reduce the influence of vegetation, the above remote sensing approaches usually limit their applications in areas with bare soil or sparse vegetation coverage. However, for areas with dense vegetation coverage such as agricultural cropping areas, the approaches show obvious limitations. In addition, the temporal resolution of these datasets was no finer than the daily scale. This may miss the initial stage of soil moisture changes in areas with high potential evapotranspiration and rapid drying, such as in arid and semi-arid environments, and thus may be imprecise. To address these challenges, high temporal resolution field-observed soil moisture data may be an alternative approach. However, few studies have addressed the capacity of such dataset to map soil texture in spatial domain. The aim of this study was to examine the potential use of high-temporal resolution field-observed soil
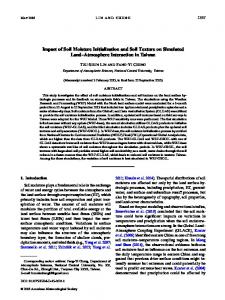
moisture for representing soil texture variability across a semi-arid and low-relief agricultural area. The basis of our proposed method was as follows. We had high temporal resolution soil moisture at a large number of sites in the area (n = 125, average density = 5 km−2 ). We chose a time period when the soil is drying after being saturated by a large irrigation event. We spatially interpolated soil moisture over time to the sites where we had texture measurements. Finally, we mapped the distributions of sand (> 0.05 mm), silt (0.002–0.05 mm) and clay (< 0.002 mm) contents from time-series soil moisture maps using a fuzzy c-means (FCM) clustering method. MATERIALS AND METHODS Study area The Heihe River Basin, the second largest inland basin in China, has complicated landscapes including mountains, oases and deserts from upper to lower reaches. Our 25-km2 study area (38.84◦ –38.89◦ N and 100.33◦ –100.41◦ E) is located in the oasis of the Hexi Corridor of Gansu Province, China (Fig. 1). The mean annual air temperature is about 7.3 ◦ C, with an average temperature of 28 ◦ C in summer and −10 ◦ C in winter. The mean annual precipitation is 129 mm, with rainfall mainly in July and August. The potential evaporation is about 2 200 mm, which massively exceeds precipitation (Jia et al., 2008; Jiang et al., 2008). The elevation is between 1 505 and 1 591 m gently sloping from west to east. The soils are classified as Haplanthrepts and Haplocryids according to US Soil Taxonomy (Soil Survey Staff, 2014). This area is a part of the alluvial fan formed by the Heihe River that brings nutrients from the upper reaches. Therefore, the Hexi Corridor is an important grain-producing area, where the major crops are wheat, corn, rape and soybean, with water being predominantly supplied by irrigation from the Heihe River. According to our field survey, corn is a dominated crop covering a very large area. Soil samples A total of 74 surface (0–15 cm) soil samples used in this study were collected in August 2012 and August 2013, with their spatial extent shown in Fig. 1. In 2012, twenty-five soil samples were collected on 1 km × 1 km regular grids. In 2013, forty-nine soil samples at finer resolutions were collected within three 1 km × 1 km grids in the center of the study area, with grids of 500 m × 500 m, 250 m × 250 m, 125 m × 125 m and 62.5 m × 62.5 m. Soil samples were a composite of five samples taken from the center and four vertices
MAPPING SOIL TEXTURE USING HIGH RESOLUTION SOIL MOISTURE
Fig. 1
701
Location of the study area, soil sampling sites and soil moisture observation sites.
within a 5 m × 5 m grid. In the laboratory, soil samples were air dried and sieved to pass a 2-mm sieve. Before measuring the PSD of soil samples, hydrochloric acid and hydrogen peroxide were used to remove carbonate and organic matter, and sodium hydroxide was added before ultrasonic treatment. The sand (> 0.05 mm), silt (0.002–0.05 mm) and clay (< 0.002 mm) contents were determined in percentage using an LS230 laser diffraction particle size analyzer (Coulter Electronics Ltd., USA) (Wang et al., 2013). Soil moisture observations Soil moisture data was obtained from the Environmental and Ecological Science Data Center for West China, including Heihe Watershed Allied Telemetry Experimental Research (HiWATER) WaterNET observation dataset (WaterNET) and HiWATER BNUNET observation dataset (BNUNET) in the middle reaches of the Heihe River Basin. WaterNET contains fifty observation points across the study area. Each has two Hydro Probe II probes at 4 and 10 cm depths, with observations of soil moisture, temperature, salinity and conductivity. Observations were continuous from May 2012 to September 2012 with temporal resolutions of 1-min interval in 00:00–04:30, 08:00–18:00 and 21:00–24:00, and 10-min interval at other time. BNUNET contains seventy-five observation points. Each point has BNUNET-TEMP probes at 4, 10 and 20 cm depths observing soil temperature, and the probe at 4 cm depth also observes soil moisture. Soil moisture and soil temperature were recorded every 10 min from May 10, 2012 to September
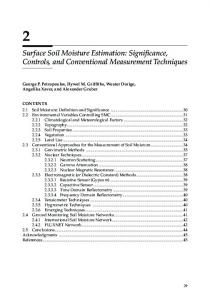
15, 2012. In this study, only soil moisture observations at 4 cm depth (Fig. 2) were used. Land surface of these sensors were almost corn fields (more than 90% of all sites). More detailed information of soil moisture data can be obtained from Jin et al. (2014) and Kang et al. (2014). In this semi-arid area, the Heihe River is the most important water source for irrigation. Here, only irrigation was considered as a wetting event, because the precipitation (Fig. 2) has little contribution compared with irrigation. Four irrigation events were recorded: once in spring, twice in summer and once in autumn. After each irrigation event, soil began drying. However, rainfall during the soil drying phase can lead to irregular change in soil moisture, obscuring the drying
Fig. 2 Daily precipitation and a typical soil moisture observation curve from May 10 to September 15 in 2012.
R. M. YANG et al.
702
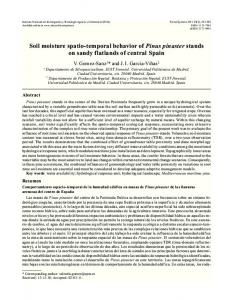
effect. In order to minimize this, the irrigation event in autumn was selected. The chosen irrigation event has two characteristics. First, because the water for farming was supplied by channels, the onset of irrigation at different sites varied from a few hours to several days. However, climate was essentially constant over the irrigation event. Second, the amount of irrigation was not equal over the study area. Since irrigation lasted for at least 3 h, surface soil was always saturated. Therefore, the different pre-irrigation surface soil moisture conditions and irrigation amount have little effect. Liu et al (2009, 2012) noted that rainfall (in this case, irrigation) should be large enough to drive surface soil to produce response, and surface soil moisture condition, before rainfall event occurs, must be considered before choosing study period. Thus, to minimize the influence of precipitation, the study period was identified for 132 h beginning at the end of irrigation, when the surface soil was saturated and the daily precipitation was no more than 3 mm. The soil moisture observations had a high temporal resolution and fluctuated during soil drying phase. To avoid uncertainty due to small fluctuations, observations were smoothed with a monotonically-decreasing negative exponential function (average R2 = 0.98) using Origin 8.5 (OriginLab, Northampton, USA). The soil drying rate varied during the study period, being higher at the beginning and then gradually slowing down till the end. Therefore, the time series was resampled according to the difference of soil drying rate during the study period. As a result, six temporal resolutions were chosen, with 0.5-h interval in the beginning 4 h, 1-h interval in 4–12 h, 2-h interval in 12–24 h, 4-h interval in 24–48 h, 6-h interval in 48–84 h and 12-h interval in the last 48 h. A total of thirty-eight times were obtained instead of original thousands of records. Methodology overview An overview of soil texture prediction methodology is presented in Fig. 3. There are four steps. First, ordinary Kriging was used to interpolate soil moisture observations for obtaining soil moisture distribution. Second, covariates for clustering were constructed based on the correlation analysis between two time-adjacent soil moisture conditions. Third, covariates were used as inputs in an FCM clustering method to get environmental classes. Finally, the spatial distribution of soil texture was predicted using a linearly weighted average model.
Fig. 3
Flow chart of soil texture estimation in this study. FCM
= fuzzy c-means.
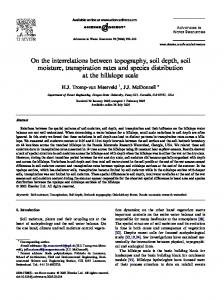
Spatial interpolation for soil moisture Soil samples and soil moisture observation sites were two independent point datasets. In order to get soil moisture at soil sampling sites, pre-processed soil moisture observations were interpolated over the study area using ArcGIS 9.3 (ESRI Inc., USA). Ordinary kriging was used to estimate spatial distributions of soil moisture based on Gaussian semivariogram model. An example of predicted soil moisture distribution is shown in Fig. 4. Before interpolation, we examined the frequency distribution of soil moisture using histogram, which should be normally distributed for Kriging (Burgess and Webster, 1980). To overcome the departures from normality, logarithmic and arcsine functions were used to transform the observed soil moisture data to a new scale on which the frequency distribution was near normal. In the end, the inverse transformation function was used to transform the interpolation result to the original scale. Thirty-eight soil moisture maps were finally generated. Then, we extracted the soil moisture data at soil sampling sites. Deviation of covariates for clustering The derived images, on the one hand, capture spatial distribution features of soil moisture across the study area after the irrigation event. On the other hand, they represent continuous change of soil moisture for each site with drying. This kind of dynamics of soil moisture can be owing to soil texture heterogeneity as its influencings on the capacity of soil water
MAPPING SOIL TEXTURE USING HIGH RESOLUTION SOIL MOISTURE
Fig. 4
703
Predicted spatial distributions of soil moisture at the beginning (a) and end (b) of the study period using ordinary Kriging.
retention have been well studied (Van Genuchten and Nielsen, 1985). As expected, the time-series images of soil moisture during the drying phase showed differences in the drying rate among the sites, which may be related to soil texture differences. The spatial distribution of soil moisture at 74 all sites also changed during the drying phase. This may be related to soil texture. Therefore, the spatial distribution of soil moisture can be used as an indicator to represent that of soil texture. We adopted correlation analysis to estimate the change in soil moisture distribution over time, in one layer over the study area (Eq. 1): n ∑
(Mik − M i )(Mjk − M j )
Corrij = v u∑ n ∑ u n 2 t (Mik − M i ) (Mjk − M j )2 k=1
k=1
(1)
k=1
where Corrij is the correlation between two adjacent time periods i and j over all sites; M is the soil moisture of a grid cell; M is the average soil moisture in the layer of all sites; n is the number of grid cells; and k is a particular grid cell. The higher the positive correlation, the more similar the moisture distributions in the two time periods. After using the overall correlation analysis, we selected appropriate time period when the change in soil moisture distribution happened. The soil moisture difference in this period was used to represent the variation of soil texture (Eq. 2): ∆Mij = Mi Mj
(2)
where ∆Mij is the soil moisture difference between two adjacent time periods, i and j, and M is the soil moisture of a grid cell. This calculation produces a set of
soil moisture differences which will be used as covariates for clustering analysis. Fuzzy c-means clustering Although each site will in general have a different moisture over the chosen time period, some will be more similar than others. We therefore clustered these into classes with similar characteristics using fuzzy cmeans clustering (Zhu et al., 1997). Fuzzy c-means clustering is an unsupervised classification method (Bezdek et al., 1984) producing a user-defined number of classes. Each site has a vector of membership values. The higher the membership value of a point, interpreted as the higher degree belonging to a class, the closer the point to the center of a class. Fuzzy c-means clustering method has been widely used in soil classification and soil property estimation (McBratney and Odeh, 1997; Zhu, 1997; Bragato, 2004). In FCM clustering, the fuzzy exponent (degree of fuzziness) and the number of clusters are user-defined parameters which control the clustering algorithm. These can be optimized by using the partition coefficient and partition entropy, compared over a range of possible fuzzy exponents and cluster numbers (Bezdek et al., 1984). Before operating the FCM clustering, we standardized moisture difference to a range from 0 to 100. Based on these variables as inputs in FCM clustering, it can export a number of clusters denoted as environmental classes. Computation of soil texture A linearly weighted average model (Zhu et al., 1997) was used to estimate sand, silt and clay contents of surface soil. This model is based on a hypothesis that the more the local environment close to the environment of a typical class, the more the property of local soil similar to the typical soil. It is defined as:
R. M. YANG et al.
704 n ∑
Vij =
RESULTS AND DISCUSSION
k k Sij V
k=1 n ∑
(3) k Sij
k=1
where Vij is the predicted value of soil texture at location (i, j); V k is the typical value of soil texture of k cluster class k; Sij is the membership value of cluster class k at location (i, j), which can be used to measure the similarity between the environment of soil at location (i, j) and the typical environment of cluster class k, and n is the number of cluster classes. In order to get accurate predictions using the linearly weighted average model, we need a series of typical soil samples that could represent each derived environmental class. In an environmental class, the soil texture of a soil sample with the highest fuzzy membership value was defined as typical value within that class. Thus, we can specify typical values for all environmental classes from soil samples in the study area. Validation The predicted surface soil texture was validated based on 64 independent field samples. The validation was carried out by four assessment indexes, the mean error (ME), the mean absolute error (MAE), the root square error (RMSE) and the relative error (RE). They were computed as follows: n 1∑ (Pi − Oi ) ME = n i=1
(4)
Relationships between soil texture and soil moisture The surface soils sampled were predominantly silt loam, with the mean silt content value of 61.25% ± 2.70% (Table I). The sand exhibited the largest range (25.94% ± 3.67%). The clay content, however, showed the least variation (12.81% ± 1.52%). Thus, the magnitude of soil texture variation is not too large. To identify the characterization of soil texture and soil moisture, sand, silt and clay of soil samples were grouped in increments of 2% (Fig. 5), and the mean values in each group were used for analysis. Soil moisture variations among the groups decreased with time throughout the study period (Fig. 5). At the beginning, soil moisture presented a high variation from 40 to 60 cm3 cm−3 , which were assumed to be the saturated water contents. At the end, it only ranged from 25 to 30 cm3 cm−3 . During the soil drying phase, water contents decreased due to the evaporation and transpiration of plants. TABLE I Summary statisticsa) of observed and predicted sand, silt and clay (n = 74) Item
Min Sand Silt Clay a) Min
n 1∑ MAE = (|Pi − Oi |) n i=1
v u ∑ u1 n RMSE = t (Pi − Oi )2 n i=1
RE =
n ∑ |Pi − Oi | × 100% Oi i=1
Observed value Max
Predicted value
Mean SD
14.36 32.86 25.94 56.80 69.90 61.25 10.40 19.40 12.81
Min
Max
Mean SD
% 3.67 23.56 30.06 26.71 2.70 57.54 63.98 60.70 1.52 11.26 14.47 12.62
1.79 1.38 0.71
= minimum; Max = maximum; SD = standard devia-
tion.
(5)
(6)
(7)
where n is the number of validation samples; Pi is the predicted value of sand, silt and clay of sample i (%); and Oi is the observed value of sand, silt and clay contents of sample i (%). The ME was used to measure the bias of prediction (ME = 0 for an unbiased method). The MAE and RMSE were used to measure the prediction accuracy. The smaller the MAE and RMSE, the more accurate the prediction. Relative error is the absolute error divided by the observed measurement.
Relationships between soil texture and soil moisture are also shown in Fig. 5. At the beginning of the study period, the moisture of the saturated surface soil was controlled by soil texture: increasing with the increase of clay and silt contents, and decreasing with the increase of sand content. However, it had no apparent relation to the variation of soil texture at the end of the observation period. This was because the only water remaining was held with tensions at or near the permanent wilting point, which varied much less than saturated water contents for a range of soil texture. Thus, the difference between initial and final water contents parallelled the difference between initial water contents. Such a relationship can be used to estimate soil texture as suggested by Van Genuchten and Nielsen (1985), who developed a retention model for estimating soil physical and hydraulic properties based on their relationships with soil water retention curve.
MAPPING SOIL TEXTURE USING HIGH RESOLUTION SOIL MOISTURE
705
The low correlation coefficients were assumed to be in the time periods during which soil texture variation was most influential.
Fig. 6 Correlation analysis between time-adjacent soil moisture conditions during soil drying phase, computed over all sites.
FCM clustering and typical soil samples for prediction In this study, the optimal values of fuzzy exponent and cluster number were set as 1.5 and 10, respectively. Table II shows the sites that were taken as the representative sites for each of the 10 clusters, having the highest membership values among the 74 sites. Six clusters (1, 3, 6, 7, 8 and 10) had centroids with a membership value of at least 0.89 and thus well represented the corresponding environmental classes. However, four clusters (2, 4, 5 and 9) had no site with a higher membership value than 0.5 and are thus not very representative. In this situation, the sites with the maximum membership values were considered to be representative for the corresponding classes. TABLE II Representative soil texture values and their membership values for 10 clusters derived from a fuzzy c-means (FCM) clustering analysis on soil moisture covariates Fig. 5 Relationships between soil texture and soil moisture during soil drying phase. Sand, silt and clay of soil samples were grouped in increments of 2% and the mean values in each group were used for analysis. There was no data in the range of 16% to 18% for sand content.
Correlations between time-adjacent soil moisture conditions during the entire drying phase, taken over all sites, are shown in Fig. 6. Sixteen correlation coefficients of these were less than 0.8, with nine being less than 0.6. However, there is no apparent time pattern associated with the changes in correlation coefficients.
Cluster
Membership value
Sand
Silt
Clay
1 2 3 4 5 6 7 8 9 10
0.97 0.38 0.89 0.29 0.42 0.96 0.96 0.93 0.25 0.90
23.23 0.10 24.76 22.75 28.42 28.31 29.40 28.58 14.39 23.24
% 64.01 57.52 62.44 63.83 60.60 58.27 59.31 60.21 69.87 62.30
12.76 12.38 12.80 13.42 10.98 13.42 11.29 11.21 15.74 14.46
R. M. YANG et al.
706
Fig. 7 Predicted surface soil texture distribution based on a linearly weighted average model using ten representative sites with highest membership values and ten fuzzy clusters (derived from the soil moisture difference during soil drying phase).
Prediction of soil texture The overall trend of predicted surface soil texture distribution was that sand content in north was lower than south (Fig. 7). An opposite trend was shown for silt and clay contents. Despite of the elevation as the most popular indicator used in predicting soil properties (McBratney et al., 2003), soil texture in this area was obviously not related to elevation, which was highest in west and lowest in east. It was found that soil texture did not co-vary with topography in this area. Ranges of predicted sand, silt and clay were 23% to 31%, 57% to 64% and 11% to 15%, respectively. The range predicted were narrower than those measured (14% to 33% for sand, 56% to 70% for silt, and 10% to 20% for clay). This is to be expected in any convex interpolation such as a weighted sum (e.g., Wang et al. 2012). Validation statistics showed that the ME values were all close to zero. The MAE, RMSE and ME values were much lower for clay than silt and sand, indicating clay was the most accurately predicted, followed by silt and sand contents (Table III, Fig. 8). Similar accuracies were obtained in previous studies (Liu et al., 2012; Wang et al., 2012). The higher accuracy for clay content prediction was because in medium-textured soils such as those in this study, clay content is more closely related to water-holding capacity and pore-size distriTABLE III Mean error (ME), mean absolute error (MAE) and root square error (RMSE) of the predicted soil sand, silt and clay based on 64 independent samples Item
ME
MAE
RMSE
Sand Silt Clay
0.01 −0.07 0.09
3.18 2.31 1.24
3.71 2.81 1.63
Fig. 8 Frequency distributions of relative errors for soil sand, silt and clay.
bution than silt and sand contents. Our results indicated that the spatial variation of soil texture can be mapped from high-temporal resolution soil moisture observations with a reasonable accuracy. Research considerations The relationship between soil moisture and soil texture has been well understood and developed using DSM. Indeed, this relationship is likely to be used to predict soil texture from soil moisture. From this perspective, soil moisture-based covariates can be seen as complementary variables that focus on issues where soil forming factors are not used for mapping soil texture. The approach of high-temporal resolution soil moisture observations may offer a measure of soil texture spatial variability that has advantages over remote sensing approaches in this study area. One advantage is that high continuous temporal changes of soil moisture information are associated with dynamic
MAPPING SOIL TEXTURE USING HIGH RESOLUTION SOIL MOISTURE
patterns in the land surface. These patterns are related to soil texture. The other advantage is that irrigation, a wetting event differs from rainfall in remote sensing approaches, usually has a large amount that is able to saturate surface soil. As such, pre-irrigation surface soil moisture conditions have little effect on soil texture prediction. However, it should be recognized that high-temporal resolution soil moisture observations have certain limitations for mapping soil texture. In general, field records tend to be affected by agriculture management and climate changes such as cultivation, fertilization, soil organic matter allocation, rainfall and evaporation. This means that these uncontrolled factors could result in uncertainties of data analyses. We recommend that the data pre-processing, data checking and correcting, is eligible to promote the quality of data. If the data can be properly pre-handled, the key to using these field measured soil moisture records in mapping soil texture is to interpolate them into a GIS grid format. It means that spatially distributed soil moisture of any interpolation model has deviation from the observed value. In order to reduce the effect of this uncertainty on final soil texture mapping model, interpolation models should be carefully tested. Despite of the limitations, the approach proposed in this study provided accuracy prediction on soil texture variation. Therefore, this method could be applicable in similar lowrelief oasis agriculture areas. On a practical level, the proposed approach could be useful and efficient on mapping soil properties, especially in arid and semi-arid areas. In these areas, irrigated agriculture has been recognized as the most water-demanding economical sector. It is proven that increased demand for irrigation water has limited the water availability for other sectors. In recent years, a wireless sensor network has received an increasing interest for improving irrigation water productivity (Navarro-Hell´ın et al., 2014). The potential benefit from wireless sensor networks in this way is definitely great, since not only can the efficient use of the water be increased, but also can the sensed soil moisture data be used for digital soil mapping in such areas. In addition, an understanding of soil drying processes is expected to improve our ability to model soil texture spatial variability. Correlation analysis between two time-adjacent soil moisture conditions provided a means to capture spatial heterogeneity of soil texture. Moreover, FCM produces classes of soil moisture difference during the soil drying phase and allowed presenting the spatial variations of soil texture.
707
CONCLUSIONS Field soil moisture observations were used to map soil texture in an oasis agricultural area with low relief in the semi-arid region of northwest China. These soil moisture observations had a high temporal resolution and provided accurate and continuous soil water content information related to soil texture, with saturated soil conditions at the beginning of the study period. It was found that during the drying phase, soil texture was closely related to soil moisture. The soil moisture increased with the increase of clay and silt contents, but decreased with the increase of sand content. Thus, the differences of interpolated soil moisture images were identified as covariates based on the correlation between two time-adjacent soil moisture conditions during the entire soil drying phase. Validation with independent samples suggested that the approach proposed in this study provided accuracy prediction on spatial variation of soil texture from soil moisture. It confirmed the potential of using high-temporal resolution of field-observed soil moisture to map soil texture. The approach could be applicable for similar agricultural irrigation areas. ACKNOWLEDGEMENTS This research was supported by the National Natural Science Foundation of China (Nos. 41130530, 91325301, 41201207 and 41571212) and the Project of Frontier Fields during the Thirteenth Five-Year Plan Period of the Institute of Soil Science, Chinese Academy of Sciences (ISSASIP1622). We thank Dr. Li Xin, who was responsible for the HiWATER project and the Environmental and Ecological Science Data Center for West China for providing soil moisture data in the study area. The English editing and constructive comments by Dr. D. G. Rossiter, Department of Crop and Soil Sciences, Cornell University, USA, are gratefully acknowledged. REFERENCES Barnes E M, Baker M G. 2000. Multispectral data for mapping soil texture: possibilities and limitations. Appl Eng Agric. 16: 731–741. Bezdek J C, Ehrlich R, Full W. 1984. FCM: the fuzzy c-means clustering-algorithm. Comput Geosci. 10: 191–203. Boer M, Del Barrio G, Puigdef´ abres J. 1996. Mapping soil depth classes in dry Mediterranean areas using terrain attributes derived from a digital elevation model. Geoderma. 72: 99– 118. Bragato G. 2004. Fuzzy continuous classification and spatial interpolation in conventional soil survey for soil mapping of the lower Piave plain. Geoderma. 118: 1–16.
708
Burgess T M, Webster R. 1980. Optimal interpolation and isarithmic mapping of soil properties: I. The semi-variogram and punctual kriging. J Soil Sci. 31: 315–331. Carr´ e F, Girard M C. 2002. Quantitative mapping of soil types based on regression kriging of taxonomic distances with landform and land cover attributes. Geoderma. 110: 241–263. Chang D H, Islam S. 2000. Estimation of soil physical properties using remote sensing and artificial neural network. Remote Sens Environ. 74: 534–544. Chang D H, Kothari R, Islam S. 2003. Classification of soil texture using remotely sensed brightness temperature over the Southern Great Plains. IEEE T Geosci Remote. 41: 664–674. Chaplot V, Walter C, Curmi P. 2000. Improving soil hydromorphy prediction according to DEM resolution and available pedological data. Geoderma. 97: 405–422. Chen F, Dudhia J. 2001. Coupling an advanced land surfacehydrology model with the Penn State-NCAR MM5 modeling system. Part I: Model implementation and sensitivity. Mon Weather Rev. 129: 569–585. Coleman T L, Agbu P A, Montgomery O L. 1993. Spectral differentiation of surface soils and soil properties: Is it possible from space platforms? Soil Sci. 155: 283–293. Demattˆ e J A M, Fiorio P R, Ben-Dor E. 2009. Estimation of soil properties by orbital and laboratory reflectance means and its relation with soil classification. Open Remote Sens J. 2: 12–23. Demattˆ e J A M, Galdos M V, Guimar˜ aes R V, Gen´ u A M, Nanni M R, Zullo Jr J. 2007. Quantification of tropical soil attributes from ETM+/LANDSAT-7 data. Int J Remote Sens. 28: 3813–3829. Henderson B L, Bui E N, Moran C J, Simon D A P. 2005. Australia-wide predictions of soil properties using decision trees. Geoderma. 124: 383–398. Jia W X, He Y Q, Li Z X, Pang H X, Yuan L L, Ning B Y, Song B, Zhang N N. 2008. Regional characteristics of climatic change trend and break during last 50 years in Hexi corridor. Sci Geogr Sin (in Chinese). 28: 525–531. Jiang X Y, Zhang B, Zhang Y. 2008. Temperature and precipitation changes in Zhangye region during the recent 35 years. J Arid Land Resour Environ (in Chinese). 22: 81–86. Jin R, Li X, Yan B, Li X, Luo W M, Ma M G, Guo J W, Kang J, Zhu Z. 2014. A nested eco-hydrological wireless sensor network for capturing surface heterogeneity in the midstream areas of the Heihe River Basin, China. IEEE Geosci Remote Sens. 11: 2015–2019. Kang J, Li X, Jin R, Ge Y, Wang J, Wang J. 2014. Hybrid optimal design of the eco-hydrological wireless sensor network in the middle reach of the Heihe River Basin, China. Sensors. 14: 19095–19114. Liu F, Geng X, Zhu A X, Fraser W, Waddell A. 2012. Soil texture mapping over low relief areas using land surface feedback dynamic patterns extracted from MODIS. Geoderma. 171-172: 44–52. Liu F, Zhu A X, Li B, Pei T, Qin C, Liu G, Wang Y, Zhou C. 2009. Identification of spatial difference of soil types using land surface feedback dynamic patterns. Chinese J Soil Sci (in Chinese). 40: 501–508. Liu F, Zhu A X, Pei T, Qin C, Li B. 2010. Application of high temporal resolution satellite remote sensing in identifying soil texture patterns. J Geo-Info Sci (in Chinese). 12: 733–740. Liu T L, Juang K W, Lee D Y. 2006. Interpolating soil properties using kriging combined with categorical information of soil maps. Soil Sci Soc Am J. 70: 1200–1209.
R. M. YANG et al.
Mattikalli N M, Engman E T, Jackson T J, Ahuja L R. 1998. Microwave remote sensing of temporal variations of brightness temperature and near-surface soil water content during a watershed-scale field experiment, and its application to the estimation of soil physical properties. Water Resour Res. 34: 2289–2299. McBratney A B, Odeh I O A. 1997. Application of fuzzy sets in soil science: fuzzy logic, fuzzy measurements and fuzzy decisions. Geoderma. 77: 85–113. McBratney A B, Santos M L M, Minasny B. 2003. On digital soil mapping. Geoderma. 117: 3–52. McKenzie N J, Ryan P J. 1999. Spatial prediction of soil properties using environmental correlation. Geoderma. 89: 67–94. Meul M, Van Meirvenne M. 2003. Kriging soil texture under different types of nonstationarity. Geoderma. 112: 217–233. Navarro-Hell´ın H, Torres-S´ anchez R, Soto-Valles F, AlbaladejoP´ erez C, L´ opez-Riquelme J A, Domingo-Miguel R. 2015. A wireless sensors architecture for efficient irrigation water management. Agr Water Manage. 151: 64–74. Oberth¨ ur T, Goovaerts P, Dobermann A. 1999. Mapping soil texture classes using field textuing, particle size distribution and local knowledge by both conventional and geostatisical methods. Eur J Soil Sci. 50: 457–479. Odeh I O A, McBratney A B. 2000. Using AVHRR images for spatial prediction of clay content in the lower Namoi Valley of eastern Australia. Geoderma. 97: 237–254. Potter C S, Randerson J T, Field C B, Matson P A, Vitousek P M, Mooney H A Klooster S A. 1993. Terrestrial ecosystem production: A process model based on global satellite and surface data. Global Biogeochem Cy. 7: 811–841. Prentice I C, Cramer W, Harrison S P, Leemans R, Monserud R A, Solomon A M. 1992. A global biome model based on plant physiology and dominance, soil properties and climate. J Biogeogr. 19: 117–134. Santanello J A, Peters-Lidard C D, Garcia M E, Mocko D M, Tischler M A, Moran M S, Thoma D P. 2007. Using remotelysensed estimates of soil moisture to infer soil texture and hydraulic properties across a semi-arid watershed. Remote Sens Environ. 110: 79–97. Soil Survey Staff, 2014. Keys to Soil Taxonomy. 12th Ed. US Department of Agriculture, Natural Resources Conservation Service, Washington D.C. Sullivan D G, Shaw J N, Rickman D. 2005. IKONOS imagery to estimate surface soil property variability in two Alabama physiographies. Soil Sci Soc Am J. 69: 1789–1798. Van Genuchten M T, Nielsen D R. 1985. On describing and predicting the hydraulic properties of unsaturated soils. Ann Geophys. 3: 615–628. Wang D C, Zhang G L, Pan X Z, Zhao Y G, Zhao M S, Wang G F. 2012. Mapping soil texture of a plain area using fuzzy-cmeans clustering method based on land surface diurnal temperature difference. Pedosphere. 22: 394–403. Wang W P, Liu J L, Zhang J B, Li X P, Cheng Y N, Xin W W, Yan Y F. 2013. Evaluation of laser diffraction analysis of particle size distribution of typical soils in China and comparison with the Sieve-Pipette method. Soil Sci. 178: 194–204. Zhu A X. 1997. A similarity model for representing soil spatial information. Geoderma. 77: 217–242. Zhu A X, Band L, Vertessy R, Dutton B. 1997. Derivation of soil properties using a soil land inference model (SoLIM). Soil Sci Soc Am J. 61: 523–533. Zhu A X, Liu F, Li B, Pei T, Qin C, Liu G, Wang Y, Chen Y, Ma X, Qi F, Zhou C. 2010. Differentiation of soil conditions over low relief areas using feedback dynamic patterns. Soil Sci Soc Am J. 74: 861–869.