Coskun et al.
Impacts of User Interface Complexity in Safety-Critical Systems
Impacts of User Interface Complexity on User Acceptance in Safety-Critical Systems Erman Coskun Le Moyne College
[email protected]
Martha Grabowski Le Moyne College and Rensselaer Polytechnic Institute
[email protected]
ABSTRACT
The importance of the user interface increases particularly in safety-critical or mission-critical systems where the user has time limitations within which to make correct, accurate, and timely decisions. User interfaces for these type of systems should be well-designed, easy to understand and easy to use in order to be accepted by expert users and to support the users’ decision making under pressure. Otherwise mishaps or accidents may occur and consequences of accidents may include loss of human life, large financial losses, and environmental damage. In this research, we study user interface complexity and impacts of this complexity on users’ acceptance of that system. We use the measurements and experiments with the Navigation and Piloting Expert System (NPES) and its operators to quantify our research. We report details of metrics, measurements, experiment, findings, and conclusions. Keywords
user interface complexity, safety-critical systems, user acceptance INTRODUCTION
Safety-critical systems are attracting a lot of attention due to the enormous catastrophic potential of these systems on their constituents, bystanders, and the environment. These kind of systems are human-machine systems, comprised of networks of human operators and other resources (such as facilities, technical components, etc.), that perform tasks and support the missions and goals of more than one organization (Kapasouris, Serfaty, Deckert, Wohl, and Pattipatyi, 1991). Safety is the most important aspect in these systems. Different types of information systems such as intelligent systems, decision support systems, expert systems, and others have been developed and successfully implemented in these kind of environments to reduce risk of accidents and mishaps. Some examples of safety-critical systems and information systems developed for them are:
Aviation, ship, or space shuttle and their computerized control systems (Heudin, 1991; Coenen, Smeaton, and Bole, 1989), Air traffic and its control systems (Perry, 1997), Nuclear power plants and their control systems (Wong and Kalam, 1995), Intelligent highways and their control systems (Dailey, Haselkorn, and Lin, 1993), Medical systems such as intensive care units and patient monitoring system in these units (Leveson & Turner, 1993; Halang, Sniezek, and Colnaric, 1998), and Military and defense systems and their control and operation systems (Rouse, Geddes, and Hammer, 1990).
Poor user interfaces have contributed to disasters, including loss of life in safety-critical environments. For example, the complicated user interface of the AEGIS tracking system was a contributing cause to the erroneous identification and shooting down of an Iranian passenger plane which resulted with 296 losses. USS Stark's inability to cope with Iraqi Exocet missiles which resulted with 37 losses and 21 injured was partly attributed to the human-computer interface (Neumann, 1991). Sometimes the implementation of the user interface can be at fault. A number of people died from radiation overdoses partially as a result of the faulty cursor handling code in the Therac-25 accidents (Leveson and Turner, 1993). McKenzie’s analysis of anecdotal descriptions of IS failure cases in the ACM’s Software Engineering notes also concludes that 92% of computer related accidents involved with human-computer interaction (McKenzie, 1994). One such example is failure of London ambulance service computer-aided dispatch system (Beynon-Davies, 1999). Proceedings of the Tenth Americas Conference on Information Systems, New York, New York, August 2004
3433
Coskun et al.
Impacts of User Interface Complexity in Safety-Critical Systems
In safety-critical environments users (human operators) are decision-makers and their decisions are supported by information systems. The importance of the user interface increases particularly in safety-critical or mission-critical systems where the user has time limitations within which to make correct decisions (i.e. collision avoidance for ships). Safety-critical systems must monitor the situation and provide warnings and/or alarms when there is possibly dangerous patterns in the monitored parameters. Even the system works perfectly and without a glitch for mission completion, operator must get that information, understand it, interpret it, and use it for right decision. In order to design an understandable and usable interface, the human-computer interaction, computer-supported cooperative work, psychology, cognitive sciences, and human factors disciplines have developed methodologies and determined critical elements for successful user interfaces. However the question we need to answer is what makes a user interface a complex one and how different aspects of complexity affects human operator’s decisions and behaviors. Which one is more important? Usability or functionality? It is well known that expert users in safety-critical systems do not like computerized systems to do their job and teach them how to perform their job. Instead, they would like to get data and facts from the system and use their own judgment and expertise to make decisions. Thus, user interface complexity may have impact on expert users’ acceptance and utilization of information systems in safety-critical environments. Thus, in this study, our goal is twofold. First, measuring user interface complexity level for safety-critical systems, then determining the impacts of user interface complexity on human operators’ acceptance of these systems. The sample system utilized in this research was the Navigation and Piloting Expert System (NPES). We are reporting the results of complexity measurements for two versions and the results of experiments with 3 users. PREVIOUS STUDIES AND RESEARCH MODEL
Many researchers studied user interface complexity, metrics to assess complexity level, and impacts of complexity on operators in safety-critical systems. Gerhardt, Javecchia, Andriole,and Miller (1995) on submarine displays, Adelman, Cohen, Bresnick, Chinnis, and Laskey (1995) on real-time expert system which is used to identify incoming aircraft as friend and foe, Chignell (1990) on metrics for real-time interface complexity, Andriole and Adelman (1995) on dimensions of user interface complexity and metrics, Shneiderman (1998), Rowe, Sibert, and Irwin (1998) on air traffic management. Martelli, Nofrini, Vendruscolo, and Visani (2003) evaluates HCI based on a) evaluation of user satisfaction using HCI, by questionnaire survey; b) evaluation of the system’s complexity through objective observation of the user’s ability and difficulties using HCI, by an independent scientist following a specific questionnaire. All these studies suggested and used metrics to assess user interface complexity in different safety-critical systems in general. The results of a survey on vessel traffic service (VTS) systems and human-computer interfaces at five waterways (Hoffman, Riley, and Dion, 1998) show that monitoring, information processing, and communicating are the main tasks for subjects concerned with safe vessel navigation such as VTS operators, vessel pilots, and masters. This study also measured user interface-related issues using metrics such as ease of understanding displays, consistency of display terminology, sequence of information presentation in displays, and consistency between displays and required tasks. Dix, Finley, Abowd, and Beale (1998) also suggest three points for user interface evaluations: • • •
To assess the extent of the system’s functionality To assess the effect of the interface on the user, and To identify any specific problems with the interface.
All above mentioned studies show that since each safety-critical system and operator needs in each system are different and unique and each software's user interface should be different than others. Furthermore, the metrics to measure the complexity of user interfaces may depend on the functionality of the software system and the characteristics of the users and they should measure general complexity which will be common for all user interfaces as well as system-specific user interface complexity which are unique to that particular system. Thus we will classify the metrics for user interface complexity assessment into two main groups: 1- General User Interface Complexity Metrics a) Effectiveness of display characteristics such as characters, highlighting, bolding, coloring b) Amount of information being displayed and presented to user c) Consistency of display and system terminology d) Understandability of user interface
Proceedings of the Tenth Americas Conference on Information Systems, New York, New York, August 2004
3434
Coskun et al.
Impacts of User Interface Complexity in Safety-Critical Systems
e) Perceived complexity f) Accessibility g) Ease of learning and obtaining information from screen 2- System Specific Metrics a) Functionality related complexity b) System specific displays (such as charts, maps, figures) c) Task support level for users Beyond basic user interface issues there is second stream of research related to user interfaces. This research focus on human’s understanding of information and data provided by user interface and accurate, faster, and better decision making. Human information processing, learning, memory, decision making, problem solving, attention, perception are subjects for this research stream (Adelman et al.,1995; Andriole and Adelman, 1995). It tries to explore what happens after the user interacts with user interface and gets data from it. This can be seen as aftermath of human-computer interaction. Human’s interaction with the user interface is first step. Once this is complete and human gets this information and data from the interface, he/she will understand this information, use it for decision making, and make the decision for the system. It is commonly called as cognitive engineering or usability. In this research, we will call it as decision support and explanation complexity. RESEARCH METHODOLOGY Research Tool: Navigation and Piloting Expert System (NPES)
The vehicle for this research is the Navigation and Piloting Expert System (NPES), an operational decision support system developed by Rensselaer Polytechnic Institute as part of the Lockheed Martin SmartBridge™ initiative. NPES is embedded in SmartBridge™ navigation system and provides intelligent decision support to Chevron oil tanker ship's masters, mates and pilots navigating the restricted waters of San Francisco Bay. The NPES is installed aboard the Chevron Colorado, an oil tanker of Chevron Shipping Company, which sails between California and Prince William Sound, Alaska on a weekly basis. There are two versions of NPES, referred to as NPES-1 and NPES-2. NPES-1 is the original version of NPES. It was developed between 1996 and 1998. After NPES-1 was built, some additional design, functionality, reasoning, interface changes were made, resulting in NPES-2. Thus, NPES-2 is the successor to NPES-1. The Differences Between NPES-1 and NPES-2
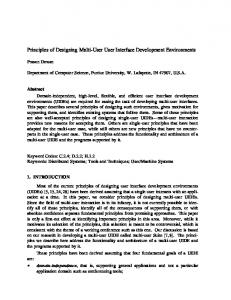
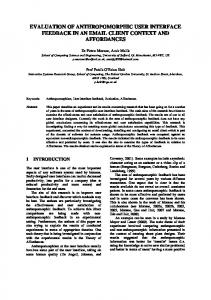
The changes in NPES-2 user interface were mostly done to provide better information to the users. Some new functionality was added to provide more detailed information such as ownship position and maneuvering limitations. The first difference between the two versions' user interface was the chart used. NPES-1 uses a raster image digital chart, which looks like the charts used in daily life by pilots and navigators. NPES-2 uses a fully vectorized electronic chart display information, which gives a less real-life chart image, as can be seen in Figures 1 and 2. There were also changes in message display style to provide better and more noticeable information to the users. Blinking and red colored warnings, alerts, and alarms were used in NPES-2, while NPES-1 used regular characters and black color for displaying these information. In terms of information content, both NPES-1 and NPES-2 display the same one sentence warning for alerts/alarms. However, in NPES-2, if the user wants to learn more details about that situation, additional information is available by clicking on the warning, alert/alarm sentence. Beyond these there were some other differences between NPES-1 and NPES-2 as summarized in Table-1.
Proceedings of the Tenth Americas Conference on Information Systems, New York, New York, August 2004
3435
Figure 1. NPES-2 User Interface Sample
Figure 2. NPES-2 User Interface Sample
Coskun et al.
Impacts of User Interface Complexity in Safety-Critical Systems
Area User Interface
NPES-1 ¾ ¾ ¾ ¾ ¾ ¾
Decision Support, Explanation
¾ ¾
Raster image digital chart Alerts and alarms provided with regular characters, black color, and regular font size All information appears on top-level display Targets are represented with an x in a circle Advisory screen is separated from collision avoidance and alarms/alerts screen Required tasks, Local/Pilot knowledge, and environmental Info advisories are displayed on the same screen by opening three different windows Fundamental maneuvering and collision avoidance decision support Alert and alarm information cannot be seen when advisories screen is open.
NPES-2 ¾ ¾ ¾ ¾ ¾ ¾ ¾ ¾ ¾ ¾ ¾ ¾
Fully vectorized electronic chart display information Blinking warnings, alerts, and alarms Red-colored alarms User has to double-click for details Added target direction arrow to targets and to ownship to show headings of targets and heading of ownship Advisory and Collision avoidance screens are shown together Required tasks, Local/Pilot knowledge, and environmental Info advisories are displayed separately and one at a time NPES off / on button Detailed maneuvering and collision avoidance decision support Alert and alarm information is always available and more distinguishable. Explanation for reasoning provided Alert and alarm information has dedicated screen space
Table 1. Differences Between NPES-1 and NPES-2 Determining Complexity Levels For Two NPES Versions Subjects and Experiment 3 US Navy Reserve Officer Training Center navigation and piloting officers were the human subjects for this research while two NPES versions were subjects of complexity measurement experiments. Two of the subjects teach navigation and piloting-related courses and had both theoretical and practical piloting knowledge. They also have operational experience in ship handling and vessel management. The third officer was a senior student with theoretical knowledge and less real-life navigation and piloting experience.
The human subjects completed 10 simulated scenarios (5 with NPES-1 and 5 with NPES-2 in 3 to 4 sessions, each session requiring 3-4 hours to complete. The first scenarios in randomization plan are used as warm-up scenarios and data is not collected for them. After each scenario completion, users filled out questionnaire (with 7 point Likert-scale) and were interviewed. Users were run through assigned scenarios, which were differentiated based on their simulated location, situation shown (crossing, meeting, overtaking), direction (inbound, outbound), and target numbers (single target, multiple target). Before the experiments, each user was given information about NPES and instructed about how to use both versions. Each user used one scenario for each version as a warm-up, in order to get familiar with the system, terminology, and the scenarios. The time required for each scenario run and for completing the questionnaires was between 45 to 60 minutes. Metrics
User interface complexity for both versions were determined using surveys administrated to NPES users. Based on previous studies and suggestions from literature, we determined our metrics to include both general metrics as well as NPES-specific metrics. The metrics used to determine the user interface complexity in NPES are: 1234-
Overall user perception for NPES user interface and screen design, Effectiveness of display characteristics such as characters, highlighting, bolding, coloring, Accessibility of NPES from the host system (accessibility), Information amount and display (organization of information, easy access to information, adequacy of information levels, consistency of information display), 5- User's perception of differences between chart representations in two versions (chart representation), 6- Consistency of display and system terminology (terminology),
Proceedings of the Tenth Americas Conference on Information Systems, New York, New York, August 2004
3438
Coskun et al. 7- Ease of learning and obtaining information from screen information), 8- Users' perception of advisory screen designs, 9- Perceived complexity of screen design (complexity), and 10- Understandability of user interface (understandability).
Impacts of User Interface Complexity in Safety-Critical Systems and reaching details (learning, and ease of reaching
In order to determine how NPES information is used by users, how helpful it was, and how it impacted users' decisions, metrics measuring these issues are used. These metrics are: 1- NPES recommendation acceptance score: this metric measures the average score of NPES recommendations accepted by the users during decision-making. 2- The user’s understanding level of NPES output: This metric measures the user's understanding level for NPES output. Since output included screen, chart, and all NPES user interfaces, three sub-metrics were determined. 3- User perception of support level for wide variety of decision types: This metric was used to measure NPES support for different user tasks such as situation monitoring support level, threat determination support level, threat avoidance support level, and maneuvering support level. 4- Screen complexity: This metric measures the users' ratings for NPES screen complexity. 5- Usefulness of provided information: Usefulness of information as well as amount and display characteristics is another user interface characteristic. 6- Users perception of intelligence level of system output: Users' perceptions of quality and intelligence level for NPES output is measured. 7- Usability of NPES: This metric measures the overall usability of NPES from the users' perspectives. 8- Attention requirement: Complex user interfaces in EIRTS can require users to pay more attention to details. In order to measure users' perceptions of attention requirements, this metric is utilized. 9- Cognitive skills requirement: After users saw and gathered data from the user interface, they also processed that data and information to make decisions. They used cognitive skills for this processing. Normally, raw data requires more processing and more cognitive skills, while processed and interpreted data requires less process, and less cognitive skills. Results
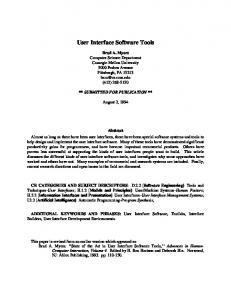
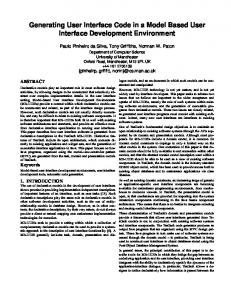
All metric values were calculated based on user scores (7 point Likert scale) for the questionnaire questions. Then results were analyzed to determine the level of user interface and decision support and explanation complexity for NPES-1 and NPES-2. The average values and significance test results are presented in Tables 2 and 3. In tables 2 and 3, the more complex NPES version for each complexity type highlighted, along with statistically significant differences between the NPES versions, based on 2-tailed t-tests. The results for the user interface complexity analysis shows that for all 10 metrics chosen, subjects preferred the NPES-1 user interface, and for some metrics, the preferences were statistically significant (metrics 1, 2, 3, 4, 5, and 10). The others were not significant at the 0.05 significance level. Users significantly preferred NPES-1 for screen design and interface (pvalue=0.001), display characteristics such as highlighting, bolding, coloring (p-value=0.028), accessibility from SmartBridge™ and to SmartBridge™ (p-value=0.002), amount and organization of information (p-value=0.014), ease of finding and retrieving information (p-value=0.026), chart characteristics (p-value=0.056), and overall screen understandability (p-value=0.00004). For other user interface-related characteristics such as terminology, learning and ease of use, and information adequacy and consistency, users' preference was still NPES-1, but the preference levels were not statistically significant at the 0.05 level. The results for the decision support and explanation complexity metrics also show that the subjects significantly preferred NPES-1, a finding that was significant at the 0.05 significance level. Users found NPES-2 screen complexity and attention requirements significantly greater than NPES-1 (metric 4, p-value=0.004), a negative indication. At the same time, users found the NPES-1 screen and chart significantly easier to understand (metric 2, p=0.033 and 0.0039), more supportive (metric 3, p- values =0.0026, 0.008, 0.046), more useful (metric 5 p=0.008), and perceived more intelligent (metric 6, p=0.046).
Proceedings of the Tenth Americas Conference on Information Systems, New York, New York, August 2004
3439
Coskun et al.
Impacts of User Interface Complexity in Safety-Critical Systems
Metrics
NPES-1
NPES-2
t-value
p-value
Complex Version
1- Operator perception of NPES interface
5.79
4.31
3.50
0.001
NPES-2
2- Display Characteristics
5.88
5.01
2.01
0.028
NPES-2
3- Accessibility of NPES from host
5.63
4.72
3.22
0.002
NPES-2
a) Organization, amount of info
5.31
4.29
2.33
0.014
NPES-2
b) Ability to find/retrieve information
6.00
5.00
2.11
0.026
NPES-2
c) Adequacy of levels of information
5.54
5.18
1.18
0.121
NPES-2
d) Consistency of information display
6.09
5.54
1.29
0.105
NPES-2
5- Operator perceptions of chart differences
6.54
5.27
1.656
0.056
NPES-2
6- Consistency of user interface terminology
6.2
6.0
0.44
0.33
NPES-2
7- Ease of learning user interface
5.75
5.73
0.076
0.469
NPES-2
8- User interface design complexity
5.84
5.50
1.101
0.141
NPES-2
9- User Interface Understandability
5.90
4.82
3.895
0.00004
NPES-2
4- Complexity of User Interface
Table 2. User Interface Complexity Analysis for NPES-1 and NPES-2
Metrics
NPES-1
NPES-2
t-value
p-value
Complex Version
4.958
3.25
1.8147
0.0416
NPES-2
6.33 7 5.67
3.0 2.66 4.67
2.5 4.91 1.061
0.033 0.0039 0.174
NPES-2 NPES-2 NPES-2
- Support for Situation Monitoring
6.67
3.0
5.5
0.0026
NPES-2
- Support for Threat Determination
5.67
4.0
0.945
0.199
NPES-2
- Support for Threat Avoidance
6.33
3.33
4.025
0.008
NPES-2
- Support for Maneuvering
6.0
3.66
2.21
0.046
NPES-2
4- Screen Complexity
3.0
6.33
-5.0
0.004
NPES-2
5- Usefulness
6.33
3.33
4.025
0.008
NPES-2
6- Perceived intelligence level of system output
6.0
3.66
2.24
0.046
NPES-2
7- NPES is difficult to use
4.0
3.66
0.5
0.322
NPES-2
8- Requires more attention
4.66
5.33
-0.707
0.259
NPES-2
9- Requires more cognitive skills and thinking
6.33
6.33
0
0.5
NPES-2
1- NPES Recommendation Acceptance Score 2- Users Understanding level a) Screen Understandability b) Chart understandability c) Overall NPES Understandability 3- User perception of Support Level
Table 3. Decision Support and Explanation Complexity Analysis for NPES-1 and NPES-2
Proceedings of the Tenth Americas Conference on Information Systems, New York, New York, August 2004
3440
Coskun et al.
Impacts of User Interface Complexity in Safety-Critical Systems
These findings are consistent with the post-experiment interviews, where subjects reported that since NPES-1 user interface and especially the NPES-1 chart provided more raw data, they felt they were making decisions with more information with NPES-1. Also, the subjects reported that since NPES-1 user interface was showing information passively (did not require clicking to get further details), they were getting information more easily with NPES-1 than with NPES-2. This feedback also indicated that the listed metrics (especially chart, screen complexity, attention, and cognitive skill requirements, and ease of information gathering) were used by subjects to determine decision support/explanation complexity. The results also show that NPES-1 recommendations were accepted by subjects at a significantly higher rate than NPES-2 (p-value 0.0416), indicating that subject decisions were supported better with NPES-1. The subjects' ratings also show that NPES-1 support for situation monitoring, threat avoidance, and maneuvering tasks -- the key elements of navigation decision support-- are significantly better (p-values=0.0026, 0.008, 0.046 respectively), also indicating better decision support for users. After all these analyses, we conclude that NPES-2 user interface is more complex than NPES-1 user interface and the users thought that NPES-1 was providing better support. INTERVIEW RESULTS
Interviews with all 3 subjects before, during, and after the experiments (scenario runs) were conducted and their understanding of NPES, NPES complexity, and possible impact areas for complexity were gathered during these interviews. A summary of subjects' opinions and feedback on different issues are summarized under different topics. Users' Perception of NPES in General
All subjects reported that they believed NPES would definitely help decision-makers on a ship, and they reported that they would like to see and use NPES during their work. However, job threat was a concern for all subjects, especially experienced users. They reported that NPES would not (and should not) replace humans, and they cannot trust NPES results. They also mentioned that they would be cautious when they use NPES, while a relatively inexperienced subject said he would use the system most of the time. All users preferred NPES as a raw data provider, and as a warning system when there was a threat, collision risk, or when ownship exceeds certain limits. This perception played an important role in complexity. For example, although NPES-2 recommendations were complete, more detailed, and more informative, users preferred NPES-1's short and not very detailed recommendations. When they were asked why they preferred NPES-1, their answers cited different issues, such as chart type, user interface design, ease of information gathering, and the summary information provided by NPES-1. This shows that users prefer to be decision-makers and not applicators for these type of systems. They would like to gather necessary data and process information, but they would not like the system to do everything for them. This was particularly true for experienced users. NPES Complexity
When users were asked what was their understanding of NPES complexity, they reported mostly about user interface and usability-related issues such as chart type, ownship and target-ship symbols, and reaching detailed explanations of NPES recommendation and information.. Users preferred "passive" (one of the user's definition) screens, which means that users do not have to click somewhere in order to get information or detail. The information and data should be provided on the screen automatically. Another complexity issue was users' familiarity with the system features. For instance, since NPES-1 uses raster charts which are scanned from the paper charts used by navigators and pilots, and NPES-2 uses vectorized electronic chart, users significantly preferred NPES-1 charts. They mentioned that their familiarity with raster charts was a determining factor for NPES-1 preference. NPES Functionality and Improvements
Users mentioned that they would like to see NPES as an aid and not as a director, telling them what to do. They said that NPES should show all available information, but should not make decisions for them. They found most NPES features helpful and a good tool for decision-making. NPES was especially helpful for situation assessment. All three users agreed that advisories provided significant input for decision-making. NPES' help with situation assessment, threat detection, collision avoidance tasks were also mentioned, although the users did not always agree with NPES solutions. This was particularly true for NPES-2, where users disagreed with almost 50% of NPES recommendations. However, they also mentioned that NPES-2 screen design was poorer because of the vectorized chart, and the double clicking requirement for detailed information. These factors were important for their decisions. When they were asked how to improve NPES, they reported that more details about NPES reasoning after each recommendation or warnings; more information about the target
Proceedings of the Tenth Americas Conference on Information Systems, New York, New York, August 2004
3441
Coskun et al.
Impacts of User Interface Complexity in Safety-Critical Systems
vessels such as speed, direction, type, weight, and class should be added to NPES. Also, NPES details of assumptions for recommendation and warnings, and better display of ownship and targetship on the screen were reported as new improvement areas. One last functionality improvement reported was adding aural warnings for alerts/alarms. These results also underscore the importance of user interface designers talking with system users during and after the development of interface. Interface designers and real-life users see and evaluate issues differently. The intention for changes from NPES-1 to NPES-2 was providing more functionality, more details and information, and better support to users. However, this study showed that users were not thinking the same thoughts as developers and designers about improving the system. The user performance analysis and feedback from users showed that operator performance would be enhanced with the less complex NPES-1. User scores were significantly favorable toward NPES-1 for decision accuracy, user confidence, decision quality, system and output understandability, and system usability. In addition, users found NPES-2 to be significantly more stressful, requiring more attention, inducing more fatigue, and more complex to use. For workload, decision time, and physical effort metrics, NPES-1 was preferred by users, although the results were not significant at the 0.05 significance level. LIMITATIONS
This study has a number of limitations that should be considered when interpreting the results. Many of these limitations are associated with empirical investigations of operational systems, and are not unique to this research. This study was an investigation of a single system deployed aboard a single vessel operating in a safety-critical system. The second limitation is associated with the number of operators utilized in the operator performance experiments. The subject pool for qualified operational ship navigation officers was relatively small, and those with experience in ship simulation and vessel navigation and piloting (rather than ship logistics, or weapon systems, or engineering systems) further restricted the available subject pool. The strength of the results could clearly have been enhanced with a larger subject pool for the operator performance experiments. The third limitation is related to experiment setting. The ideal environment for assessments of the impacts of complexity on operator performance is the domain under study, the marine transportation system in San Francisco Bay. The authors have had experience with operational studies in similar environments (Grabowski & Sanborn, 2001). However, the sponsors for this study were most comfortable with empirical assessments of the system capabilities in simulation, rather than operational, mode. Comparative studies of simulated and operational results are the subject for further research. CONCLUSIONS AND FUTURE RESEARCH DIRECTIONS
This study shows the importance of user interface and decision support explanation complexity on users' perceptions. The differences between the two user interface designs affected users' decisions, preferences, and perceptions. This should always be considered and given priority for the systems in safety-critical environments where human users are decision-makers and beneficiaries of system output and results. Another important issue is usability vs. functionality. Increasing system functionality will result with more complex system and probably system usability will decrease. Does this mean we need to sacrifice from usability? Can we should balance functionality and usability, especially in safety-critical systems which requires both. How training and operator background are related with complexity could be another research topic. If operators are trained can they accept more complex systems with more functionality? More detailed research with safetycritical systems and their operators in real-life settings is needed. REFERENCES
1.
Adelman, L., Cohen, M.S., Bresnick, T.A., Chinnis, J.O., and Laskey, K.B. (1995) Real-Time Expert System Interfaces, Cognitive Processes, and Task Performance. In S. Andriole and L. Adelman (editors), Cognitive Systems Engineering for User-Computer Interface Design, Prototyping, and Evaluation. New York: Lawrence Erlbaum Associates, Inc., 1995, 148-170.
2.
Andriole, S. and Adelman, L. (1995). "Case Studies" Chapter 4 in Cognitive Systems Engineering for UserComputer Interface Design, Prototyping, and Evaluation, Stephen Andriole and Leonard Adelman. Lawrance Erlbaum Associates, Inc., pp. 148-170 ISBN: 0-8058-1244-x.
3.
Beynon-Davies, P. (1999) Human error andinformation systems failure:the case of the London ambulance service computer-aided dispatch project, Interacting with Computers 11(1999) 699-720.
4.
Chignell, M.H. (1990) A Taxonomy of User Interface Terminology. SIGCHI Bulletin 21:4.
Proceedings of the Tenth Americas Conference on Information Systems, New York, New York, August 2004
3442
Coskun et al.
Impacts of User Interface Complexity in Safety-Critical Systems
5.
Coenen, F.P., Smeaton, G.P., and Bole, A.G. (1989) Knowledge-based Collision Avoidance. Journal of Navigation (UK). 41:1, 107-116.
6.
Dailey, D.J., Haselkorn, M.P. and Lin, P. (1993) Traffic Information and Management in a Geographically Distributed Computing Environment. In Proceedings of the Pacific Rim 3rd International Conference on Applications of Advanced Technologies In Transportation Engineering, Tokyo, 159-165.
7.
Dix, A., Finley, J., Abowd, G., and Beale, R. (1998) Human-Computer Interaction 2nd edition, Prentice-Hall,Upper SaddleRiver, NJ.
8.
Gerhardt-Powals, J., Javecchia, H., Andriole, S.J., and Miller III, R. (1995) Cognitive Redesign of Submarine Displays. In S. Andriole and L. Adelman (editors), Cognitive Systems Engineering for User-Computer Interface Design, Prototyping, and Evaluation. New York: Lawrence Erlbaum Associates, Inc., 194-231.
9.
Grabowski, M., and Sanborn, S.D. 2001. Evaluation of Embedded Intelligent Real-Time Systems. Sciences, 32:1, Winter 2001, 95-123.
Decision
10. Halang, W.A., Sniezek, M., and Colnaric,M. (1998) Computerized controllers for safety-critical medical applications. International Journal of Medical Informatics 49 (1998) 139-155. 11. Heudin, J.C. (1991) KOS: A Knowledge-based Operating System For Real-Time Onboard Applications of Artificial Intelligence. Proceeding of Euromicro '9. Los Alamitos, California: IEEE Computer Society Press, 138-144. 12. Hoffman, R.B., Riley, B.R. and Dion, F.A (1998) Work Activities and Operational Errors at Selected Vessel Traffic Services, Proceedings of the Human Factors and Ergonomics Society 42nd Annual Meeting pp.1190-1194. 13. Kapasouris, P., Serfaty, D., Deckert, J.C., Wohl, J.G. and Pattipatyi, P. (1991) Resource Allocation and Performance Evaluation in Large-Human Machine Organizations" IEEE Transactions on Systems, Man & Cybernetics, 21(3), pp: 521-532. 14. Leveson, N.G., Turner, C.S. (1993) An Investigation of the Therac-25 Accidents. IEEE Computer, 26:7, 18-41. 15. Martelli, S.,Nofrini,L., Vendruscolo,P.and Visani,A (2003) Criteria of interface evaluation for computer assisted surgery systems, International Journal of Medical Informatics, 72, 35-45. 16. McKenzie, D. (1994) Computer-related accidental death: an empirical exploration, Science and Public Policy 21(4) (1994) pgs. 233-248 17. Neumann, P.G. (1991) Inside Risks: Putting on your best interface, Communications of ACM 34,3. 18. Perry, T.S. (1997) In Search of the Future of Air Traffic Control. IEEE Spectrum, August 1997. 19. Rouse, W.B., Geddes, N.D., and Hammer, J.M. (1990) Computer-aided Fighter Pilots, IEEE Spectrum. 27(3), 38-41. 20. Rowe, D.W., Sibert, J., and Irwin, D. (1998) Heart Rate Variability: Indicator of User State as an Aid to HumanComputer Interaction. Proceedings of the CHI'98 Human Factors in Computing Systems Conference, Los Angeles, California. 21. Schneiderman, B. (1998) Designing the User Interface: Strategies for Effective Human-Computer Interaction, 3rd edition. New York: Addison Wesley Longman. 22. Wong, S.K. and Kalam, A. (1995) Development of A Power Protection System Using An Agent-Based Architecture. Proceedings of International Conference on Energy Management and Power Delivery. 1, 433-438.
Proceedings of the Tenth Americas Conference on Information Systems, New York, New York, August 2004
3443