Developments in Business Simulation and Experiential Learning, Volume 31, 2004
IMPLEMENTATION AND IMPACTS OF THE BALANCED SCORECARD: AN EXPERIMENT WITH BUSINESS GAMES David Kallás University of São Paulo
[email protected] Antonio Carlos Aidar Sauaia University of São Paulo
[email protected] more and more competitive in the international and domestic scenario, broadening their knowledge of management tools.
ABSTRACT Treated initially as a performance measure system, the balanced scorecard has evolved and today it is possible to state that it is a management tool. It presents an ordination of previous concepts and ideas in logic, objective and intelligent form. A study was performed with 32 simulated companies. In the experiment, the balanced scorecard was implemented in 5 companies and the results were compared to the remaining 27. It was observed with statistic significance that the experimental group (the 5 simulated companies) performed better than the control group (the other 32) in terms of the game total score. KEYWORDS: strategic management, strategy, strategic planning, business games
INTRODUCTION From Taylor’s Scientific Management School until nowadays, concepts have been evolved in a vertiginous rhythm. Constant launching of theories had led to a diversity of new proposals of business management tools (FERREIRA et al., 2002:3). According to ROSENBURG (2001), many of the 10,000 worldwide-published business books from 1998 to 2001 treat new ways to manage business. Their validity is incontestable, as a rule, though being a responsibility of the most aware manager to notice in which degree these contributions differ, under the several given names, and whether these new proposals might or should be adopted in his/her company. A typical case of analysis is the balanced scorecard. Originally presented by KAPLAN & NORTON (1992) as a tool to monitor corporate performance, its potential has developed and turned out to be seen as a strategic management tool for large, medium and small-size organizations, also including the possibility for individual and team application. Soon after its creation, the concept was widely disseminated and implemented by executives all over the world. The efficiency of the method has elicited distinct opinions among the companies due to the different context in which each application was implemented. These apprehensions, grown in both the academic and professional environment, have motivated this study to be performed. Additionally to this fact, there is an inherent wish that this study may help organizations to become
242
REVIEW OF LITERATURE The balanced scorecard (BSC) may not be derived from strategic management concepts. Its origin is related to the limitation of the traditional performance measurement methods (KAPLAN & NORTON, 1992:71), what in fact is one of the strategic planning problems pointed out by ANSOFF et al. (1976:8). Nevertheless, following its evolution, the instrument has become an important strategic management tool. More than a trivial measurement exercise, the BSC motivates breakthrough improvements in critical business areas, such as product development, internal processes, customers and marketing (KAPLAN & NORTON, 1993:134). The balanced scorecard is a management tool that materializes the corporate vision and strategy through a coherent map that includes goals and performance measures organized according to four distinct perspectives: financial perspective, customer perspective, internal processes perspective, and learning & growth perspective. These measures should be interconnected in order to communicate a small number of general strategic issues, such as the corporate growth, risk reduction or productivity enhancement (KAPLAN & NORTON, 1997:24-25; 44). After the onset of this management tool and initial applications to North American corporations, not only authors but also executives realized that its scope had expanded the original concepts (JÚLIO & NETO, 2002:181; CAMPOS, J., 1998:64). Concurring with this view, KAPLAN & NORTON (2000a:18) noticed that successful corporations that applied the balanced scorecard solution revealed a consistent pattern in the provision of focus and strategic alignment. “Although each organization had approached the challenge on its own way, with different rhythms and sequences, we observed the occurrence of five common principles, which we called principles of strategyfocused organization”: • Principle #1: Translate strategy into operational terms: it is not possible to implement a strategy without describing it first. Strategy mapping and the balanced scorecards take care of deficiencies in tangible assets measurement systems of the industrial era. The links in the measurement of cause
Developments in Business Simulation and Experiential Learning, Volume 31, 2004 and effect relations at the strategy mappings show how intangible assets turn into (financial) tangible results. The scorecard schema uses quantitative, but non-financial indicators (such as cycle times, market share, innovation, satisfaction and competence), what makes possible the description and measurement of the value creating process, instead of a trivial inference (KAPLAN & NORTON, 2000a:20-21). • Principle #2: Align the organization to create synergies: this principle represents the corporate BSC, cascaded for the business and shared services units of the organization according to the vision of internal processes. • Principle #3: Transform strategy in everyone’s job: strategy-focused organizations require that all employees understand the strategy and conduct their daily routine jobs in order to contribute to accomplish its goals. In many cases, individual scorecards were also implemented to define personal goals. Finally, each one of the successful organizations linked the incentives program and rewarding system with the balanced scorecard (KAPLAN & NORTON, 2000a:22-23). • Principle #4: Make strategy a continuous process: successful corporations in adopting the balanced scorecard implemented a strategic management process. The so-called double-loop process integrates tactical management (financial budgets and monthly evaluation reports) with strategic management into a single continuous and unceasing process. • Principle #5: Executive leadership to mobilize change: A successful balanced scorecard solution begins by realizing that it is not a measurement project but a changing program. In the initial stage, the focus is positioned to mobilize and generate impulse to launch the process. After mobilizing the organization, the focus is re-calibrated on governance (EPSTEIN & WISNER, 2001). And finally, a new management system is gradually developed – a strategic management system that institutionalizes the new cultural values and new structures in the new management model. The new subsequent stages may be carried out in a two or three years’ period (KAPLAN & NORTON, 2000a:26-27). An expressive contribution of balanced scorecard is the alignment of lag indicators with lead indicators in a logic form and aligned to the strategy. STERN STEWART (1999) recognizes that the BSC can be complemented with other strategic and tactic management tools, such as the ActivityBased Costing (ABC) and Economic Value Added (EVA). The ABC helps managers to better understand the costs and capital structure, while BSC schema enlarges the management view of non-financial matters and EVA drives managers to create value. This view is also shared by SHINOHARA (2003:11). It can be stated that in the analysis and implementation of the strategy, the BSC considers different stakeholders. The stakeholders analysis provides elements to compare several perspectives and come to a decision, which is a tool also used by SAUAIA & KALLÁS (2003) to analyze the “cooperate for profits or compete in oligopolistic markets” dilemma. Another benefit is related to the communication of the strategy within the organization (YOUNG & O’BYRNE 2001:291). The BSC describes the corporate vision of the future
for all the organization in order to establish shared goals. A holistic model of strategy is created, showing to all employees how they can contribute to achieve organizational success (KAPLAN & NORTON 1997:154). CAMPOS, J. (1998:105) argues that another BSC’s benefit is related to focus on business actions. Although the balanced scorecard provides senior executives with additional measures, it minimizes the amount of information to be analyzed by focusing on the most critical matters and restricting the number of indicators to be used. Despite its limitations, strategic planning is by far the most popular tool used within the organizations, a particularly powerful one if allied to the balanced scorecard. Annual studies performed by BAIN & COMPANY (2001) search to verify which are the most popular management tools in Brazil and in the world, as well as their satisfaction level. According to the Brazilian results, strategic planning is the most applied management tool and the second by satisfaction level. On the other hand, the balanced scorecard is a recent tool that is rapidly spreading out. Its application increased to 56% of total responses in 2001 as compared to 30% registered in 2000. Considering the satisfaction aspect, it ranked fourth with a 4.29 grade in a maximum of 5.0. Some criticisms have been voiced in literature. YOUNG & O’BYRNE (2001:301) observe that some BSC users tend to confuse the means with the ends. Investment in customers, supplier and employee relationship management are not corporate goals, but means to aggregate value to shareholders. When managers forget this fundamental aspect, the balanced scorecard may become an excuse to defend the organization’s failure to perform higher financial results. BOYETT & BOYETT (1999:269) alert about the connection matter between goals and BSC indicators: “In real world, the association between cause and effect is rarely so clear. In most situations we should be satisfied by only including a good many of the right measures in the scorecard, without trying to figure out the relation among them”. KAPLAN & NORTON (1996, 1997, 2000a, 2000b) recognized such limitation several times, when they stated that the BSC built by a company is an initial hypothesis. The business strategy defines a rationale of how value will be created to the shareholders. It defines actions and resources required to meet the targeted results. As such, it is based on a group of premises that must be tested (NORTON, 2001:1). An excellent set of measures does not guarantee itself a winning strategy. The failure in converting operational performance into financial results must send executives back to the “drawing table” to rethink their business strategy or their strategy implementation plan (KAPLAN & NORTON, 1992:77). There are many attempts to complement the simplicity of BSC with more complex models. AKKERMANS & OORSCHOT (2002) suggest complementing BSC with system dynamics methodology, just to mention one of them.
243
RESEARCH PROBLEM Based on the wide acceptance of BSC and the concerns of several authors regarding its actual contribution, the burning question that arises is the following: Does the balanced
Developments in Business Simulation and Experiential Learning, Volume 31, 2004 scorecard application have an impact on corporate success indicators? Success will be measured through an experiment and a comparative analysis of the seven corporate performance
indicators within the experimental environment of the MMG – Multinational Management Game, (KEYS et al., 1992) shown in The purpose is to reject the following hypothesis H0 (the experimental application of the balanced scorecard in simulated companies does not produce positive impact on their success indicators).
Exhibit 1.
Exhibit 1 - Success Indicators of the experiment Indicator Return on Equity (ROE) Return on Sales (ROA) Return on Assets (ROA) Market Share Asset Turnover Inventory Turnover Debt to Total Assets Total Score
Description Net profit of the period divided by average equity. Net profit of the period divided by net sales. Net income divided by average assets. Weighted average of the market share of products. Net income of the period divided by average assets. Costs of products sold in the period divided by the average between initial and final stock. Total debt over total assets. Overall score based on the sum of relative rank performance of each of the seven indicators above.
RESEARCH METHOD Given the validity and invalidity points of each type of experiment, and all environmental features of the business games considered, the chosen experiment was: “to pre-test and post-test with casual experimental and control groups”. According to CAMPBELL & STANLEY (1979:16), this is one of the most recommended methods. LAKATOS & MARCONI (2000:242-243) state that this method employs two paired groups. That one, in which an experimental variable is introduced, is denominated experimental group, while the other group that is under no influences works as the control group. Both groups are observed simultaneously, but no experimental variable is introduced into the control group. For this reason, the difference between measures taken after and before in the control group (O’2 - O’1) is supposed to be the result from actions of uncontrollable variables or factors, while, in the experimental group (O2 - O1), the same difference corresponds to the action of the experimental variable plus the same uncontrollable events observed in the control group. Thus, the experimental variable effect can be determined by subtracting the difference of the two measures in both the control group and the experimental group: [(O2 - O1) - (O’2 - O’1)]. Exhibit 1 above. The BSC application in the simulated companies of the experimental groups started between run 2 and 3, out of 7 runs of the total game application. The balanced scorecard application process was similar for all the companies. The companies spent the same amount to pay the consultant, though within different commercial conditions (resulting from an uneven negotiation effort among them). The BSC design process (strategy map building and selection of strategic indicators) was performed in a relatively short period of time (immediately after the acquisition of the consulting
DESCRIPTION OF THE EXPERIMENT Two groups were evaluated, an experimental and a control one, formed by students of the discipline “Business Games” (EAD-472) offered in the graduate program of Business Administration and Accounting courses at FEA/USP – Brazil. In this discipline a fictitious market simulation is run, where the companies, formed by students, define prices, investment volume, wages, and other identical decisions taken in real companies. These simulations are compiled in the MMG software that simulates market conditions from certain parameters and generates the results for the teams, which, based on these results, will make their new decisions to the next period. This research analyzes the results of two groups, one of them (experimental group) formed by teams that used the balanced scorecard. The analysis was performed through the comparison of results between the groups that used this method (X) and those that did not use it (O), all based on the success indicators described at services). The rationale to build the BSCs was the same, as well as a limited number of goals and indicators was maintained in order to preserve the simplicity, as recommended in the method. No BSC had less than 10 or more than 14 strategic objectives (average of 11.4 objectives), as well as an average of 1.54 indicators was identified for each objective. This average is in compliance with the recommendation of KAPLAN & NORTON (2000a:393) that the BSC should have an average of 1.5 indicators per objective.
243
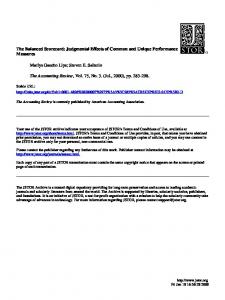
Developments in Business Simulation and Experiential Learning, Volume 31, 2004 Exhibit 2 illustrates one of the five BSCs of the experiment (a company called “Antarctic Tech”), in which the boxes represent the strategic objectives for each perspective, and beside each objective its strategic indicators is showed. For this
243
case, there are 21 strategic indicators. From the seven performance indicators that compose the overall total score, only 5 appear in Antarctic Tech’s BSC, indicating its strategic focus.
Developments in Business Simulation and Experiential Learning, Volume 31, 2004 Exhibit 2 – Balanced Scorecard for the “Antarctic Tech” Company Mission: Enhance client productivity by supplying highly quality and performance equipments
ROE ROA
Enhance Profitability
Acquire profitable clients
ROS
Debit over total Income
Maintain debt at adequated level
Profit by client Asset Turnover Productivity by ws A and B
Enchance liquidity
Finantial perspective
Offer high value product to the client
Internal Processes Perspective
Price / Market average price for products A and B
Quality Image
Client perspective
Have excelent R&D processes
Produt. A Produt. B P&D / Income
Improve client service level
Advertising/Income Advertising Commision for sellers
Maintain low inventory level Inventory turnover
Frequency of extra-class meetings High performance team
Employees satisfaction Amount of time spent between classes (h) turnover/abs Wages paid / market average
Learning and Growth Perspective
ANALYSIS OF RESULTS The quantitative analysis of BSC effects on the indicators of the simulated companies was carried out by comparing the performance deltas measured before and after the BSC implementation to the experimental group (EG) and control group (CG). In this case, the analysis of the difference between before and after was executed through repeated measures of Exhibit 3 presents a summary of the main results of the mentioned non-parametric tests.
related data, according to Wilcoxon and Friedman nonparametric tests. To analyze the experimental and control groups, a comparison of the independent averages was performed; in this case, the Mann-Whitney non-parametric test was applied (STEVENSON, 2001:307-334), once the sample size did not permit to apply the parametric t- test as suggested by CAMPBELL & STANLEY (1979:42). For the analysis purposes, a significance level of 5% was considered.
Exhibit 3 – Success Indicators of the experiment
P of significance
Analysis Non-parametrical test Total Score Inventory turnover Assets turnover Debt to Total Assets Return on sales (ROS) Return on equity (ROE) Return on assets (ROA) Market share
7 paired variables CG
7 paired variables EG
Friedman 0.978 0.003 0.028 0.702 0.094 0.885 0.804 0.930
Friedman 0.008