system utilizing one dimensional convolutional neural networks (CNNs) arguably .... A Matlab code was written and used to create the vectors UF and DF .
Structural Damage Detection in Real-Time: Implementation of 1D Convolutional Neural Networks for SHM Applications
Onur Avci1, Osama Abdeljaber1, Serkan Kiranyaz2 and Daniel Inman3
1
Department of Civil and Architectural Engineering, Qatar University, Doha, Qatar.
2
Department of Electrical Engineering, Qatar University, Doha, Qatar.
3
Department of Aerospace Engineering, University of Michigan, Ann Arbor, MI, USA.
ABSTRACT Most of the classical structural damage detection systems involve two processes, feature extraction and feature classification. Usually, the feature extraction process requires large computational effort which prevent the application of the classical methods in real-time structural health monitoring applications. Furthermore, in many cases, the hand-crafted features extracted by the classical methods fail to accurately characterize the acquired signal, resulting in poor classification performance. In an attempt to overcome these issues, this paper presents a novel, fast and accurate structural damage detection and localization system utilizing one dimensional convolutional neural networks (CNNs) arguably for the first time in SHM applications. The proposed method is capable of extracting optimal damage-sensitive features automatically from the raw acceleration signals, allowing it to be used for real-time damage detection. This paper presents the preliminary experiments conducted to verify the proposed CNN-based approach. Keywords: Real-time structural damage detection • Damage identification • Structural health monitoring • Convolutional neural networks • Infrastructure health
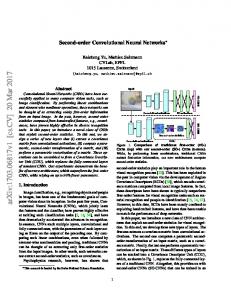
1. Introduction Regular inspection of large infrastructure is a time and resource consuming process. Therefore, several structural damage detection systems have been developed in an attempt to automatically identify and localize the damage. Previous studies suggest that nonparametric global damage detection methods are ideal for monitoring of large civil structures [1,2]. These methods utilize statistical techniques to analyze the measured vibration response in order to evaluate the condition of the monitored structure [3]. Recently, researchers started to explore machine learning approaches to develop new nonparametric global methods for damage detection. Generally, the currently available machine learning based damage detection approaches involve two tasks, feature extraction and classification. The first task requires extracting hand-crafted features that capture the most distinctive information in the measured acceleration signals which can be correlated to the structural damage. The second task involves training a certain classifier that is used to classify the extracted features and identify the structural damage. Several features and classifiers have been implemented in structural damage detection systems. Examples of the feature extraction techniques used for machine learning based damage detection include principal component analysis [4], autoregressive modeling [5], simple statistical analysis [6], and wavelet transform [7]. Also, artificial neural networks [4] and support vector machine [8] are some examples of the classifiers used for feature classification. It is obvious that the performance of machine learning based damage detection methods relies on the hand-crafted features as well as the selected classifier. Consequently, one should be careful when choosing the extracted features to ensure that they characterize the most important information in the analyzed signals. Additionally, based on the extracted features, a suitable classifier should be trained to classify these features correctly. Therefore, researchers usually follow a trial-and-error approach in an attempt to obtain the best features/classifier combination. However, there is no guarantee that a particular combination which appeared to be appropriate for a certain structure would be a suitable choice for other structures. Certainly, extracting sub-optimal features or using unsuitable classifier will adversely affect the performance of the damage detection system. Another issue is that the feature extraction/classification approach requires large computational effort, which prevents the use of machine learning based methods for real-time SHM. The study presented in this paper attempts to resolve the problems associated with the classical machine learning based methods by using 1D convolutional neural networks (CNNs). One of the most attractive attributes of CNNs is that they merge feature extraction and classification tasks into a compact learning body. Therefore, CNNs are capable of learning the optimal features and classifier parameters based on the raw data only. Recent studies have shown that CNNs outperform conventional machine learning methods in many problems such as object recognition in images [9], classification of electrocardiogram (ECG) signals [10], and fault detection in power engines [11]. Researchers at Qatar University (QU) are currently conducting extensive experimental and analytical studies on SHM of stadiums. Therefore, a large grandstand simulator with a footprint dimension of 4.2×4.2 m is being constructed at QU to serve as a test bed [12]. So far, only the main steel frame of the grandstand simulator has been constructed as shown in Figure 1. This steel frame has several beam-to-girder connections which can be loosened to simulate structural damage (stiffness loss at the joints). The research team employs the structure to test different damage detection algorithms before finalizing the construction. This paper reports the preliminary experimental results on the QU grandstand simulator to validate the proposed CNN-based damage detection algorithm. The rest of this paper is organized as follows. Section 2 briefly explains 2D and 1D CNNs. Section 3 introduces the proposed damage detection algorithm. Section 4 details the preliminary experiments conducted to verify the CNN-based algorithm. Finally, the experimental results are discussed in Section 5, while the conclusions are provided in Section 6.
Figure 1. Qatar University grandstand simulator.
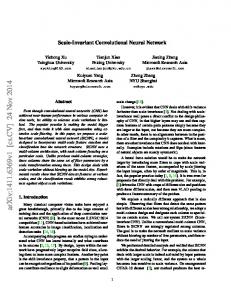
2. 1D and 2D CNNs CNNs are feedforward neural network with a neuron pattern inspired by the structure of human visual cortex. Standard CNNs (i.e. 2D CNNs) are typically used for classifying two-dimensional inputs such as videos and images, while 1D CNNs are used to analyze 1D signals. A standard 2D CNN with an input layer of size 28×28 is shown in Figure 2. This CNN contains alternating convolution and sub-sampling layers followed by a number of multi-layer perceptron (MLP) layers. The MLP layers process the outputs of the convolution layers to generate an output vector that represents the classification of the input signal. The architecture of a 2D CNN depends on the sizes of the convolution layers and the sizes of the MLP layers of the kernel size and the sub-sampling factor, which were set in Figure 2 as 5 and 2, respectively. Unlike traditional filters that have predefined parameters, the parameters of the 2D filter kernels in CNNs are automatically optimized by back propagation. 1D CNNs are similar to their 2D counterparts but with some structural differences [10]. Obviously, the main difference is that the 1D CNNs deals with 1D arrays rather than 2D matrices, which means that 2D matrix operations in 2D CNNs should be replaced by their 1D equivalents. Also, similar to the 2D CNNs, the training of 1D CNNs is carried out through back propagation. The reader is referred to [10] for more details on the forward and back propagation operations in 1D CNNs.
Input Image (28x28) R, G, B
Conv. layer 24x24 Sub-samp. layer Conv. layer 12x12 8x8 Sub-samp. layer 4x4 MLP layers
Output (class vectors)
Figure 2. A standard 2D CNN [10]. 3. The proposed CNN-based algorithm As shown in Figure 1, the steel frame of QU grandstand simulator has 25 filler beams connected to six horizontal beams. Structural damage can be simulated by loosening the bolts at beam-to-girder connections. In this preliminary study, only the five connections marked in Figure 1 were considered. As explained in Section 4, an accelerometer is placed at each one of these five joints. Also, a modal shaker is used to apply random excitation to the structure. The proposed CNN-based algorithm is supposed to analyze the five acceleration signals in order to identify the damage and locate the damaged joint (if any). The main idea of the proposed algorithm is to train a single 1D CNN classifier for each joint. This classifier is supposed to process the acceleration signal measured at its corresponding joint and determine whether this joint is damaged or not. To train the five CNNs corresponding to the five joints, it is required to obtain a data set that contains undamaged and damaged acceleration signals collected at each joint. To generate this data set, it is required to conduct a total of 5+1=6 experiments. In the first experiment 𝐸 = 1, the five acceleration signals are measured under random excitations while the five joints are undamaged. The signals measured in this experiment are denoted as 𝑈𝐸=1,𝐽=1 , 𝑈𝐸=1,𝐽=2 , … , 𝑈𝐸=1,𝐽=5 , where 𝐽 is the joint number, 𝐸 is the experiment number, and 𝑈 indicates that the signal was measured while the joint is undamaged. In each experiment 𝑘 + 1 (1 ≤ 𝑘 ≤ 5), the 𝑘 𝑡ℎ joint is damaged by loosening its bolts, and the five acceleration signals are measured under random excitation. The resulting signals are denoted as 𝑈𝐸=𝑘+1,𝐽=1 , … , 𝐷𝐸=𝑘+1,𝐽=𝑘 , … , 𝑈𝐸=𝑘+1,𝐽=5 , where the notation 𝐷 indicates that the signal was measured while the corresponding joint is damaged. After conducting the experiments, the undamaged and damaged signals measured at each joint 𝑖 are grouped together to create the vectors required for training the CNNs: Undamaged𝑖 = [𝑈𝐸=1,𝐽=𝑖
⋯
𝑈𝐸=𝑖,𝐽=𝑖
𝑈𝐸=𝑖+2,𝐽=𝑖
Damaged𝑖 = [𝐷𝐸=𝑖+1,𝐽=𝑖 ]
⋯
𝑈𝐸=6,𝐽=𝑖 ]
(1) (2)
Next, the vectors are divided to a large number of frames having 𝑛𝑠 samples. The resulting frames at each joint 𝑖 can be represented as: UF𝑖 = [UF𝑖,1 DF𝑖 = [DF𝑖,1
UF𝑖,2 DF𝑖,2
⋯ ⋯
UF𝑖,𝑛uf ] DF𝑖,𝑛df ]
(3) (4)
where UF𝑖 and DF𝑖 contain the undamaged and damaged frames corresponding to the joint 𝑖, respectively, and 𝑛uf and 𝑛𝑑f are the number of undamaged and damaged frames, respectively. Given the total number of samples in each acceleration signal 𝑛 𝑇 , 𝑛uf and 𝑛df can be computed as 𝑛𝑇 𝑛uf = 𝑛× (5) 𝑛𝑠 𝑛𝑇 𝑛df = (6) 𝑛𝑠 After that, the frames stored in vectors UF𝑖 and DF𝑖 are normalized between -1 to 1 resulting in the vectors UFF𝑖 and DFF𝑖 . Finally, based on the data in UFF𝑖 and DFF𝑖 , a 1D CNN classifier CNN𝑖 is trained using back-propagation algorithm. Once the five CNNs are trained, they can be easily used to evaluate the condition of the five joints. The following procedure explain how to use each CNN to obtain an index that represents the probability of damage at joint 𝑖 directly from the raw acceleration measurements: 1. 2. 3. 4. 5. 6. 7.
Apply damage at one of the five joints (or keep them undamaged). Apply a random shaker input. Measure the acceleration signal at each joint. Divide each acceleration signal to a number of frames each containing a total of 𝑛𝑠 samples. Normalize the frames between -1 to 1. Feed the normalized frames measured at each joint to the corresponding CNN (CNN𝑖 ). Compute the probability of damage (PoD𝑖 ) at the 𝑖 𝑡ℎ joint as below: PoD𝑖 =
𝐷𝑖 𝑇𝑖
(7)
where 𝑇𝑖 is the total number of frames processed by 𝐶𝑁𝑁𝑖 , and 𝐷𝑖 is the number of frames which are classified as damaged. It is expected that the PoD computed at a damaged joint will be significantly high (close to 1.0), while the PoD obtained at an undamaged joint will be very low (close to 0.0).
4. Experimental Demonstration In this section, the preliminary experimental work carried out to verify the proposed CNN-based algorithm is explained. As mentioned earlier, the objective here is to monitor five joints along a single girder in QU grandstand simulator. Therefore, five PCB model 393B04 accelerometers were attached to the girder at the locations of the five joints using 080A121 magnetic mounting plates. The random excitation was supplied by a TMS 2100E11 modal shaker. DT9857E-16 data acquisition module was used to generate the shaker’s output and collect the acceleration signals. As explained in Section 3, six experiments were conducted to collect the training data. In each experiment, the structure was subjected to 0-512 Hz random excitation and the five acceleration signals were measured at a sampling frequency of 1024 Hz. Each experiment was conducted for 256 s, which means that each acceleration signal contains 𝑛 𝑇 = 262144 samples. The number of samples in each frame 𝑛𝑠 was taken as 128. A Matlab code was written and used to create the vectors UF𝑖 and DF𝑖 required for training the five CNNs as explained in Section 3. Also, the training of 1D CNNs through forward and back propagation was implemented in C++ using MS Visual Studio 2013 in 64-bit. The structure of five CNNs was selected by trial-and-error. Each CNN has two convolution layers and two MLP layers. The number of neurons in the first and second convolution layers was set as 64 and 32, respectively, while the number of neurons in each MLP layer was set to 10. The kernel size 𝐾, and the sub-sampling factor ss for all CNNs are set to 41 and 2, respectively. Once the training is complete, the performance of the five CNNs was tested against six structural cases according to the seven steps presented in Section 3. In Case 1, the five joints are kept undamaged, while the remaining cases involved damaging one of the joints. For each case, the response of the monitored girder under random excitation was collected, divided to frames, normalized, and then fed to the five CNNs to compute the PoD value at each joint. The resulting PoD distributions are presented in Figure 3.
(Case 1: Undamaged)
(Case 2: Damage at Joint 1)
(Case 3: Damage at Joint 2)
(Case 4: Damage at Joint 3)
(Case 5: Damage at Joint 4)
(Case 6: Damage at Joint 5)
Figure 3. PoD distributions computed for the six cases by the proposed algorithm. 6. Discussions The results of the preliminary experimental study demonstrate the efficiency of the proposed CNN-based algorithm. Looking at the PoD distributions presented in Figure 3, it is clear that the PoD values computed at the undamaged joints are significantly higher than those assigned to the damaged joints. This clearly shows that the proposed algorithm was able to identify and localize very slight structural damage directly from the raw acceleration signals. 7. Conclusions This paper presented a fast and accurate algorithm utilizing 1D CNNs for real-time damage detection and localization. A preliminary experimental study was conducted to verify the proposed CNN-based approach on the steel frame of QU grandstand simulator. The experimental results showed that the proposed algorithm is very promising as an alternative to the conventional machine learning based damage detection methods.
8. Acknowledgements The authors are grateful to SOLB26 WLL company of Qatar for providing the steel framing and installing it at the Qatar University Structures Laboratory.
References [1]
O. Avci, O. Abdeljaber, Self-Organizing Maps for Structural Damage Detection: A Novel Unsupervised VibrationBased Algorithm, Journal of Performance of Constructed Facilities. (2015). doi:10.1061/(ASCE)CF.19435509.0000801.
[2]
O. Abdeljaber, O. Avci, N.T. Do, M. Gul, O. Celik, F.N. Catbas, Quantification of Structural Damage with SelfOrganizing Maps BT - Structural Health Monitoring, Damage Detection & Mechatronics, Volume 7: Proceedings of the 34th IMAC, A Conference and Exposition on Structural Dynamics 2016, in: A. Wicks, C. Niezrecki (Eds.), Springer International Publishing, Cham, 2016: pp. 47–57. doi:10.1007/978-3-319-29956-3_5.
[3]
O. Abdeljaber, O. Avci, Nonparametric Structural Damage Detection Algorithm for Ambient Vibration Response: Utilizing Artificial Neural Networks and Self-Organizing Maps, Journal of Architectural Engineering. (2016). doi:10.1061/(ASCE)AE.1943-5568.0000205.
[4]
U. Dackermann, J. Li, B. Samali, Dynamic-Based Damage Identification Using Neural Network Ensembles and Damage Index Method, Advances in Structural Engineering. 13 (2010) 1001–1016. doi:10.1260/1369-4332.13.6.1001.
[5]
E. Figueiredo, G. Park, C.R. Farrar, K. Worden, J. Figueiras, Machine learning algorithms for damage detection under operational and environmental variability, Structural Health Monitoring. 10 (2011) 559–572. doi:10.1177/1475921710388971.
[6]
P. Chun, H. Yamashita, S. Furukawa, Bridge Damage Severity Quantification Using Multipoint Acceleration Measurement and Artificial Neural Networks, Shock and Vibration. 2015 (2015).
[7]
Y.-Y. Liu, Y.-F. Ju, C.-D. Duan, X.-F. Zhao, Structure damage diagnosis using neural network and feature fusion, Engineering Applications of Artificial Intelligence. 24 (2011) 87–92. doi:10.1016/j.engappai.2010.08.011.
[8]
A. Santos, E. Figueiredo, M.F.M. Silva, C.S. Sales, J.C.W.A. Costa, Machine learning algorithms for damage detection: Kernel-based approaches, Journal of Sound and Vibration. 363 (2016) 584–599. doi:10.1016/j.jsv.2015.11.008.
[9]
D. Scherer, A. Müller, S. Behnke, Evaluation of Pooling Operations in Convolutional Architectures for Object Recognition, in: Proceedings of the 20th International Conference on Artificial Neural Networks: Part III, SpringerVerlag, Berlin, Heidelberg, 2010: pp. 92–101. http://dl.acm.org/citation.cfm?id=1886436.1886447.
[10]
S. Kiranyaz, T. Ince, M. Gabbouj, Real-Time Patient-Specific ECG Classification by 1-D Convolutional Neural Networks, IEEE Transactions on Biomedical Engineering. 63 (2016) 664–675. doi:10.1109/TBME.2015.2468589.
[11]
T. Ince, S. Kiranyaz, L. Eren, M. Askar, M. Gabbouj, Real-Time Motor Fault Detection by 1-D Convolutional Neural Networks, IEEE Transactions on Industrial Electronics. 63 (2016) 7067–7075. doi:10.1109/TIE.2016.2582729.
[12]
O. Abdeljaber, A. Younis, O. Avci, N. Catbas, M. Gul, O. Celik, H. Zhang, Dynamic Testing of a Laboratory Stadium Structure, in: Geotechnical and Structural Engineering Congress 2016, n.d.: pp. 1719–1728. doi:10.1061/9780784479742.147.