of the Online Watershed Learning System (OWLS), a guided, open-ended ... Current position: Professor and Head of Computer Science and Engineering, ...
Paper ID #18670
Implementation of a First-Year Engineering Course and Active Learning Strategies at a University in India Dr. Walter McDonald, Virginia Tech Walter McDonald is an assistant professor at Marquette University in the Civil, Construction & Environmental Engineering department. He received a B.S. in civil engineering from Texas Tech University, a M.S. in civil engineering from Texas A&M University, and a Ph.D. in civil engineering from Virginia Tech. He has extensive experience in urban stormwater management, hydrology, and engineering education research. He has developed and implemented watershed-based active-learning activities into community college, undergraduate, and graduate level courses within both domestic and international contexts. Mr. Daniel S. Brogan, Virginia Tech Daniel S. Brogan a postdoctoral associate working on engaged learning at the Institute for Critical Technology and Applied Science at Virginia Tech. From 2011 to 2017 he was a doctoral student in engineering education at Virginia Tech, where his research involved the development and classroom implementation of the Online Watershed Learning System (OWLS), a guided, open-ended cyberlearning environment that is driven by HTML5, JavaScript and CSS (http://www.lewas.centers.vt.edu/dataviewer/) and serves as a user interface to the Learning Enhanced Watershed Assessment System (LEWAS) Lab. In 2011 he founded Bhutanese-Nepali Christian Media Ministries, which utilizes online media to address needs in Christian ministries for people in these language groups. Prior to June 2010, he was a graduate student at the University of New Hampshire, where he earned his BS and MS degrees in electrical engineering. Dr. Vinod K Lohani, Virginia Tech Dr. Vinod K. Lohani is a Professor of Engineering Education and also serves as the faculty director of education and global initiatives at an interdisciplinary research institute called the Institute for Critical Technology and Applied Science (ICTAS) at Virginia Tech. He is founding director of an interdisciplinary lab called Learning Enhanced Watershed Assessment System (LEWAS) at VT. He received a Ph.D. in civil engineering from VT. His research interests are in the areas of computer-supported research and learning systems, hydrology, engineering education, and international collaboration. He has led several interdisciplinary research and curriculum reform projects, funded by the National Science Foundation, and has participated in research and curriculum development projects with $6.4 million funding from external sources. He has been directing/co-directing an NSF/Research Experiences for Undergraduates (REU) Site on interdisciplinary water sciences and engineering at VT since 2007. This site has 85 alumni to date. He also leads an NSF/Research Experiences for Teachers (RET) site on interdisciplinary water research. He has published over 85 papers in peer-reviewed journals and conferences. Dr. Gopalkrishna Joshi, KLE Technological University I hold a PhD in Computer Science and Engineering. Areas of research: 1. Data Engineering 2. Engineering Education Research Current position: Professor and Head of Computer Science and Engineering, Director of Centre for Engineering Education Research
c
American Society for Engineering Education, 2017
Implementation of a First-Year Engineering Course and Active Learning Strategies at a University in India Abstract: This paper presents the results of collaborative efforts between the faculty of Virginia Tech and KLE Technological University Hubli, India to develop and integrate a first-year engineering program at KLE Technological University. It is well known that the first two years in an engineering program are crucial to student retention and success. As such, a first-year course was developed to provide students with active and collaborative hands-on learning experiences in order to improve student engagement and learning during their first-year. Classroom modules included hands-on problem solving activities that covered methods and topics, such as mechatronics and watershed monitoring. The first-year course was piloted in the Fall 2015 semester and Spring 2016 semester and is ongoing in the Fall 2016 semester, each with an enrollment of approximately 500 engineering students. Student learning and motivation were assessed using a mixed-methods post-test survey that included quantitative and qualitative questions. Results from the pilot course implementation reveal that 95% of the students felt that hands-on activities improved their ability to learn in the class and that what they were learning in the course was useful for their short- and long-term goals.
1. Introduction Engineering education programs in higher education around the world share many of the same opportunities and challenges, including student retention. A lack of retention within engineering is often due to poor instruction, a lack of competence of students as they reach sophomore classes, a lack of a sense of belonging among students, or a lack of interest in engineering courses.1,2 In response to these issues, many engineering programs are reforming early engineering curricula within the first two years to improve student retention and success. The goal of this reform is to develop first-year courses that provide active-learning problem solving experiences that adequately prepare students for their subsequent courses in the engineering curriculum.
1
Key to the development of engaging, effective and innovative first-year course experiences is the integration of active learning theories. Active learning is a theory that suggests that students learn more by doing meaningful activities as opposed to being passive participants in a lecture setting3. Active learning activities, such as hands-on projects, have been shown to be more effective than traditional lecture based classes4. A related theory is collaborative learning, which proposes that students learn better together, when they are working together to achieve a common goal5. These contemporary learning theories can be applied in a first-year engineering course setting to improve student learning and motivation, which will ultimately better prepares students for their second, third, and fourth year engineering courses. In addition, technological advances have enabled the development of virtual and remote labs that integrate engineering data into the classroom through interactive online laboratory environments (Glasgow et al., 2004, Orduna et al., 2011). These labs can provide interactive experiences for students through multimedia including graphs, images, and geospatial visualizations. An example is the Online Watershed Learning System (OWLS), which is an environmental exploration tool that grants users access to historical and live watershed monitoring data and educational case studies7,8,9. It acts as the front end for the Learning Enhanced Watershed Assessment System (LEWAS), which is a real-time continuous watershed monitoring station that collects stormflow, water quality (pH, dissolved oxygen, oxidation reduction potential, turbidity, temperature, and specific conductance), and weather (precipitation, air temperature, and relative humidity) data and broadcasts the data live through the OWLS. This paper presents the efforts of KLE Technological University to develop a college-wide firstyear engineering course as part of a collaboration with Virginia Tech. The development of the course began with a workshop that was held at KLE Technological University where educators and researchers from Virginia Tech shared experiences from multiple years of first-year engineering courses. In addition, during the workshop, Virginia Tech researchers worked with faculty at KLE Technological University to develop active and collaborative learning activities for the first year course, including OWLS learning 2
modules, and develop a counterpart real-time watershed monitoring lab at KLE Technological University to support the first-year program6. Since that workshop, the course has been implemented in the Fall 2015, Spring 2016 and Fall 2016 semesters. This paper describes the active learning activities that were implemented within the course including those that used the OWLS, presents results from an end of the semester survey given to approximately 500 engineering students in the Fall 2015 semester, and describes the ongoing collaborative efforts to improve first year experiences.
2. Methodology 2.1 First-year course activities Based upon results from the faculty workshop6, active learning activities were developed for the first-year course at KLE Technological University (Table 1). At the workshop, Virginia Tech researchers shared experiences in integrating active learning activities into first-year courses at Virginia Tech, which included activities such as straw towers, balloon drops, a sustainable energy design project, mechatronics, ethics, and watershed monitoring. During the workshop, faculty at KLE Technological University adapted the activities to fit their local-context and educational needs. The overarching goal of these activities was to engage the students in active learning that would improve student learning and motivation of first-year engineering students. The following paragraphs explain the outcomes and activities related to the topics outlined in Table 1.
3
Table 1. Topic and activities for first-year course Unit. No
Topic
Active learning activities
2 3
Introduction to Engineering and Engineering Study Role of Analysis in Engineering Analysis Methodology
4
Data Analysis Graphing
5
Basics of Engineering Design
6
Multidisciplinary Nature of Engineering Design
7
Project Management
8
Sustainability in Engineering
9
Ethics Modelling, Simulation, Data Acquisition & Analysis using Software Tool Course Project focusing on Final project Sustainability in Engineering
1
10 11
Sketch engineer at work; engineering job review; evolution of a product Carry bag design Pair wise comparison chart Data collection; graphic; data visualization; linear interpolation; OWLS Straw tower and book holder; balloon drop Mechatronics Picture pieces; checklists; timelines; Gantt chart Sustainable development; sustainable engineering design; life cycle assessment Milk adulteration test LabVIEW
Introduction to Engineering and Engineering Study. The main outcomes from this section were to (1) explain the importance of engineering profession in the world, (2) list the roles of an engineer in the engineering workplace, (3) describe common engineering disciplines and their specializations, and (4) differentiate between learning at school and learning in college. Active learning activities required students to draw a sketch of engineer at work, discuss the role of science and engineering in creating a product, list five jobs typically associated with disciplines of engineering offered at the university, list five engineering innovations that have changed human life, and discuss grand engineering challenges. Role of Analysis in Engineering. Outcomes from this section were to (1) define engineering analysis, (2) explain importance of analysis in engineering, (3) explain how to use analysis in design, and (4) explain how analysis helps engineers prevent and diagnose failure. The active learning activity in this
4
section required students to design a carry bag to accommodate a 200 page notebook with the constraints of 8 staple pins and 1 sheet of newspaper. Analysis Methodology. Outcomes from this section were to (1) describe general analysis procedure, (2) perform analysis systematically, (3) present the analysis results using proper method, and (4) use computing resources for analysis. The active learning activity in this section had students develop a Pairwise Comparison Chart (PCC) for a given product and its set of design considerations. Data Analysis Graphing. Outcomes from this section were to (1) explain the significance of graphs, (2) collect and record the experimental data, (3) construct appropriate graphs, (4) interpret and analyze the visual information represented by graphs, (5) establish the relationship between physical quantities, and (6) explain the process of linear interpolation. Students were required to analyze a census dataset and produce appropriate graphs. Basics of Engineering Design. Outcomes from this section were to (1) explain the engineering design process, (2) differentiate between good design and bad design, (3) summarize the need statement, and (4) generate possible design alternatives/ solutions. Active learning activities included the construction of straw towers and straw bookholders using finite materials, as well as developing a landing pad for a water balloon using sticks and a cloth. Multidisciplinary Nature of Engineering Design. Outcomes from this section were to (1) explain multi-disciplinary facet of design, (2) draw functional (sub) systems, and (3) construct proposed simple mechanical/ mechatronic systems. The students were required to build a DC regulated power supply circuit, convert 230 volt AC to 5 volt DC, use the regulated DC power supply circuit developed to drive two DC motors, and disassemble and assemble a gearbox. Project Management. Outcomes from this section were to (1) summarize the importance of team work in project management. (2) plan a project using relevant project management tools like checklists, timelines and Gantt charts, and (3) document deliverables of project. Student activities included an artistic 5
teamwork exercise, development of a checklist, development of a timeline, and construction of a Gantt chart. Sustainability in Engineering. Outcomes from this section were to (1) explain that sustainable development is one of the most fundamental challenges confronting humanity, (2) explain the three main aspects of sustainable development – Society, Economy, Environment, (3) explain that role of engineers is vital in sustainable Engineering Design, and (4) calculate carbon foot print and energy consumption of people’s day to day interventions. The active learning activity in this section required students to perform a life cycle assessment of paper, plastic bottles, shoes, and a wooden chair. Ethics. Outcomes from this section were to (1) define the terms: etiquette, law, morals and ethics, (2) explain the need for ethics in the engineering profession, (3) explain moral theories, and (4) analyze a situation for ethical dilemmas and make related decisions. This section required students to conduct milk adulteration tests using provided kits for the presents of urea, sugar, preservatives, detergent, and starch. The milk adulation test kits provided a local-context to ethical issues as they were provided by Biosyl Technologies Pvt. Ltd, which uses incubation space on the KLE Technological University campus. Modelling, Simulation, Data Acquisition & Analysis using Software Tool. Students were introduced to the basics of data acquisition, data analysis, model building, and model simulation using LabVIEW software. This section required students to use LabVIEW to define and solve an engineering problem. Final Project. Students were required to develop a product by following the design process of (1) announcement of 15 need statements covering broad themes of home automation, smart agriculture, and smart city, (2) carving out problem statements from need statements, (3) development of design considerations and prioritization, (4) gathering pertinent information, (5) project management (Gantt chart), (6) generation of feasible alternative solutions, and (7) detailed design. Students then presented
6
their results during an exhibition, which provided an opportunity for freshman students to learn from their peers. 2.2 Online Watershed Learning System The OWLS was introduced into the course as an example application in order to solicit student feedback on the learning value of different components. Within the Data Analysis and Graphing unit (Table 1) the students were required to think of designing a real time weather and stream monitoring system and to determine what kind of data they would collect, what the dependency is between the data they collect, and the frequency of the data collection. They then visited the OWLS to see how their solution compared to an actual real-time water and weather monitoring system. In addition, students were shown the OWLS as a case study example of sustainability during their Sustainability in Engineering unit. There is a clear difference in integrating the OWLS into the KLE Technological University and the Virginia Tech first-year courses due to location. Students at Virginia Tech have a local connection to the watershed as they live and take classes within the watershed. Therefore, they can notice how flow and water quality parameters change in real time as it rains where they are located. For students at KLE Technological University, they can only situate themselves remotely through the interactive multimedia on the OWLS. Therefore, it could be hypothesized that students at KLE Technological University may not learn as effectively through the OWLS as would students who have a local connection to the site. 2.3 Assessment A mixed methods survey was provided to students at the end of the Fall 2015 semester to determine how the active learning activities impacted student learning and motivation, and to determine the learning value of the OWLS components. Mixed methods was chosen as it offered an opportunity to obtain both qualitative and quantitative data to assess the research objectives. The survey included quantitative Likert-scale questions, as well as qualitative open ended questions. The questions on student motivation were open-ended and adapted from the MUSIC Model of Academic Motivation10. The survey was administered through an online form and with a total of 431 student respondents. Table 2 contains the 7
survey questions, with learning related questions highlighted in green, motivation questions highlighted in orange, and OWLS questions highlighted in blue. Table 2. Survey questions administered to students. Question 1 2 3 4 5 6 7
Did the hands-on activities affect your ability to learn in the course? Which activity do you believe helped you learn course concepts the most? Explain. Which activity do you believe helped you learn course concepts the least? Explain. What choices did you have during the course? What did you find useful about this course? What made you feel successful in this course? What could be changed in this course to help you feel you could be more successful in it? 8 What did you find interesting about this course? 9 Which parts of this course were boring? 10 What could be changed in this course to make you feel that the instructor cares about whether you learn the course content and do well in the course? 11. What was the learning value of the following components of the LEWAS (Not valuable = 1; Somewhat valuable = 2; Valuable = 3; Extremely valuable = 4) Interactive graphs Overhead view/map Live camera Weather radar Case Studies Background Information How-to-use guide Real-time Data Anywhere / Anytime Access Other Value Other Words
Qualitative data from the survey was evaluated for codes and themes in the student responses. This was done using NVivo software to familiarize the researcher to the data through reading and rereading of the data, generalizing initial codes, and gathering codes together to identify potential themes 11. Once themes were developed, some of the results were quantized by enumerating the frequency of themes within the survey responses. 2.4 Spring and Fall 2016 Activities The course was offered again in the Spring and Fall 2016 semesters and included an expanded use of the OWLS in the course. Students in this course used the OWLS to download data, plot appropriate 8
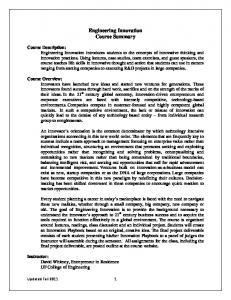
graphs, and interpret the relationship between parameters using the OWLS data viewer. Students used the OWLS to answer the following questions: 1. During the past month, a change (increase/decrease) in the pH level of water has been noticed. Can you identify the factors responsible for this change? 2. What factors cause a change in specific conductance? 3. What cause a change in Dissolved Oxygen(DO)? Is there a relationship between DO and aquatic life? 4. Can you spot another relationship of interest? Students were required to discuss their findings and support their answers by referring to theoretical concepts supported by data visualization of the OWLS. In these semesters the LEWAS was also integrated into the sustainability module as an example demonstrating the three main pillars of sustainability (Figure 1). A total of 550 students in the Spring 2016 semester and a total of 476 students in the Fall 2016 semester accessed the OWLS to complete their assignments; however, due to resource constraints a formal assessment of the students was not undertaken.
Figure 1. Students using the OWLS in the Spring 2016 semester 2.5 Engineering Education Support and Feedback An outcome of the workshop and ongoing collaboration is the strengthening of collaborative relationships between KLE Technological University and Virginia Tech. This collaborative relationship is exercised through the sharing of experiences, resources, assessment data, and results to improve the 9
quality of first-year courses. An example of this relationship is illustrated in Figure 2. As illustrated, the loop begins at the top with planning the modules and course assessment, followed by the implementation of the course and assessment procedures. Then the data is analyzed and interpreted before it is applied to either the Virginia Tech or KLE Technological University contexts. The feedback mechanism serves to improve instructional quality at both universities through shared data and experiences, and strengthens the overall engineering education research efforts at both universities.
Virginia Tech
KLE Tech
Figure 2. Feedback loop between Virginia Tech and KLE Technological University (adapted from McDonald et al., 2016)
3. Results 3.1 Student learning The learning questions were focused on evaluating the student-perceived learning of the course participants, and overall the students indicated that the hands-on active learning activities positively influenced their learning. For example, when asked “Did the hands-on activities affect your ability to learn in the course?”, 95% of students indicated that the hands-on activities affected their ability to learn in a positive way. The objective of the remaining two learning questions were to elicit feedback on which activities helped them learn course concepts the most and which activities helped them learn course concepts the
10
least (Figure 2). The greatest number of students indicated that LabVIEW helped them the most, followed by Mechatronics, the Straw Tower/Book Holder, and the Balloon Drop activity. Interestingly, the greatest number of students that listed a specific activity indicated that the LabVIEW helped them learn course concepts the least, followed by the Straw Tower/Book Holder, and Ethics. 140
120
COUNT
100
80
60
40
20
0
Which activity do you believe helped you learn course concepts the most? Explain. Which activity do you believe helped you learn course concepts the least? Explain.
Figure 3. Student responses to learning questions 2 and 3 There were a number of reasons why students might believe that an activity helped them learn course concepts the least. Those students that listed LabVIEW indicated that they did not understand it and that perhaps there was not enough time devoted to it. For instance one student stated “I felt that we did not learn to perfection as there was least time to practice” and another wrote “LabVIEW because I could not understand it perfectly”. Additionally, those that indicated Data Analysis felt like it was a 11
difficult and boring topic. For example one student stated “I felt that it was somewhat complicated and the topic itself was a burden”, with another stating “It is a boring topic”. Those students who listed Balloon Drop and Straw Tower / Book Holder felt that the activities were not practical and were too easy. For example, one student stated “It didn’t seem that we actually need to be an Engineer to solve this problem. Any person with brains could do it!” Finally, many of those categorized as Other listed “theory concepts” demonstrating that some students did not find theory valuable. Students who indicated that LabVIEW helped them the most, stated that they believed it was a tool that they could use throughout their academic and engineering careers. For example, one student stated that “LabVIEW because it will help us in the future” and anther stated that “LABVIEW was the important concept working with a software that helped us to convert mathematical problems into easily understandable language”. Interestingly, of 20 students who felt that mechatronics help them learn course concepts the least (Figure 2), 13 of them felt that LabVIEW helped them learn course concepts the most (Figure 3). In addition, of the students who felt LabVIEW helped them learn course concepts the least, 30% felt that Mechatronics helped them learn course concepts the most (Figure 4). This indicates that there may be groups of students who fall into two general categories (1) those that value software skills but not hands on design, and (2) those that value hands-on design but not software skills.
12
40 35 30 25 20 15 10 5 0
Figure 4. Question 3 results of students who indicated that LabVIEW helped them learn course concepts the most 20 18 16 14 12 10 8 6 4 2 0
Figure 5. Question 2 results of students who indicated that LabVIEW helped them learn course concepts the least 3.2 Student Motivation The remaining open-ended questions sought to determine how student motivation is impacted by the course. The results from this portion of the survey highlight how the five aspects of the MUSIC Model of Academic Motivation – eMpowerment, Usefulness, Success, Interest, and Caring – are influenced by active learning activities. 13
eMpowerment: What choices did you have during the course? Students indicated that they had choices in choosing what method or strategy to use to complete an activity, the choice to develop their own ideas for the final project, choosing their team members and how to work as a team, developing a presentation, and the freedom to seek help from their instructors (Figure 5). While a majority of the students indicated that they had the ability to make decisions about their learning, a number of students also indicated that they had no choices. These students believed that because they were following instructions from their professors, that all of the choices were made for them. For example, one student stated that “No choices were available. Everything was mandatory.” 90 80 70
COUNT
60 50 40 30 20 10 0
No choices
Method to Develop Choose and Give Freedom to solve an project ideas work as a presentation ask for help activity team
Figure 6. Student responses to the question “What choices did you have during the course?” Usefulness. What did you find useful about this course? The greatest number of students indicated that the development of professional engineering skills was what they found useful about the course (Figure 6). For example, one student stated that the course helped them “to think like and engineer and work under pressure”, while another student stated “it taught me how to think… it made me an engineer from a normal student.” Others indicated the learning of engineering fundamentals were useful, followed by everything, activities, and teamwork.
14
180 160 140
COUNT
120 100 80 60 40 20 0
Figure 7. Student responses to the question “What did you find useful about this course?”
Success. What made you feel successful in this course? A large number of students felt that activities made them feel successful in the course, followed by the final project and teamwork (Figure 7). This highlights the value of active learning (activities, hands-on project) and collaborative learning (teamwork) in fostering a belief that they can succeed as an engineer.
15
160 140 120
COUNT
100 80 60 40 20 0
Figure 8. Student responses to the question "What made you feel successful in this course?"
Interest. What did you find interesting about this course? A large number of students indicated that they found the activities to be interesting (Figure 8). For example, one student stated “For me, most interesting thing about this course were the activities. As I have mentioned earlier they've helped me improve my mind and extended its thinking capacity.” Of the students who said that the activities were interesting, 40 specifically indicated LabVIEW as something they found interesting about the course, followed by learning new concepts and the final project.
16
COUNT
200 180 160 140 120 100 80 60 40 20 0
Figure 9. Student responses to the question "What did you find interesting about this course?"
Interest. Which parts of this course were boring? Three major themes emerged, with the greatest number of students indicating ethics was a boring portion of the course, followed by LabVIEW and theory (Figure 9). Students who indicated ethics felt that it was not an interesting topic with one student stating that “ethics was boring because it just involved going through the slides.” Others did not like LabVIEW, with some indicating that they thought it was boring because they did not understand it. For example one student stated “Lab view because we couldn't understand it perfectly.” This corroborates the findings from the responses to learning questions, where some students felt that LabVIEW helped them learn course concepts the least, with many of them indicating they could not follow along. Other students were bored with the theory behind engineering concepts that was introduced before hands-on active learning activities. Finally, some of those who listed Other indicated that the timing of the class (3 hours) was long and made it difficult to sit through the entire class, with one student stating that “sitting in one place for 3 hrs is boring”.
17
COUNT
100 90 80 70 60 50 40 30 20 10 0
Figure 10. Student responses to the question "Which parts of this course were boring?”
Caring. What could be changed in this course to help you feel you could be more successful in it? A large number of students (171) indicated that nothing could be changed in the course; however, many students indicated that the timing of the course could be improved (59). The course was 3 hours long and some students indicated that they would like a break in between, while others felt that they needed more time to complete the final project. Other students indicated that they wanted more activities in the classroom (46) with one student stating that the course should “introduce more activities like the balloon and straw experiment”. Caring. What could be changed in this course to make you feel that the instructor cares about whether you learn the course content and do well in the course? Overall the themes in student responses to this question mirrored the previous Caring question. While a large number of students indicated that nothing could be changed (159), others voiced concerns about the timing of the course (72), and a desire to increase the number of activities (25). For example, some student felt that the class was too long with one student stating “timing must be changed because due to the heavy schedule and the last hour classes students cannot concentrate on the topic”. Just as with the previous question, students indicated that 18
overall those in their learning environment cared about their learning, however this could be improved by changing the timing of the course (reducing it from a 3 hour course) and increasing the number of activities. Overall, the results highlight the value of active learning modules in affecting the motivational aspects of empowerment, usefulness, success, interest, and caring. In all five aspects, group activities were mentioned as a positive influence on their motivation, with the strongest majority in success and interest. These results complement the learning questions by displaying how active and collaborative learning influences not only student perceived learning, but also many aspects of student motivation. 3.3 OWLS The students were also asked to rank the features of OWLS based upon their OWLS activity. The users ranked the real-time data the highest, followed by the case studies, how-to-use guide, and interactive graph. This data was used to further refine the OWLS system as part of a dissertation developing and evaluating the OWLS across a wide range of educational contexts12. Interestingly, undergraduate freshmen and seniors and graduate students from engineering courses at Virginia Tech and Virginia Western Community College consistently agreed with students from KLE Technological University that real-time data was the most important component but consistently rated case studies in the second half of component rankings. For all of these US-based student groups, anywhere / anytime access was the second most important feature12, which was ranked 6 of 9 components by students at KLE Technological University. Possible factors influencing these differences are the availability of anywhere / anytime internet access on mobile devices and instructor bias caused by instructors in different courses emphasizing different OWLS components. Further research is needed to isolate which factors are influencing these differences.
19
Table 3. OWLS survey results OWLS Component Interactive graphs Overhead view/map Live camera Weather radar Case Studies Background Information How-to-use guide Real-time Data Anywhere / Anytime Access
Value 3.12 2.96 2.93 2.89 3.22 3.10 3.17 3.24 3.07
Rank 4 7 8 9 2 5 3 1 6
4. Conclusions This study has demonstrated how active and collaborative learning modules were integrated into the initial offering of a first-year engineering course at KLE Technological University. Results have highlighted the value of active learning in positively affecting student-perceived learning and many aspects of student motivation. Results from this analysis have been used to refine current and future course offerings. Future research will continue to evaluate how student learning can be improved in a first-year course through active learning activities and virtual labs such as the OWLS, as well as how activities and topics introduced within the first-year curriculum can be integrated into second, third, and fourth year courses through a spiral curriculum approach. Additionally, the authors have found that when developing a course with colleagues working in different cultural settings, it is important to keep in mind that standard academic concepts, which one takes for granted and hardly thinks about because they are the only way of thinking about them that one has experienced during several years of post-secondary academic experience, may be very different in other cultural settings. These include such fundamental concepts as what one means by academic nomenclature (e.g., college, school or faculty) or what levels of access students will have to computing and internet resources for completing online learning modules. In order to overcome such cultural differences, it is essential to maintain open dialog between collaborators from both cultures, and in the experience of the authors, the model which was used here, i.e., faculty from the remote culture mentor 20
faculty from the local culture, who adapt the learning resources to fit the culture they are familiar with, allows the cross-cultural team to overcome the challenges of developing learning materials across cultures.
References 1. Marra RM, Rodgers KA, Shen D, and Bogue B, 2012. Leaving Engineering: A Multi‐Year Single Institution Study. Journal of Engineering Education, 101(1):6-27. 2. Matthews M, 2012. Keeping students in engineering: A research-to-practice brief. American Society for Engineering Education, Editorial, www.assee.org. 3. Faust JL and Paulson DR, 1998. Active Learning in the College Classroom. Journal on Excellence in College Teaching, 9(2):3-24. 4. Prince M, 2004. Does Active Learning Work ? A Review of the Research. Journal of Engineering Education, 93(3): 223-231. 5. Dillenbourg P, 1999. What do you mean by ‘collaborative learning’? Collaborative-learning: Cognitive and computational approaches, 1: 1-15. 6. McDonald, W. M., D. S. Brogan, V. K. Lohani, G. H. Joshi and A. S. Shettar. Developing a First-Year Engineering Course at a University in India: International Engineering Education Collaboration. 123rd ASEE Annual Conference & Exposition, New Orleans, LA, USA, June 26-29, 2016. 7. Brogan, D.S., McDonald, W.M., Lohani, V.K., and Dymond, R.L., 2016. A High-Frequency RealTime System for Creating and Sharing Environmental Data. Advances in Engineering Education (AEE), 5 (2). 8. McDonald WM, Brogan DS, Lohani VK, Dymond RL, and Clark RL, 2015. Integrating a Real-Time Environmental Monitoring Lab into University and Community College Courses. International Journal of Engineering Education, 31(4):1139-1157.
21
9. McDonald, W.M., Brogan, D.S., Lohani, V.K., and Dymond, R.L., 2015. Assessing Cognitive Development and Motivation with the Online Watershed Learning System (OWLS), ASEE 122nd Annual Conference & Exposition, June 14 – 17, 2015, Seattle, WA. 10. Jones, B. D. (2009). Motivating students to engage in learning: The MUSIC model of academic motivation. International Journal of Teaching and Learning in Higher Education, 21(2), 272-285. 11. Robson, C. (2002). Real world research. Oxford: Blackwell. 12. Brogan, D.S. (2017). “Development and Evaluation of the Online Watershed Learning System (OWLS)”. Dissertation, Virginia Tech, Blacksburg, VA.
22