VOL. 6, NO. 12, DECEMBER 2011
ISSN 1819-6608
ARPN Journal of Engineering and Applied Sciences ©2006-2011 Asian Research Publishing Network (ARPN). All rights reserved.
www.arpnjournals.com
IMPLEMENTATION OF COMBINED TRAFFIC ASSIGNMENT AND CONTROL FRAMEWORK BASED REGIONAL MODEL FOR THE WASATCH FRONT REGION Muhammad Farhan1 and Peter T. Martin2 1
Senior Transportation Engineer, Wasatch Front Regional Council, Salt Lake City, USA Department of Civil and Environmental Engineering, The University of Utah, Salt Lake City, USA E-Mail:
[email protected]
1
ABSTRACT The regional travel demand models are generally macroscopic in nature and do not include traffic controls in the traffic assignment process. In travel demand models, the road capacities are kept fixed within the functional classification of roadways and free-flow-speeds are adjusted to accommodate the impacts of traffic controls and traffic operations. Part of the reason this approach is adopted in travel demand models is there macroscopic application, where the focus is extensively on the region wide results for transportation planning. While there are advantages in using this approach, the cost is usually paid in “lost capacity on projects” due to the absence of traffic operations in modeling; more precisely the absence of traffic controls tend to present partially skewed output from the travel models. Combined Traffic Assignment and Control models can address this issue by including the impacts of traffic controls in the modeling process. This paper evaluates the benefits of combined traffic assignment and control modeling framework implemented on a regional scale compared to a traditional four step regional travel demand model. The study quantifies the benefits in terms of providing network travel time information to drivers to make route choice in comparison to improving the traffic controls on a large regional network (on a mesoscopic level). Several experiments were performed on a study area using Static Traffic Assignment (STA) and Dynamic Traffic Assignment (DTA) with fixed and vehicle-actuated controls. The study area network is a regional transportation network for the Wasatch Front Region in Utah. The results suggest that if implemented on regional travel models, the CTAC framework can help reduce the VMT and reduce regional delays by over 6%. Further studies are needed to expand on this idea with multimodal modeling and testing on other regional networks. Keywords: traffic assignment, traffic controls, mesoscopic, travel demand models.
BACKGROUND To study the benefits of the combined traffic assignment and control framework, the researchers have been investigating the Combined Traffic Assignment and Control (CTAC) (1) modeling framework for many years now. The framework allows a user to simulate a traffic system under the combined effect of traffic control and driver’s route choice. CTAC has been the focus of research for solution algorithms and theoretical modeling formulations for the last three decades. One of the hurdles for implementation of the concept until the mid-1990s was lack of computer technology to perform complex calculations. Advance computers, and software like VISSIM (2), Dynasmart (3) and CUBE-DYNASIM (4) can now simulate complex real-life networks. Due to the availability of advanced computer technology, implementation of CTAC has been the topic of extensive research in academia. However from the perspective of practice, very little research has been done to implement the CTAC modeling framework on large regional scale, especially to identify the benefits of providing network travel time information to drivers with the possibility of improvements in traffic control on mesoscopic level for a region. This paper evaluates the benefits of combined traffic assignment and control modeling framework implemented on a regional scale compared to a traditional four step regional travel demand model. The study quantifies the benefits in terms of providing network travel
time information to drivers to make route choice in comparison to improving the traffic controls on a large regional network (on a mesoscopic level). Several experiments were performed on a study area using Static Traffic Assignment (STA) and Dynamic Traffic Assignment (DTA) with fixed and vehicle-actuated controls. The study area network is a regional transportation network for the Wasatch Front Region in Utah. REVIEW OF LITERATURE Allsop conducted one of the first studies on CTAC problem in the 1970s. Allsop (5) suggested that the traffic controls impact route choice. Maher and Akcelik (6), Gartner (7), and Allsop and Charles worth (8) investigated CTAC on a conceptual level by studying the use of signal control to influence route choice. Smith (9, 10) investigated the problem for the existence of equilibrium. Smith formulated conditions that guarantee the existence of equilibrium theoretically. Smith (11, 12) introduced a control policy Po that ensures the existences of traffic equilibrium. These theoretical approaches by Smith paved the way for one of the initial CTAC implementation efforts by Smith and Van Vuren (13). Meneguzzer (1) and Taale and Zuylen (14) presented an overview of 25 years of research on combined traffic assignment and control. Granato (15) suggested that the transportation planning agency in Iowa is using CTAC model for use limited to long range planning only.
11
VOL. 6, NO. 12, DECEMBER 2011
ISSN 1819-6608
ARPN Journal of Engineering and Applied Sciences ©2006-2011 Asian Research Publishing Network (ARPN). All rights reserved.
www.arpnjournals.com Early efforts on implementation of CTAC models began with a combined focus on solution algorithms and their implementation. Gartner and Al-Malik (16) derived an iterative approach for combined traffic and control problem using a link performance function. Gartner and Stamatiadis (17) presented a theoretical framework for implementation of a joint control and dynamic traffic assignment. Meneguzzer (18, 19) solved a combined route choice control problem using a diagonal algorithm. Taale and van Zuylen (20) investigated CTAC with STA on fixed-time, fixed-time-optimized, vehicle-actuated and vehicle-actuated-optimized control types. The study left other research options open especially using adaptive controls and DTA on latest simulation tools that are available now. Mahmassani and Ta-YIN HU (21) presented a DTA simulation procedure to investigate dayto-day network flows in combination with offline and online traffic controls. The research concluded that real time information and signal control strategies could reduce average delay system wide. Abdelfatah and Mahmassani (22) presented a joint control and assignment problem to optimize the network performance with dynamic route
guidance. The research concluded that joint routing and control optimization can lead to improved network performance. To summarize, conventional traffic assignment and control optimization methods tend to ignore controldriver interaction. The CTAC method can capture controldriver interaction in a single framework. The investigations on solution algorithms, model formulations, and implementation of the method are well documented. However there is no study to date that captures the benefits of provision of network travel time information to drivers to make route choice in comparison to the possibility of improving the traffic controls on a CTAC framework. METHODOLOGY Test scenarios Three scenarios were tested using Cube Voyager, and Avenue based mesoscopic simulation. A brief description of the test scenarios is given below. Table-1 displays the test scenarios.
Table-1. Test scenarios. Macroscopic
Mesoscopic
Scenario Matrix
Scenario 1
Scenario 2
Scenario 3
Assignment Type
Static Assignment
Dynamic Assignment
Dynamic Assignment
Traffic Controls
No Traffic Controls
Fixed Controls
Vehicle Actuated Controls
Static assignment scenarios Scenario 1 - Due to macroscopic nature of the model, the traffic controls are ignored. Since it is a STA based scenario, the drivers will not have information on network travel times based on past travel experience to make better route choice. Dynamic assignment scenarios Scenario 2 - Signal timings are fixed and controls do not respond to changes in traffic flow. Since it is DTA based scenario, the drivers have network travel time information based on past travel experience and they are able to make better route choice. Scenario 3 - Signal timings may respond to changes in traffic flow due to vehicle actuated type traffic controls. Since it is DTA based scenario, the drivers have network travel time information based on past travel experience and they are able to make better route choice. Figure-1 displays the sequence of Scenario application process including the intermediate steps where origin destination data, and network data is exported to Avenue software.
SCENARIO 1 STA WITH FIXED CONTROLS
Origin Destination Data and Networks Exported To Cube Avenue
SCENARIO 2 DTA WITH FIXED CONTROLS
Traffic Controls Improved To Vehicle Actuated Controls
SCENARIO 3 DTA WITH VEHICLE ACTUATED CONTROLS
Figure-1. Sequence of scenario testing
12
VOL. 6, NO. 12, DECEMBER 2011
ISSN 1819-6608
ARPN Journal of Engineering and Applied Sciences ©2006-2011 Asian Research Publishing Network (ARPN). All rights reserved.
www.arpnjournals.com where
OVERVIEW OF TRAFFIC ANALYSIS TOOLS Modeling and simulation software A travel demand modeling software Cube version 5.1 with extensions Voyager- a travel demand simulator, and Avenue - a mesoscopic traffic simulator were used to model the test scenarios. Cube uses a modular and scriptbased structure allowing the incorporation of any model methodology ranging from standard four-step models, activity-based models, and mesoscopic models. Cube Voyager includes highly flexible network and matrix calculators for the calculation of travel demand and for the detailed comparison of scenarios. Cube Avenue has been proven as a reliable mesoscopic simulation tool that produces virtual traffic flows similar to real traffic flows (23-26). Cube Avenue, an extension to Cube software, offers transportation professionals an innovative tool for analyzing traffic. Cube Avenue is a mesoscopic modeling software. It models traffic at greater levels of detail than macroscopic models, like Cube Voyager’s Highway program, and at lesser levels of detail than microscopic models, like Cube DynaSim. With Cube Avenue, analysts can study problems for which traditional aggregate models do not provide enough data and for which microscopic models provide too much data. The mesoscopic modeling environment in Cube-Avenue can be used for transportation planning studies, such as comparing policies for alleviating peak period congestion using the controldriver interaction in a traffic system, or examining the effectiveness of emergency evacuation plans.
Cs FFS X V C Y
= = = = = =
Congested Speed Free Flow Speed Coefficient (often set at 0.15), Assigned Traffic volume the link capacity exponent (often set at 4.0)
Figure-2 shows the volume-delay curves from cube-voyager travel demand model (Scenario 1) for different functional classes. Figure-2 also describes the values of coefficient X, and exponent Y for the calibrated model. The values of X and Y are the two critical parameters in the BPR function that vary by functional roadway classification, and are calibrated accordingly from the field data.
Figure-2. Volume delay curves from scenario 1. Static assignment A static assignment model based on user equilibrium was used for Cube-Voyager based Scenario 1. The model is fourth step of regional travel demand model (version 7) adopted by Wasatch Front Regional Council (WFRC), and MPO responsible for Transportation Planning for Wasatch Front Region in Utah. The travel demand model is fully calibrated and validated for the regional forecasting, and has been used in several regional planning studies of regional significance by the MPO ranging from studies for regional freeways, regional commuter transit projects, and light rail studies. The assignment model locates a specific route along the links and through intersections for every vehicle trip. The vehicle trips in the form of an origin-destination matrix are "assigned" to the network based on a user equilibrium model. The STA model specifies the effect of road capacity on travel times by means of volume-delay functions (VDF) which is used to express the travel time (or cost) on a road link as a function of the traffic volume. The VDF based on Bureau of Public Roads (BPR) function is used in Static traffic assignment process of Cube-Voyager model in Scenario 1. The function is used to relate changes in travel speed to increases in travel volume. The equation for BPR function can be described as in equation 1. Cs = FFS / [1+X*(V/C) ^Y]
(1)
The assignment model uses an iterative process to achieve a best path solution in which travelers’ travel costs are the best within the defined travel cost functions. The numbers of iterations for the traffic assignment-runs were fixed at 100 for consistency on comparison with other scenarios, rather than allowing the assignment to stop at an arbitrary iteration. The rationale for fixing the number of iterations in Static Assignment is the stability of traffic assignment is unique by iteration. The static traffic assignment results oscillate or flip-flop from one iteration to the next between alternating shortest paths. This approach attempts to minimize differences between different loaded networks due to oscillations by fixing the number of iterations, preventing different assignments from stopping at different iterations. Once the STA scenario (SCENARIO 1) simulation was done on Cube-Voyager, the regional loaded network was exported from cube-voyager to Cube Avenue along with all the network attributes. The network with the attribute data files from Cube-Voyager was then used by Scenario 2 and 3 for mesoscopic simulation in Cube Avenue. Dynamic assignment Cube Avenue is a dynamic equilibrium assignment model. Cube Avenue loads and tracks the
13
VOL. 6, NO. 12, DECEMBER 2011
ISSN 1819-6608
ARPN Journal of Engineering and Applied Sciences ©2006-2011 Asian Research Publishing Network (ARPN). All rights reserved.
www.arpnjournals.com movement of vehicle packets throughout the highway network. Vehicle packets can be any size ranging from an individual vehicle up to platoons of several vehicles. Cube Avenue explicitly simulates traffic flow and traffic control systems. It models traffic signals, roundabouts, stopcontrolled intersections, and ramp merges. Through an iterative process, Cube Avenue calculates optimal network conditions based on user defined travel costs. Typically, the model converges in several iterations, an extremely fast process for smaller systems and quite feasible for large urban areas. The software is capable of applying DTA to regions with over 3000 zones and 30000 links. The dynamic assignment model is programmed using the Cube scripting language. For this research, the DTA was applied as an iterative process where drivers made the route choice, based on their travel cost in previous run (previous day travel cost experience in real life). The best path in each run of the simulation is based on defined travel cost which was previous iterations travel times. Travel cost can also be in terms of distance, toll, or any other general cost associated with trip making. The changing traffic conditions in each run may change the travel cost, which leads to more routes with lower costs in subsequent runs. For convergence, Avenue requires that all paths must have a relative change lower than the defined threshold. Acceptable convergence criteria define indicators such as verifying that 95% of all paths are within 10 to 15% (25). Other standard practices look at mean errors. The travel time on paths was used as cost in DTA. A convergence criterion of 5% travel time difference on paths was used. For each run of DTA simulation, Cube Avenue compares the travel time on paths to the previous run. Based on the threshold, if the difference in travel time on all paths is less than or equal to 10%, the convergence criteria is met. Otherwise, the simulation continues until it reaches the maximum number of runs specified by the user or the convergence criteria whichever comes first. Travel time information files containing travel time for each OD pair were written for every run of DTA simulation using the output processing features of Cube Avenue. DTA based Scenario 2 and 3 met the set convergence criteria after 95 iterations. The data from 95th iteration of STA based Scenario 1 was used in comparisons for consistency on comparisons.
Traffic controls Scenario 1 was a traditional four step travel demand model and due to the macroscopic nature of the model not traffic controls were included in Scenario 1. Fixed Controls and Vehicle-Actuated Controls were used in the mesoscopic Scenario 2 and Scenario 3. Fixed controls usually operate on predetermined and repeated sequence of signal plans with fixed cycle length and splits. The signal timing plans are developed off-line and optimized based on historic data of traffic flow. A series of predetermined plans can accommodate variations in traffic volume during the day. Fixed controls are best with predictable traffic volumes. Vehicle-actuated controls differ from fixed control because they can respond to variations in traffic flow and are typically used is in situations with irregular traffic flow. The actuated controls can be grouped into two types: semi-actuated and fully actuated. Semi actuated systems primarily apportion the green time to the major movement of traffic and minor streets are accommodated at vehicle detection. Fully Actuated control systems detect vehicles on all approaches of the intersection and make adjustments according to the flow. The vehicle actuated controls were used with the limitations that offsets and cycle lengths would not change, and only green splits within the given cycle length framework could be adjusted. The changes in green split could respond to the variation in traffic flow due to different route choices of drivers in DTA simulation. Study area The study area covered entire Wasatch Front Region including all of the developable area of Utah, Salt Lake, Davis and Weber counties, with the exception of the canyons and mountains to the east of the urbanized areas. Figure-3 shows the study area and the TAZ structure. TAZs were mutually exclusive (they do not overlap) and they cover the entire model region. The model is a zonebased forecasting tool, modeling travel between aggregate Transportation Analysis Zones (TAZ).
Signal control emulator A National Electrical Manufacturers Association (NEMA) Standard Signal Control Emulator was used for traffic controls in test scenarios. This controller is embedded in Cube AVENUE and emulates common signal controllers used in North America. With this controller Cube Avenue can simulate fully actuated signal control as well as coordinated and vehicle-actuated coordinated signal control. Traffic control programs for each intersection in the study area network were coded in Cube Avenue.
14
VOL. 6, NO. 12, DECEMBER 2011
ISSN 1819-6608
ARPN Journal of Engineering and Applied Sciences ©2006-2011 Asian Research Publishing Network (ARPN). All rights reserved.
www.arpnjournals.com
Figure-4. Snapshot of 2007 street network.
Figure-3. Wasatch front region traffic area zones. The 2007 road network used for the model included all facilities functionally designated as collector or above by the Utah Department of Transportation (UDOT). There are approximately 25,000 road links in the base year network and over 13000 nodes including 60 signalized intersections and 60 intersections with 4-Way stop signs, and 2250 zonal nodes. Out of the 60 signalized intersections, 30 were located in urban core of Salt Lake County, 10 in urbanized area of Weber County, 10 in urbanized area of Davis County, and 10 in urbanized Area of Utah County. The same proportion was allocated to 4Way stop signs among the four counties. Figure-4 shows a portion of the model’s road network covering the Kaysville area.
Cube voyager based travel demand model The model is based on a traditional four-step modeling process consisting of trip generation, trip distribution, mode split, and trip assignment steps. The model incorporates these steps and adds an auto ownership step that is sensitive to urban design variables and transit accessibility. The model has a feedback loop between trip distribution and traffic assignment, which is a process that ensures consistency between travel congestion and times that influence trip distribution patterns and that are an outcome of trip assignment. Travel time, is calculated based on outputs from the assignment step, but also is an important determinant of trip distribution and mode split. Therefore, it is customary to iterate these steps in order to reach a convergent solution. Figure-5 outlines the various steps of travel demand model used in Scenario 1.
Figure-5. Different steps of cube based model. At the start of a model run, the auto ownership model estimates household auto ownership levels. The trip generation model then estimates trip-ends by TAZ based on household and employment characteristics. These tripends are then paired into trips in the trip distribution model. In the mode choice model, a mode of travel is identified for each trip. Vehicle trips are assigned to the highway network in the trip assignment model, during which congestion levels on each road are estimated consistent with route choices. The travel time feedback loop in the model is run to a convergent solution prior to running mode choice. The origin-destination matrix post mode-choice step was exported to cube avenue in order to include the impact of all trips in the region.
Time periods The trip generation and trip distribution models are daily models, while the mode choice model distinguishes peak and off-peak periods, and the traffic assignment model estimates traffic flows for four periods of day:
AM Peak: Midday: PM Peak: Evening/Off-peak:
6 AM - 9 AM 9 AM - 3 PM 3 PM - 6 PM 6 PM - 6 AM
At the end of the STA based scenario, the OD matrix for each peak period was exported for use by Cube Avenue software in DTA based scenarios.
15
VOL. 6, NO. 12, DECEMBER 2011
ISSN 1819-6608
ARPN Journal of Engineering and Applied Sciences ©2006-2011 Asian Research Publishing Network (ARPN). All rights reserved.
www.arpnjournals.com CALIBRATION AND VALIDATION OF THE MODELS The regional travel demand model base-run in Cube-Voyager with Static Assignment and no traffic controls (Scenario 1) has been calibrated and validated by WFRC to represent 2007 travel conditions and patterns by adjusting model input data, assumptions and parameters so that the final outputs more closely match observed data. The Cube-Avenue base-run with DTA and vehicle
R2 = 0.9444
actuated controls (Scenario 3) was calibrated for the mesoscopic traffic assignment simulation process. The mesoscopic assignment model was calibrated for speeds, and travel time data, and was also validated" against field counts data. Figure-6 part a) and part b) show the post validation comparison of field counts with modeled volume. In both cases of Scenario 1 and Scenario 3, the field counts closely matched with R2 = 0.9444, and R2=0.952, respectively.
R2 = 0.952
(a)
(b)
Figure-6. Modeled volumes and field counts (a) model vs. counts from scenario 1 (b) model vs. 2007 counts from scenario 3. For this research the speed and travel time data collected by WFRC and UDOT were used in calibration of the models. The data once compiled, is then transferred to the regional travel demand model Master Network for AM, PM, MD, and EV peak periods. The Master network can be opened in any modeling environment of Cube software (for example Cube-Voyager, and Cube-Avenue).
The data can also be ported and used for various comparisons within the Cube modeling framework, as well as in shape file format using ArcGIS software. Observed vs. modeled speed comparison was a crucial part of the model calibration process for Scenario 3. Figure-7 parts a) and parts b) show the observed vs. modeled speed comparison from the calibrated base-run of Scenario 3.
Figure-7. Observed vs. modeled speed a) AM peak observed vs. modeled speed b) PM peak observed vs. modeled speed.
16
VOL. 6, NO. 12, DECEMBER 2011
ISSN 1819-6608
ARPN Journal of Engineering and Applied Sciences ©2006-2011 Asian Research Publishing Network (ARPN). All rights reserved.
www.arpnjournals.com In addition to field counts vs. modeled volume comparison in Scenario 1 and Scenario 3, the model output was compared with field counts aggregated by peak periods at selected locations. The 2007 base-run peak period count data was collected from WFRC’s archived data inventory and was transferred to the Cube-Voyager and Cube-Avenue loaded networks. The Table-2 part a)
and part b) shows the validation summary for Scenario 1 (Cube Voyager based scenario) and Scenario 3 (CubeAvenue based Scenario with Vehicle Actuated Controls). The table shows that in both Scenario 1 and Scenario 3 the percent error was consistent within peak periods. The percent error was 3% higher in case of Arterials in AM Peak, and by 2% in PM Peak.
Table-2. Test scenarios a) scenario 1 validation summary b) scenario 3validation summary. a) Cube Voyager Period
Modeled
Counts
Vol Dif Vol % Error Model Pct Count Pct Pct Diff Pct Error (%)
All Roadways AM
925,856
844,354
81,502
9.7%
18.8%
18.1%
0.74
4.09
PM
1,223,262
1,099,117
124,145
11%
24.8%
23.5%
1.33
5.65
Daily
4,926,848
4,676,910
249,938
5%
696,035
657,098
38,937
6%
19.1%
19.1%
-0.08
-0.40
24.6%
23.2%
1.41
6.05
Freeways AM PM
899,351
797,369
101,982
13%
3,650,577
3,432,506
218,071
6%
AM
229,821
187,256
42,565
23%
18.0%
15.0%
2.96
19.67
PM
323,911
301,748
22,163
7%
25.4%
24.2%
1.13
4.66
1,276,271
1,244,404
31,867
3%
Daily Arterials
Daily
b) Cube Avenue Period
Modeled
Counts
Vol Dif Vol % Error Model Pct Count Pct Pct Diff Pct Error (%)
All Roadways AM
957,792
844,354
113,438
13.4%
18.9%
18.1%
0.88
4.89
PM
1,292,118
1,099,117
193,001
18%
25.5%
23.5%
2.04
8.70
Daily
5,058,139
4,676,910
381,229
8%
AM
703,249
657,098
46,151
7%
19.1%
19.1%
-0.04
-0.21
PM
890,082
797,369
92,713
12%
24.2%
23.2%
0.95
4.08
3,681,496
3,432,506
248,990
7%
AM
239,334
187,256
52,078
28%
18.4%
15.0%
3.39
22.50
PM
334,446
301,748
32,698
11%
25.8%
24.2%
1.51
6.23
1,298,392
1,244,404
53,988
4%
Freeways
Daily Arterials
Daily
The model output was also compared for Root Mean Square Error (RMSE), and Average Error. The RMSE is a measurement of error that weights the larger errors by more than they would be in an average error computation. The percent RMSE compares the RMSE
statistic to the average observed value. The RMSE is always higher than the actual average network error because of the weighting. The percent RMSE should generally be less than 40%, overall, with higher values
17
VOL. 6, NO. 12, DECEMBER 2011
ISSN 1819-6608
ARPN Journal of Engineering and Applied Sciences ©2006-2011 Asian Research Publishing Network (ARPN). All rights reserved.
www.arpnjournals.com regional travel models to perform relatively poorly on minor arterials, collector roads and local roads, where the count data resolution is not better. RMSE and Average errors were computed and compared among the scenarios for validation. Table-3 shows the Regional Validation summary for the model. The % RMSE was the highest in case of minor arterials, and was the minimum in case Freeways.
acceptable for low volume links and lower values expected for high volume links. The sum of differences is the average error of the network. This measure is usually expressed as a percent error. The modeling literature on model calibration recommend an average error for VMT and overall traffic volumes between +/-7% for freeways, +/-10% for major arterials and +/-15% for minor arterials. It is common for
Table-3. Regional validation summary of tested scenarios. SCN1 SCN2 CUBE STA NO AVENUE DTA TRAFFIC FIXED CONTROLS CONTROL
All Facilities Average Count Volume RMSE
23208
23208
7043
8697
%RMSE
SCN 3 AVENUE DTA VEHICLE ACTUATED CONTROL
SCN 3 SCN1 SCN2 AVENUE DTA CUBE STA NO AVENUE VEHICLE TRAFFIC DTA FIXED ACTUATED CONTROLS CONTROL CONTROL
Principal Arterials
23208 Average Count Volume 7712 RMSE
30095
30095
30095
8162
10162
8801
27%
34%
29%
301
301
301
1002
1769
1134
3%
6%
4%
18460
18460
18460
6401
7223
6722
39%
36% 598
30%
37%
1508
1508
1508 Number of Observations
Avergae Error
920
1432
1076 Average Error
Average % Error
‐4%
‐6%
102548
102548
12835
18654
%RMSE
13%
18%
15% %RMSE
35%
Number of Observations
102
102
102 Number of Observations
598
598
28
41
774
1129
831
0
0
‐4%
6%
‐4.5%
Number of Observations
33% %RMSE
‐5% Average % Error
Freeways
Minor Arterials
Average Count Volume RMSE
Average Error Average % Error
102548 Average Count Volume 15432 RMSE
33 Average Error 0 Average % Error
Figure-7 outlines the average percentage error (counts vs. modeled) across the Scenario1, Scenario 2, and Scenario 3 by highway facility types. The Figure shows that the average percent error was higher by up to two percent in case of mesoscopic simulations except. In
Scenario 2 with DTA and fixed controls, the average percent error was up to 6%, suggesting that the minor arterials had higher volume than counts compared to Scenario 1 and Scenario 3.
8 6
6
6
Average Percent Error
4 4
3
2 0
0
SCN1
0
SCN2
0 All
Freeways
Arterial
Minor Arterial
-2
SCN3
-4 -4
-4 -5
-6
-4.5
-6 -8
Figure-7. Average percentage error from scenarios.
18
VOL. 6, NO. 12, DECEMBER 2011
ISSN 1819-6608
ARPN Journal of Engineering and Applied Sciences ©2006-2011 Asian Research Publishing Network (ARPN). All rights reserved.
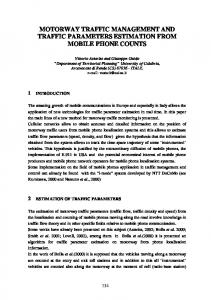
www.arpnjournals.com Speed estimates from Scenario 1 were compared to GPS speed data collected by WFRC throughout the model region. Once STA based Scenario 1 was simulated, the speed skims were exported for use by Avenue in DTA based scenarios. The simulated speed from mesoscopic Scenario 3 was also compared to field counts during the calibration process. The traffic assignment based modeled volumes from Scenario 1 (Cube-Voyager Base Scenario) and Scenario 3 Cube-Avenue Base Scenario, were compared for large screen lines across the modeling region. Screen lines are often associated with physical barriers such as rivers or rail- roads however jurisdictional boundaries such as county lines that extend through the study area make excellent screen lines. The Large Screen Line network attributes from Scenario 1 (Cube-Voyager travel model) were transferred to Cube Avenue loaded network, and the screen line modeled volumes were compared to screen line field counts across the screen lines. Figure-8 shows the Selected Screen Lines across the region. Total of 16 Large Screen Lines were used across the region. In regional models, screen line based comparisons help evaluate the reasonableness of aggregate traffic flows on selected sections of roads in the modeled region that intersects with screen lines. Screen lines are useful to evaluate relatively large flows moving across multiple roads and indicate in general whether the model is moving enough traffic across a certain line in the region. Table-4 shows the comparison of aggregate screen line
volumes to aggregate screen line field counts (week day traffic).
Figure-8. Large screen lines for Wasatch front region.
Table-4. Large screen line comparison (modeled vs. field) count comparison. Screen
Field Counts
Line
Field Counts
Modeled Volume SCN1
Difference
SCN 3
SCN1
Percent Difference
SCN3
SCN1
SCN 3
1
131103
116652
121221
-14451
-9882
-11%
-8%
2
233831
243351
221971
9520
-11860
4%
-5%
3
216583
208590
222963
-7993
6380
-4%
3%
4
149637
151088
143521
1451
-6116
1%
-4%
5
214584
198053
191429
-16531
-23155
-8%
-11%
6
711333
682452
669982
-28881
-41351
-4%
-6%
7
181952
208640
172214
26688
-9738
15%
-5%
8
679653
719947
621381
40294
-58272
6%
-9%
9
154515
161472
167523
6957
13008
5%
8%
10
20831
17965
23259
-2866
2428
-14%
12%
11
192658
217371
212654
24713
19996
13%
10%
12
168887
190707
182541
21820
13654
13%
8%
13
197884
206654
185224
8770
-12660
4%
-6%
14
112972
104342
118341
-8630
5369
-8%
5%
15
145745
123177
139788
-22568
-5957
-15%
-4%
16
146167
112839
127791
-33328
-18376
-23%
-13%
The table shows that the percent error for screen lines with large volumes was among lowers for screen was lower for screen lines with larger volumes. Figure-9 parts a) and b) show the percent error comparison to field counts for Scenario 1 and Scenario 3 respectively. In both scenario 1 (travel demand model on Cube-Voyager), and
Scenario 3 (CTAC based model on Cube-Avenue), as the observed traffic count across a screen line goes up, the acceptable error goes down as recommended and referenced in National Cooperative Highway Research Program (NCHRP) Report 25.
19
VOL. 6, NO. 12, DECEMBER 2011
ISSN 1819-6608
ARPN Journal of Engineering and Applied Sciences ©2006-2011 Asian Research Publishing Network (ARPN). All rights reserved.
www.arpnjournals.com Scenario 1
Scenario 3 15%
20% 15%
10% 5% 0% 0
100000
200000
300000
400000
500000
600000
700000
800000
-5% -10%
Percent Error
Percent Error
10% 5% 0% 0
100000
200000
300000
400000
500000
600000
700000
800000
-5%
-15% -10% -20% -25%
-15%
Screen Line Field Counts
Scenario 1
a)
Screen Line Field Counts
Scenario 3
b)
Figure-9. Large screen line calibration a) percent error (modeled vs. field counts) compared to field counts scenario 1 b) percent error (modeled vs. field counts) compared to field counts scenario 3. In case of Scenario 1 all but one regional screen line comparison with -23% stood out. Overall in both scenarios, models did well with this calibration measure. The regional screen line comparison was within +/- 15% for most of the screen lines, with several within +/-8%. RESULTS AND ANALYSIS In order to evaluate the benefits of implementing the combining traffic assignment and traffic controls framework on a regional scale, the system wide delay among the three scenarios, and modeled vehicle miles traveled (VMT) were compared to VMT estimated by highway performance monitoring system (HPMS). The HPMS is a national level highway information system that includes data on the extent, condition, performance, use, and operating characteristics of the nation's highways. The HPMS contains administrative and extent of system information on all public roads, while information on other characteristics is represented in HPMS as a mix of universe and sample data for arterial and collector functional systems. HPMS was developed in 1978 as a continuing database, replacing the special biennial condition studies that had been conducted since 1965. The HPMS has been modified several times since its inception to reflect changes in the highway systems, legislation, and national priorities, to reflect new technology, and to
consolidate or streamline reporting requirements. The HPMS Data on VMT was collected from UDOT by Geography. VEHICLE MILES TRAVELED COMPARISON BY GEOGRAPHY One of the key measures used in scenario analysis of regional travel models is vehicle miles traveled. According to the U.S. Bureau of Transportation Statistics, Vehicle Miles Traveled (VMT) is a good indicator of roadway use, and traffic congestion in a traffic system. Vehicle Miles Traveled (VMT) is the total number of miles driven by all vehicles within a given time period and geographic area. It is used by regional transportation and environmental agencies for planning purposes. Average weekday vehicle miles traveled were reported as a post processed data in all three scenarios through a post processing script written in Cube scripting language. Table-5 shows the comparison of VMT by functional type of highway, and by regional geography. The comparison shows that the combined traffic assignment and control framework implemented for this paper lowered the regional VMT by up to 7% on Davis County arterials. On a regional scale, the CTAC framework lowered the VMT by 2% in Freeways, and by 4% on arterials.
20
VOL. 6, NO. 12, DECEMBER 2011
ISSN 1819-6608
ARPN Journal of Engineering and Applied Sciences ©2006-2011 Asian Research Publishing Network (ARPN). All rights reserved.
www.arpnjournals.com Table-5. Vehicle miles traveled comparison by geography. Geography
SCN1
Source
Freeway
Modeled Weber County UDOT
SCN2
Arterial
Freeway
SCN3
Arterial
Freeway
Arterial
1,132,965 2,399,978 1,126,369 2,491,156 1,088,952 2,555,718 1,105,608 2,638,403 1,105,608 2,638,403 1,105,608 2,638,403
% Diff
2.50%
Modeled Davis County UDOT
‐9.00%
1.88%
‐5.58%
‐1.51%
‐3.13%
3,491,514 2,451,049 3,521,564 2,266,917 3,411,790 2,317,712 3,508,552 2,436,777 3,508,552 2,436,777 3,508,552 2,436,777
% Diff
‐0.50%
0.60%
0.37%
‐6.97%
‐2.76%
‐4.89%
Modeled 10,142,361 11,763,713 9,839,453 10,409,147 9,603,245 10,779,213 Salt Lake County UDOT
9,730,230 11,321,725 9,730,230 11,321,725 9,730,230 11,321,725
% Diff
Utah County
4.20%
3.90%
1.12%
‐8.06%
‐1.31%
‐4.79%
Modeled
4,025,398 4,949,700 4,122,798 4,553,908 3,986,721 4,511,609
UDOT
4,072,782 4,637,565 4,072,782 4,637,565 4,072,782 4,637,565
% Diff
‐1.20%
6.70%
1.23%
‐1.80%
‐2.11%
‐2.72%
Modeled 18,792,237 21,564,440 18,610,184 19,721,128 18,090,708 20,164,252 Region
UDOT % Diff
18,417,172 21,034,470 18,417,172 21,034,470 18,417,172 21,034,470 2.00%
2.50%
Delay reduction by functional type In addition to the VMT, the daily delay statistics from the three scenarios were compared on county level as
1.05%
‐6.24%
‐1.77%
‐4.14%
well on a regional scale. Table-6 outlines the daily delay in hours by geography.
Table-6. Delay by geography (Hours). Scenario WE % Diff DA % Diff SL % Diff UT % Diff RE % Diff SCN 1 4,797 7,280 39,956 12,454 64,483 SCN 2 4,602 -4.1 7,119 -2.2 38,401 -3.9 12263 -1.5 62,385 -3.3 SCN 3 4,234 -12 6,791 -6.7 38,131 -4.6 11897 -4.5 61,053 -5.3
The output data on delays in Table-5 shows that the mesoscopic traffic assignment based on CTAC framework with DTA simulations and vehicle actuated controls (Scenario 3) reduced the delay up to 6.7% in sub regions like Davis County, and reduce the overall regional delays by 5.3%. Both Table-4 and Table-5 show that the Combined Traffic Assignment and Control Framework based simulation help reduced the regional VMT and regional Delays compared to traditional travel demand models without traffic controls and combined framework. LIMITATIONS AND FUTURE RESEARCH The test network had only 60 signalized intersections region wide. The study can be expanded by adding more signalized intersections on the same set up. Only fixed controls and vehicle-actuated controls were used in this study. More tests can be done with adaptive traffic controls. Similar tests can be done using other software capable of simulating DTA and mesoscopic simulations. A computer with Intel ® Core ™ 2 QUAD CPU with 2.66 GHz processor and 3.24 GB of RAM was used to perform simulations. For larger networks from
other regions, it may take more time for convergence on the same computer. However, should the development trends continue, this may prove a smaller obstacle to researchers. CONCLUSIONS The paper evaluated the benefits of CTAC framework implemented regionally in comparison to regional travel demand model without traffic controls. A regional network covering the Wasatch Front Region of Utah was used to test three Scenarios. The CTAC framework based mesoscopic simulations used in the tests were able to capture interaction between drivers’ route choices and flow responsive traffic controls. The regional Vehicle Miles Traveled and Regional Delays reduced in CTAC based scenarios. The results suggest that the CTAC framework can be implemented on the regional scale networks. If implemented on regional travel models, the CTAC framework can help reduce the VMT and reduce regional delays by over 6%. With growing use of new methods to mitigate traffic congestion, the need for modeling methods that capture control-driver interaction is
21
VOL. 6, NO. 12, DECEMBER 2011
ISSN 1819-6608
ARPN Journal of Engineering and Applied Sciences ©2006-2011 Asian Research Publishing Network (ARPN). All rights reserved.
www.arpnjournals.com
REFERENCES
[12] Smith M.J. 1981. Properties of a Traffic Control Policy which ensures the existence of traffic equilibrium consistent with the policy. In Transportation Research 15B. pp. 453-462.
[1] Meneguzzer C. 1997. Review of Models Combining Traffic Assignment and Signal Control. In Journal of Transportation Engineering. 123(2): 148-155.
[13] Smith M.J. and van Vuren T. 1993. Traffic Equilibrium with Responsive Traffic Control. In Transportation Science. 27(2): 118-132.
[2] Bloomberg L. and Dale J. 2000. Comparison of the VISSIM and CORSIM traffic simulation models on a congested network. In Transportation Research Record: Journal of the Transportation Research Board. 1727/2000: 52-60.
[14] Taale H. and van Zuylen H.J. 2001. The combined traffic assignment and control problem - an overview of 25 years of research. 9th world conference on Transport Research, Seoul, Korea, July, 22-27.
growing. CTAC models therefore, can play an important role in regional congestion mitigation projects in practice.
[3] Abdelfetah A.S. and Mahmassani H.S. 1998. System Optimal Time-Dependent Path Assignment and Signal Timing in Traffic Network. In Transportation Research Record 1645. pp. 185-193. [4] Yaldi G. and Yue W. 2006. The use of Cube DynaSim and aaSIDRA in analyzing a signalized intersection. Presented In 29th Australian Transport Research Forum, Canberra ACT 2601, Australia. [5] Allsop R.E. 1974. Some possibilities for using traffic control to influence trip distribution and route choice. Proceedings of 6th International Symposium on Transportation and Traffic Theory, D. J. Buckley, Ed., Elsevier, New York, N.Y. pp. 345-373. [6] Maher M. J. and Akcelik R. 1975. The redistributional effects of an area traffic control policy. In Traffic engineering and control. 16, pp. 383-385. [7] Gartner N.H. 1976. Area Traffic Control and Network Equilibrium, Proceedings of International Symposium on Traffic Equilibrium Methods, M. Florian ed., Springer-Verlag, Berlin, Germany. pp. 382-395. [8] Allsop R. E. and Charlesworth J. A. 1977. Traffic in a signal-controlled road network: an example of different signal timings inducing different routings. In Traffic Engineering and Control. 18, pp. 262-264. [9] Smith M.J. 1979. The Existence, uniqueness and stability of Traffic Equilibria. In Transportation Research, 13b. pp. 295-304. [10] Smith M.J. 1981. The Existence of an Equilibrium Solution to the Traffic Assignment problem when there are junction intersections. In Transportation Research 15B. pp. 443-451. [11] Smith M.J. 1980. A Local Traffic Control Policy which maximizes the overall Travel Capacity of an urban road network. In Traffic Engineering and Control. pp. 298-302.
[15] Granato S. C. 1998. Discussion on Review of Model combining Traffic Assignment and Signal Control. In Journal of Transportation Engineering. 124(6): 611. [16] Gartner N.H. and Al-Malik M., A. 1996. A combined model for signal control and route choice in Urban Networks. In Transportation Research Record 1554. pp. 27-35. [17] Gartner N.H. and Stamatiadis. 1997. Integration of Dynamic Traffic Assignment with Real time Traffic Adaptive Control. Paper presented at the 76th annual TRB meeting, Washington D.C. [18] Meneguzzer C. 1995. An equilibrium route choice model with explicit treatment of the effect of intersections. In Transportation Research. -B, 29B. pp. 329-256. [19] Meneguzzer C. 1996. Computational experiments with a combined traffic assignment and control model with asymmetric cost function. Proceedings of 4th International conference on applications of Advanced Technology in Transportation Engineering. Y.J. Stephanedes and F. Filippi, eds., ASCE, New York, N.Y. pp. 609-614. [20] Taale H. and van Zuylen H.J. 2000. Traffic Control and Route Choice: Conditions for Instability. Chapter 5. M.G.H. Bell and C Cassir, eds., Reliability of Transport Networks. Research Studies Press Ltd, Baldock, United Kingdom. [21] Mahmassani H. S., Hu T. Y. 1997. Day-to-day evolution of network flows under real-time information and reactive signal control. In Transportation Research -Part C: Emerging Technologies. 5(1): 51-69. [22] Abdelfatah A.S. and Mahmassani H.S. 2000. TimeDependent Signal Control and System Optimal Assignment in Congested Networks: Algorithm Implementation and Numerical Results. Presented at the 79th Annual Meeting of the Transportation Research Board, Washington D.C.
22
VOL. 6, NO. 12, DECEMBER 2011
ISSN 1819-6608
ARPN Journal of Engineering and Applied Sciences ©2006-2011 Asian Research Publishing Network (ARPN). All rights reserved.
www.arpnjournals.com [23] Vorra T. and Brignone A. 2008. Modeling traffic in detail with mesoscopic models: opening powerful new possibilities for traffic analyses. WIT Transactions on the Built Environment. Vol. 101, WIT Press. [24] Roger Witte. 2006. Cube Avenue Theory, Cube Documentation System, Version 4.1.1, Citilabs December. [25] Ken Vaughn. 2006. Cube Avenue Example, Cube Demonstration Model, Version 4.1.1, Citilabs December. [26] Schiffer R., Rossi T. 2009. New Calibration and Validation Standards for Travel Demand Modeling. Proceedings of 88th Annual Meeting of Transportation Research Board, Washington D.C.
23