developed model will be used to deploy hardware prototype ... prototype hardware controller [7]. ... Loop Simulator," available on-line: http://www.opal-rt.com/.
Implementation of Conventional and Phasor Based Power System Stabilizing Controls for Real-Time Simulation M.S. Almas and L. Vanfretti
Abstract— This paper presents the implementation of three diffe rent types of Power System Stabilizers (PSS) and a Static Var Compensator with a supplementary Phasor Power O scillation Damper (POD) control for real-time simulation. The Kle in-Rogers-Kundur model is used as test case and the PSS and Phasor-POD’s performance is evaluated for both large and small disturbances. Modeling is performed in the MATLAB/Simulink e nvironment and is executed in real -time using O pal -RT’s e MEGAsim Real -Time Simulator. The simulation results and the de ve loped model will be used to deploy hardware prototype base d on embedded controllers to provide power oscillation damping. Real-time software in the loop (SIL) approach is used for validating developed models as a first logical step towards de ve lopment of a prototype hardware controller. Index Terms—Power System Stabilizer, Power O scillation Damping, Static VAR Compensator, Real -Time Simulation, O pal-RT, SmarTS-Lab
I. INTRODUCTION Historically, the power flows in power systems were very well defined. It was essentially a unidirectional power flow from the major generating sites to the load centres [1]. However this trend is changing now. With more and more integration of renewable energies, the generating capacity of the wind/solar farms could be reduced from 100 % to 10 % within an hour or even minutes due to natural behavior (wind speed, irradiation, etc.). Thus, power flows in the network shift very quickly [2]. As a result, system dynamics change. Small disturbances such as changes in loads or large disturbances like generator outage or a high voltage transmission line fault may result in undamped power oscillations in a heavily loaded interconnected power system [3]. These undamped oscillations if not adequately addressed, result in loss of synchronism of one or group of machines from the rest of the power system and may cause the system to collapse. This is called rotor angle instability and is mostly dominated by low frequency inter-area oscillations [4]. In order to provide adequate damping to these inter-area oscillations, Power System Stabilizers (PSS) [5] and supplementary control of Flexible AC Transmission Systems (FACTS) devices are used (referred as Power Oscillation Dampers (POD) [6]). In this paper, Klein-Roger-Kundur power system test case is modelled in MATLAB/Simulink
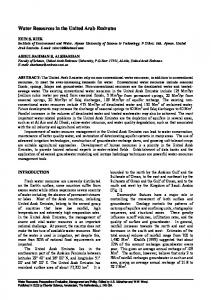
together with different PSS and Static VAR Compensator (SVC) Phasor-POD implementation. The model is analysed by introducing both large and small disturbances to validate the performance of PSS and POD to damp the inter-area oscillations. Real-time software in the loop (SIL) approach is used where both the controllers (PSS and POD) and the plant (power system model) are executed in the real-time simulator which is the first logical step towards development of a prototype hardware controller [7]. The simulation results and the developed model will be used to deploy power oscillation damping algorithms in embedded controllers to perform decentralized control of power system oscillations and will be validated using Real-Time Hardware-in-the-Loop (RT-HIL) approach. These results will be submitted in a future publication. The paper is organized as follows: Section II provides information about the modelling of the test case in MATLAB/Simulink. Section III presents the modelling of three different PSSs namely Multi-Band (MB-PSS), DeltaSpeed (d𝞈-PSS) and Delta-Accelerartion Power (dPa-PSS) and their performance in damping the inter-area oscillations. An average model of a SVC together with Phasor-POD implementation and its performance for oscillation damping is discussed in Section IV. Section V discusses the simulation results and in Section VI, conclusions are drawn and future work is summarized. I. POWER SYSTEM M ODELING In order to investigate the performance of different Power System Stabilizers (PSS) and Power Oscillation Dampers (POD), the Klein-Rogers-Kundur test system was modeled in the MATLAB/Simulink environment using the SimPowerSystems 1 Library and was executed in real-time using Opal-RT’s eMEGAsim Real-Time Simulator2. The single line diagram of the test case is shown in Figure 1. The test system consists of two fully symmetrical areas linked
Bus1 25 Km 10 Km
G1 900 MVA 20 kV / 230 kV
Local Loads
900 MVA
G2 900 MVA 20 kV / 230 kV
This work was supported in part by Nordic Energy Research through the STRONg2rid project and by Statnett SF, the Norwegian TSO. M. S. Almas, and L. Vanfretti are with KTH Royal Institute of Technology, Stockholm, Sweden. (e-mail: {msalmas, luigiv}@kth.se) L. Vanfretti is with Statnett SF, Research and Development, Oslo, Norway (email: {luigi.vanfretti, stig.lovlund, jan.gjerde}@statnett.no
Area 2
Area 1 900 MVA
967 MW 100 MVAR (Inductive) -387 MVAR (Capacitive)
220 Km Parallel Transmission Lines
Power Transfer Area 1 to Area 2
900 MVA
Bus2 10 Km 25 Km
G3 900 MVA 20 kV / 230 kV
Local Loads 1767 MW 100 MVAR (Inductive) -537 MVAR (Capacitive)
900 MVA
G4 900 MVA 20 kV / 230 kV
Fig. 1. Single line diagram of test case power system model 1
The MathWorks, "SimPowerSystems User's Guide," available on-line: http://www.mathworks.com/help. 2 Opal-RT, "eMEGAsim PowerGrid Real-Time Digital Hardware in the Loop Simulator," available on-line: http://www.opal-rt.com/
together by two 230 kV lines of 220 km length. Each area is equipped with two identical round rotor generators rated 20 kV/900 MVA. The nominal power system frequency for the test case model is 50 Hz. It was specifically designed in [8] to study low frequency electromechanical oscillations in large interconnected power systems. The load is represented as constant impedances and split between the areas in such a way that area 1 is exporting power to area 2. In order to analyze the response of the power system, a large disturbance in the form of three phase to ground fault (4 cycles i.e. 80 msec) at t=20 sec is introduced in the middle of Case 1: No PSS Rotor Angle Devitiaon
Case 1: No PSS Rotor Speed (wm)
Case 1: No PSS Active Power Transfer from Area 1 to Area 2
10
1.1
1000
6
800
1.06 600
Active Power (MW)
4
Machine 1 Machine 2 Machine 3 Machine 4
1.08
Machine 1 Machine 2 Machine 3 Machine 4
2 0 -2 -4
1.04
Rotor Speed (pu)
8
Rotor Angle (rad)
one of the two 220 km transmission line connecting Area 1 with Area 2. This results in an un-damped oscillation of 0.64 Hz which is observable in the tie-line power transfer between Area 1 and Area 2 as shown in Figure 2. In the second scenario 5% magnitude pulse was applied for 4 cycles at the voltage reference of generator G1 in Area 1. The system response to this perturbation is shown in Figure 3. This is an inter-area mode involving both the machines in Area 1 oscillate against the machines in Area 2. The models of PSS and POD discussed in the next section are designed to damp this inter-area mode of 0.64 Hz.
400
200
1.02 1 0.98 0.96
0
-6
0.94 -200
-8 -10 0
0.92
10
20
30 40 Time (sec)
50
60
-400 0
70
5
10
15
20
25 30 Time (sec)
35
40
45
50
0.9 0
55
10
20
30
40 Time (sec)
50
60
70
Fig. 2. Response of Test Case model when three phase to ground fault (4 cycles) is introduced at the middle of one of the 220 kV tran smission lines at t=20 sec. Rotor angle deviation (left), power transfer from Area 1 to Area 2 (middle) and rotor speed of all the generators (right) are shown. Case 1: No PSS Active Power Transfer from Area 1 to Area 2
Case 1: No PSS Rotor Angle Deviation (`d-theta)
8
600 500
2 0 -2
1
Rotor Speed (pu)
Active Power (MW)
Rotor Angle (rad)
4
400 300 200
-6
0
-8
-100
10
20
30 Time (sec)
40
50
60
-200 0
Machine 1 Machine 2 Machine 3 Machine 4 0.95
100
-4
-10 0
1.05
700
Machine 1 Machine 2 Machine 3 Machine 4
6
Case 1: No PSS Rotor Speed (wm)
800
10
5
10
15
20
25 30 Time (sec)
35
40
45
50
55
0.9 0
10
20
30
40 Time (sec)
50
60
70
80
Fig. 3. Response of Test Case model when a 5 % magnitude step is applied at the reference voltage of Generator 1 at t=20 sec. Rotor angle deviation (left), power transfer from Area 1 to Area 2 (middle) and rotor speed of all the generators (right) are shown. An inter-area oscillation of 0.64 Hz is observable in the tie-line power (middle).
II. POWER SYSTEM STABILIZER (PSS) M ODELING In order to provide appropriate damping for this 0.64 Hz inter-area mode, three different PSS designs were modeled and implemented in MATLAB/Simulink. The PSS output is provided as an additional input to the excitation system of synchronous generator used to add damping to the rotor oscillations of the synchronous machine by controlling its excitation. The different PSS implemented for damping the 0.64 Hz mode are discussed individually below; A. Multi-Band PSS The IEEE type PSS4B PSS is described in the IEEE Standard 421.5 [9] and is available in the SimPowerSystems library. This block was tuned to provide damping for the inter-area oscillation mode of 0.64 Hz. The model is shown in Figure 4
and is presented in [10]. It consists of three bands namely low, intermediate and high band. The low band takes care of very slow oscillating phenomena (i.e. drift mode). The intermediate band is used for inter-area modes usually found in the range of 0.2 to 1.0 Hz. The high band deals with local KL
Δ𝞈_LI FL
VL_min
KI Δ𝞈 Speed Rotor Speed Transducer Deviation Δ𝞈_H
VL_max
VI_max VI_min
FI KH FH
∑
VST_max VST To Exciter VST_min
VH_max VH_min
Fig. 4. MB-PSS simplified model with KL = 30 ,F L = 0.05 Hz ; Ki = 40.0 F I = 0.80 Hz ; KH = 160.0 F H= 8.0 Hz
modes either plant or inter- machines, with a typical frequency range of 0.8 to 4.0 Hz. In this study, only the inter-area mode of oscillation is of interest therefore, the local modes of the test case power system are neglected. As shown in Figure 4, the input to the MB-PSS is the rotor speed deviation and Case 21: Multi-Band Pass PSS Rotor Angle Deviation (d-theta)
output is a stabilizing signal which is added to the excitation system of synchronous generator to provide adeq uate damping. The response of the test case model in presence of MB-PSS for both large and small disturbances is shown in Figure 5 and Figure 6 respectively. Case 21: Multi-Band Pass PSS Rotor Speed (wm)
Case 21: Multi-Band Pass PSS Active Power Transfer from Area 1 to Area 2
0
-1
1.003
1000
Machine 1 Machine 2 Machine 3 Machine 4
1.001
-3
-4
-5
600
Rotor Speed (pu)
Active Power (MW)
-2
Rotor Angle (rad)
Machine 1 Machine 2 Machine 3 Machine 4
1.002 800
400
1 0.999 0.998
200
0.997 0
-6
-7 0
0.996
10
20
30
40 50 Time (sec)
60
70
80
-200 0
90
10
20
30
40 50 Time (sec)
60
70
80
90
0.995 0
10
20
30
40 50 Time (sec)
60
70
80
90
Fig. 5. Response of Test Case model when three phase to ground fault (4 cycles) is introduced at the middle of one of the 220 kV tran smission lines at t=20 sec in presence of MB-PSS. Rotor angle deviation (left), power transfer from Area 1 to Area 2 (middle) and rotor speed of all the generators (right) are shown. The inter-area oscillation of 0.64 Hz is adequately damped. Case 2: Multi-Band Pass PSS Rotor Angle Deviation (d-theta)
Case 2: Multi-Band Pass PSS Active Power Transfer from Area 1 to Area 2
-0.5
Case 2: Multi-Band Pass PSS Rotor Speed (wm)
500
1.0002
1 -1
-2
450
Rotor Speed (pu)
Active Power (MW)
Rotor Angle (rad)
0.9998 -1.5
0.9996 Machine 1 Machine 2 Machine 3 Machine 4
0.9994
400 0.9992
-2.5 0.999
-3 0
5
10
15
20 25 Time (sec)
30
35
40
45
350 0
5
10
15
20 25 Time (sec)
30
35
40
45
0.9988 0
5
10
15
20 25 Time (sec)
30
35
40
45
Fig. 6. Response of Test Case model when a 5 % magnitude step is applied at the reference voltage of Generator 1 at t=20 sec in presence of MB-PSS. Rotor angle deviation (left), power transfer from Area 1 to Area 2 (middle) and rotor speed of all the generators (right) are shown . The inter-area oscillation of 0.64 Hz is adequately damped.
B. Conventional Delta 𝞈 PSS The simplest method to provide a damping torque in the synchronous machine is to measure the rotor speed and use it directly as an input signal in the stabilizer structure. This PSS model was first proposed in [11] and is illustrated in Figure 7. It consists of a low-pass filter, a gain, a washout filter which is effectively a high-pass filter, a phase-compensation system in the form of lead-lag compensator, and an output limiter. The general gain “K” determines the amount of damping produced by the stabilizer. The washout high-pass filter allows the PSS to respond only to transient variations in speed input signal “d𝞈”. The phase-compensation system is represented by leadlag transfer functions used to compensate the phase lag between the excitation voltage and the electrical torque of the synchronous machine to provide adequate damping. The output limiter ensures to bound the controls action of a PSS during a major system disturbance and thus avoids the PSS to adversely affect the generator’s synchronism. All the parameters of the delta 𝞈 PSS are set according to [12]. The response of the test case power system in presence of delta 𝞈
PSS for both large and small disturbance is shown in Figure 9 and Figure 10 respectively. PSS Gain dw
K Low Pass Filter
To Excitation System (AVR)
1+T1s
Vstabilizer
1+T2s
Washout Filter
Phase Compensation Lead-Lag Filter
Limiter
Fig. 7. Model of conventional Δ𝞈 PSS [11]. PSS Gain (K) is set to 20, T1 and T2 for phase compensation are set to 0.05 and 0.02 respectively.
C. Conventional Acceleration Power (Delta Pa) PSS Acceleration power of a generator is defined as the difference between its mechanical input power and electrical power output. This acceleration power is used as an input signal for conventional PSS model presented in Figure 7. Pmechanical
PSS Gain
Low Pass Filter
To Excitation System (AVR)
1+T1s
K
Pelectrical
Vstabilizer
1+T2s
Washout Filter
Phase Compensation Lead-Lag Filter
Limiter
Fig. 8. Model of conventional ΔPa PSS. PSS Gain (K) is set to 3.5, T1 and T2 for phase compensation are set to 0.06 and 1 respectively.
The model of Delta Pa PSS is shown in Figure 8. The response of the test case power system in presence of delta Pa Case 3: Delta Speed PSS Rotor Angle Deviation (d-theta)
PSS for both large and small disturbance is shown in Figure 11 and Figure 12 respectively.
Case 3: Delta Speed PSS Active Power Transfer from Area 1 to Area 2
-0.5
Machine 1 Machine 2 Machine 3 Machine 4
-1
Case 3: Delta Speed PSS Rotor Speed (wm)
1000
1.003
800
1.002
600
1.001
Machine 1 Machine 2 Machine 3 Machine 4
-2 -2.5 -3
Rotor Speed (wm)
Active Power (MW)
Rotor Angle (rad)
-1.5
400
200
1
0.999
-3.5 0.998
0
-4 -4.5 0
10
20
30
40 50 Time (sec)
60
70
80
-200 0
90
10
20
30
40 50 Time (sec)
60
70
80
0.997 0
90
10
20
30
40 50 Time (sec)
60
70
80
90
Fig. 9. Response of Test Case model when three phase to ground fault (4 cycles) is introduced at the middle of one of the 220 kV tran smission lines at t=20 sec in presence of d𝞈-PSS. Rotor angle deviation (left), power transfer from Area 1 to Area 2 (middle) and rotor speed of all the generators (right ) are shown. Case 3: Delta Speed PSS Rotor Speed (wm)
Case 3: Delta Speed PSS Active Power Transfer from Area 1 to Area 2
Case 3: Delta Speed PSS Rotor Angle Deviation (d heta) t
0
Machine 1 Machine 2 Machine 3 Machine 4
-0.5
500
1.0006
480
1.0004
460
1.0002 1
-1.5
Rotor Speed (pu)
Active Power (MW)
Rotor Angle (rad)
440 -1
420 400 380 360
-2
-2.5 0
5
10
15
20 25 Time (sec)
30
35
40
0.9998 0.9996 0.9994 0.9992
340
0.999
320
0.9988
300 0
45
Machine 1 Machine 2 Machine 3 Machine 4
5
10
15
20
25 30 Time (sec)
35
40
45
0.9986 0
50
5
10
15
20 25 Time (sec)
30
35
40
45
Fig. 10. Response of Test Case model when a 5 % magnitude step is applied at the reference voltage of Generator 1 at t=20 sec in presence of d𝞈-PSS. Rotor angle deviation (left), power transfer from Area 1 to Area 2 (middle) and rotor speed of all the generators (right) are shown . The inter-area oscillation of 0.64 Hz is adequately damped. Case 4: Delta Power PSS Active Power Transfer from Area 1 to Area 2
Case 4: Delta Power PSS Rotor Angle Deviation (d-theta) 0
Machine 1 Machine 2 Machine 3 Machine 4
-1
Case 4: Delta Power PSS Rotor Speed (wm)
1000
1.003
Machine 1 Machine 2 Machine 3 Machine 4
1.002
800
-2
-4 -5
600 Rotor Speed (pu)
Active Power (MW)
Rotor Angle (rad)
1.001
-3
400
1
0.999
200 0.998
-6
0
-7
-8 0
20
40
60 80 Time (sec)
100
120
140
0.997
-200 0
20
40
60 80 Time (sec)
100
120
0.996 0
140
20
40
60 80 Time (sec)
100
120
140
Fig. 11. Response of Test Case model when three phase to ground fault (4 cycles) is introduced at the middle of one of the 220 kV tran smission lines at t=20 sec in presence of ΔPa-PSS. Rotor angle deviation (left), power transfer from Area 1 to Area 2 (middle) and rotor speed of all the generators (right) are shown. Case 4: Delta Power PSS Rotor Speed (wm)
Case 4: Delta Power PSS Active Power Transfer from Area 1 to Area 2
Case 4: Delta Power PSS Rotor Angle Deviation (d-theta) -0.5
-1
1.0002
450
Machine 1 Machine 2 Machine 3 Machine 4
440
Machine 1 Machine 2 Machine 3 Machine 4
1
430
-2
-2.5
0.9998
Rotor Speed (pu)
Active Power (MW)
Rotor Angle (rad)
-1.5
420
410
0.9996
0.9994 400
-3
-3.5 0
0.9992
390
5
10
15
20
25 30 Time (sec)
35
40
45
50
380 0
5
10
15
20
25 30 Time (sec)
35
40
45
50
0.999 0
5
10
15
20
25 30 Time (sec)
35
40
45
50
Fig. 12. Response of Test Case model when a 5 % magnitude step is applied at the reference voltage of Generator 1 at t=20 sec in presence of ΔPa-PSS. Rotor angle deviation (left), power transfer from Area 1 to Area 2 (middle) and rotor speed of all the generators (right) are shown. .
A. SVC Model Developed in MATLAB/Simulink In this study an average model of SVC is developed in MATLAB/Simulink which exhibits the behavior required for small signal stability analysis. The model developed is shown in Figure 13. The voltage error signal at the mid-point is fed to a PID controller which provides a value of the susceptance (BSVC) of the SVC. This susceptance is used to compute three phase current which is injected at the SVC’s point of connection to increase or decrease the voltage at the bus. In order to verify the performance of the developed model for voltage control at midpoint, Vreference of SVC is changed to 1 pu at t=40 sec, then to 0.97 pu at t=60 sec and finally back to 1 pu at t= 90 sec. Figure 14 shows the response of midpoint voltage of the test case power system for these changes in Vreference of SVC. Figure 15 shows different SVC parameters and the effect of changes in the reference voltage to the power transfer between Area 1 and Area 2.
SVC Current (A)
x 10
Kd
∫dt
Bsvc_max Proportional
Bsvc_min
d dt Derivative
Bsvc Iq
Ia
dq
abc
Vq
dq
-1
Ib
abc
Id
Ic
Bsvc
Fig. 13. Average model of SVC developed in MATLAB/Simulink and coupled at the midpoint of the 220km long transmission line of the test case system. Voltage Control at Midpoint by SVC
1.04
Voltage at MidPoint Voltage Reference
1.03 1.02 1.01 1 X: 40.07 Y: 0.9881
0.99 0.98 0.97 0.96 0
20
40
60 Time (sec)
80
100
120
Fig. 14. Midpoint voltage of the test case system. The voltage reference of the SVC model is changed to control the midpoint voltage.
Power Transfer from Area 1 to Area 2
8
4.2
x 10
4.18 4.16
20
40
60
80
100
X: 62.11 Y: 0.0006528
X: 90.89 Y: -0.0007875
20
40
60
80
100
200
4.14
X: 62.11 Y: 4.126e+008
4.12 4.1
X: 40.07 Y: 4.102e+008
4.08
X: 90.89 Y: 4.067e+008
4.06 4.04
0 -200 0
Vmeasure
X: 40.07 Y: -5.164e+006
0 -2 0
Kp
Reactive Power Injected by SVC at MidPoint
0 -1 0 -3 x 10 2
ΔVPOD
Power (Watts)
Susceptance (S)
Reactive Power (VAR)
8
1
Integral
Ki
Vreference
Mid Point Voltage (pu)
III. STATIC VAR COMPENSATOR (SVC) AND POWER OSCILLATION DAMPER (POD) Power oscillation damping can be effectively achieved by supplementary control of Flexible AC Transmission Systems (FACTS) devices [13]. For this study, an average model of a Static Var Compensator (SVC) is implemented in MATLAB/Simulink to provide adequate damping to the 0.64 Hz oscillatory mode in addition to providing reactive power support at the mid-point of the 220 km long transmission line connecting Area 1 with Area 2 (see Figure 1).
4.02
20
40
60
80
100
4 0
20
40
60 Time (sec)
80
100
120
Fig. 15. Reactive power injected by SVC, susceptance and current injected at the midpoint (Left), power transfer between Area 1 and Area 2 (Right).
B. Power Oscillation Damper Implementation Conventional PODs or PSS based on lead-lag compensation systems require a detailed model of the system at specific operating condition. These controllers provide appropriate phase shift and thus oscillation damping within a certain operating condition [8]. It is cumbersome to accurately model each and every dynamic component to compute the necessary gain and phase shift required for providing appropriate damping. In addition, the complexity of the large inter-connected power systems may lead to varying operating conditions which might not be considered when computing parameters of conventional PSS or PODs [14]. Another approach for generating command signals for damping is called phasor POD proposed in [15]. The principle
for creating the damping signal using the Phasor POD approach is shown in Figure 16. Paverage RLS or Low Pass Filtering based Phasor Extraction
Poscillatory
Phase Shift
Transformation to time domain
ωt
D(t) damping signal Fed to SVC Control to provide damping for inter-area oscillation
Free Running Oscillator
ω Δω
∑
∑ Phase angle computation
Extracted phasor
PI Controller
Unit delay
Fig. 16. Operating principle of Phasor POD and generation of control signal for SVC to provide power oscillation damping
The main objective is to separate the oscillatory part of the input signal from the average value. The oscillatory part of the measured input signal is extracted as a phasor by using either recursive least square estimation technique or a low pass filter. The damping signal is computed by applying appropriate phase shift on the extracted oscillatory signal phasor [15].
-2
-2.5
-3
-3.5
1 0.95 0
-110
10
20
30
40 50 Time (sec)
60
70
80
40
50
60
Machine 1 Machine 2 Machine 3 Machine 4
1.002
90
x 10 -2.5 2 0 -2 -310 0
8
1.001
20
30
40
50
60
70
80
90
-3
1.0005 1 0.9995
20
30
40
50
60
70
80
90 0.999
-3.5
0.9985
0
-500 0
90
30
1.0015
x 10 -1.5 1 0 -1 -210 0
500
-4 0
20
1.0025
Machine 1 Machine 2 Machine 3 70 80 Machine 4
Rotor Speed (pu)
Rotor Angle (rad)
-1.5
-0.5
Rotor Angle (rad)
-1
Case 5: Power Oscillation Damping Rotor Speed (wm)
Case5: PowerPower Oscillation Damping Case 5: Phasor Oscillation Damping SVC support forAngle Power Oscillation Rotor Deviation (d-theta)Damping
1.05
Reactive Power (VARs)
Machine 1 Machine 2 Machine 3 Machine 4
Current Injection Susceptance (Amperes) (S)
Voltage MidPoint(pu)
Case 5: Phasor Power Oscillation Damping Rotor Angle Deviation (d-theta) -0.5
This damping signal is provided as one of the inputs to the developed SVC model (see Figure 13) which results in voltage error in case of oscillatory content in the measured input signal to the POD. The response of the test case power system in presence of Phasor POD for both large and small disturbance is shown in Figure 17 and Figure 18 respectively.
-4 0 10
1020
20 30 30
4040
50 50 Time (sec) Time (sec)
6060
70 70 80
8090
0.998 0
90
10
20
30
40 50 Time (sec)
60
70
80
90
Fig. 17. Response of Test Case model when three phase to ground fault (4 cycles) is introduced at the middle of one of the 220 kV tran smission lines at t=20 sec in presence of phasor POD and SVC. Rotor angle deviation (left), SVC reactive power (middle) and rotor speed of all the generators (right) are shown.
Reactive Power (VAR)
450
400
350 0
-1.5
10
-3
4 Susceptance (S)
-2
-2.5
-3 0
5
10
15
20 25 Time (sec)
30
35
40
45
x 10
20 30 Time (sec)
1.0015 -1
-1 1.001
10
-2
x 10
40
0
-1.5 1.0005
-2
1
-2 0.9995
0.999 -2.5
-4
0.9985
-6 -8 0
40
20 30 Time (sec) POD Signal for SVC
4
0
Machine 1 Machine 2 Machine 3 Machine 4
1.002
0
2
20 30 Time (sec)
1.0025 -0.5
1
SVC Susceptance
10
x 10
-2 0
40
2
-4 0
Case 5: Phasor Power Oscillation Damping Case 5: Phasor Power Oscillation Damping Rotor Angle Deviation (d-theta) Rotor Speed (wm)
Reactive Power Injection By SVC
8
2
Delta Voltage (V)
Active Power (MW)
Machine 1 Machine 2 Machine 3 Machine 4
-1
Rotor Angle (rad)
Active Power Transfer From Area 1 to Area 2 500
-0.5
Rotor Angle (rad) Rotor Speed (pu)
Case 5: Phasor Power Oscillation Damping Rotor Angle Deviation (d-theta)
10
20 30 Time (sec)
0.998 -3 0 0
40
5
5
10 10
15 15
20 20 25 25 Time (sec) Time (sec)
30 30
35 35
4040
4545
Fig. 18. Response of Test Case model when a 5 % magnitude step is applied at the reference voltage of Generator 1 at t=20 sec in presence of Phasor POD and SVC. Rotor angle deviation (left), power transfer from Area 1 to Area 2 together with SVC susceptance and reactive power injecti ons (middle) and rotor speed of all the generators (right) are shown. The inter-area oscillation of 0.64 Hz is adequately damped.
large overshoot instantly after the fault is applied but provides fastest damping as compared to the other two PSS. The overshoot can be reduced by optimizing the limiters (VL_max and VL_min) in Figure 4. MB-PSS has the capability of damping both inter-area and local modes and its capabilities with respect to other two PSS can be better understood if the system contains atleast one dominant local mode (which is neglected in this study). Delta-ω PSS (green trace) has a better response as compared to delta-Pa PSS (yellow) because of
IV. DISCUSSION ON SIMULATION RESULTS Rotor angle deviation of Generator 1 and power transfer between Area 1 and Area 2 is presented for large disturbance (three phase fault) for all the cases in Figure 19. In absence of a PSS or POD, the system is unstable (grey trace) and the 0.64 Hz oscillatory mode is visible in the active power transfer between Area 1 and Area 2 when subjected to either small or large disturbance. All the PSS types provide adequate damping for 0.64 Hz mode. The MB-PSS (blue trace) has a
Comparison of Power Transfer between Bus 1 and Bus 2 for all Cases
Comparison of Generator 1 Rotor Speed for all Cases
1000
1.015 No PSS Multi-Band Pass PSS Delta Speed PSS Delta Power PSS SVC based POD
Active Power (MW)
Rotor Speed (pu)
1.01
No PSS Multi-Band Pass PSS Delta Speed PSS Delta Power PSS SVC Based POD
800
1.005
600
400
200
1 0
0.995 0
10
20
30 Time (sec)
40
50
60
-200 0
5
10
15
20
25 30 Time (sec)
35
40
45
50
Fig. 19. Response of Generator 1 rotor speed when three phase to ground fault (4 cycles) is introduced at the middle of one of the 220 kV transmission lines at t=20 sec for all the cases (left). Power transfer between Area 1 and Area 2 for all the test cases (right) are shown..
7
the dependence of delta-Pa PSS on mechanical power input (Pa =Pmech-Pelect) of the generator which is regulated by turbine governor control. This results in delta-Pa PSS to respond to slow dynamics of the interaction between synchronous machine inertia and turbine’s governor control for regulating speed of the machine in an aftermath of disturbance and as a result it takes a longer time to damp the oscillations as compared to delta- ω PSS. The performance of phasor POD (magenta trace) shows a relatively slower response in damping out the 0.64 Hz mode as compared to MB-PSS or Delta-ω PSS. This is because the recursive technique is used to estimate phasor of the oscillatory part in the input measured signal. Recursive least square method yields somewhat less accurate phasor estimation during the first cycle. In addition the gain for the phasor POD is kept relatively low, so that the SVC does not adversely affect the system synchronism by injecting or absorbing significant reactive power. In order to implement the average SVC model for real-time execution, an Artemis Stub-Line block [16] was used which provides exactly one time step propagation delay to avoid algebraic loops in the model. This stub-line injects some reactive power into the network. In order to cancel out the additional reactive power, a fixed inductor was used in series to the stub-line. In addition the stub-line resistance causes some active power dissipation across it which is visible in Figure 19 (Right). This results in relatively less power transfer from Area 1 to Area 2. All the test scenarios are executed in real-time using four cores of Opal-RT’s eMEGAsim Real-Time simulator with a discrete step size of 50 µsec. The real-time computation time is less than 10 µsec which is well below 50 µsec step size and thus no over-runs were detected for all the test cases. V. CONCLUSION AND FUTURE W ORK The performance of three different types of power system stabilizers together with an SVC with supplementary PhasorPOD control were implemented to provide damping enhancement in the Klein-Rogers-Kundur test power system model. An average model of an SVC together with a PhasorPOD implementation was also presented. Multi-Band PSS shows the fastest response for oscillation damping. The Static VAR Compensator model when coupled with the test case system together with Phasor-POD implementation provided both reactive power support and adequate damping for 0.64 Hz mode. Real-time software in the loop (SIL) approach is used where both the controllers (PSS and POD) and the plant (power system model) are executed in the real-time simulator which is the first logical step towards development of a prototype hardware controller. The models developed in this study together with the Phasor-POD algorithm will be implemented in the National Instruments Compact Reconfigurable I/O (cRIOs) [17] systems for real-time hardware-in-the-loop (RT-HIL) simulation. SmarTS-Lab at KTH has recently commissioned ABB Excitation System Unitrol 10203 which will be used for 3 ABB-Unitrol 1020 Automatic Voltage Regulator, available online: http://tinyurl.com/Unitrol
RT-HIL simulation to replace the software model for one of the generator’s excitation control system in the test case system. In addition the System-in-the-Loop (SITL) package [18] together with OPNET network simulator4 is being configured in SmarTS-Lab to simulate network delays and latencies in the feedback signal for the PODs to effectively address the effect of communication delays. These results will be submitted in a future publication. REFERENCES [1] G. Heydt , C. Liu , A. Phadke and V. Vittal "Solution for the crisis in electric power supply", IEEE Comput. Appl. Power, vol. 14, no. 3, pp.22 -30 2001 [2] D. Gautam, V. Vittal and T. Harbour, “ Impact of Increased Penetration of DFIG-Based Wind Turbine Generators on Transient and Small Signal Stability of Power Systems” IEEE Transactions on Power Systems, Vol. 24 , No. 3, August 2009 , pp. 1426 - 1434 [3] G. Rogers, “ Power System Oscillations”, Kluwer Academic Publishers Group, 2000. [4] J.J. Sanchez-Gasca and J.H. Chow, “ Performance comparison of three identification methods for the analysis of electromechanical oscillations”, IEEE Transactions on Power Systems, Vol. 14, No. 3, August 1999, pp. 995-1002 [5] P. Kundur ; M. Klein G. J. Rogers and M. S. Zywno, “ Application of Power System Stabilizers forEnhancement of Overall S ystem Stability”, IEEE Transactions on Power Systems, Vol. 4, No. 2, August 1989, pp. 614-626 [6] L. Angquist, B. Lundin and J. Samuelsson, “ Power oscillation damping using controlled reactive power compensation-a comparison between series and shunt approaches”, IEEE Transactions on Power Systems, Vol. 8 , No. 2, July 1993 , pp. 687 – 700 [7] J. Belanger, P. Venne, and J. N. Paquin, “ The What, Where and Why of Real-Time Simulation”, Technical report, Opal-RT Technologies. Available at: http://www.opal-rt.com/technical-document/what-whereand-why-real-time-simulation. [8] M. Klein , G. Rogers and P. Kundur "A fundamental study of interarea oscillations in power systems", IEEE Trans. Power Syst., vol. 6, no. 3, pp.914 -921 1991 [9] IEEE Std 421.5-2005, “ IEEE Recommended Practice for Excitation System Models for Power System Stability Studies”, 2005 [10] R: Grondin, I. Kamwa, et.al, “ Modeling and closed-loop validation of a new PSS concept, the multi-band PSS”, IEEE Power Engineering Society General Meeting, 13-17 July, 2003, Toronto, Canada [11] M. Klein, J. Rogers, S. Moorty and P. Kundur: "Analytical investigation of factors influencing PSS performance," IEEE Transactions on Energy Conversion, Vol. 7 , No 3, September 1992, pp.382-390 [12] P. Kundur, M. Klein, G. J. Rogers and M.S. Zywno, “ Application of Power System Stabilizers for Enhancement of Overall System Stability”, IEEE Transactions on Power System, Vol. 4, Issue 2, pp. 614-626, May 1989 [13] N. Mithulananthan, “ Comparison of PSS, SVC, and STATCOM controllers for damping power system oscillations”, IEEE Transactions on Power Systems, Vol. 18, Issue 2, pp. 786-792, May 2003 [14] N. R. Chaudhuri , S. Ray , R. Majumder and B. Chaudhuri "A case study on challenges for robust wide-area phasor POD", Proc. IEEE Power Eng. Soc. General Meeting, 2009 [15] L. Angquist and C. Gama, “ Damping algorithm based on phasor estimation”, IEEE Power Engineering Society Winter Meeting, 2001, Vol. 3, pp. 1160-1165 [16] ARTEMiS Stubline - decoupling of state-space system equations of networks on both sides of the stubline and eliminates algebraic loop. http://www.opalrt.com/sites/default/files/ARTEMIS_User_Guide(1).pdf [17] National Instrument- Compact Reconfigurable I/O Systems (NIcRIOs), available online: www.ni.com/compactrio/ [18] K. McNeill, R. Martinez, W. Wu, and J. Deal, “ HITL /SITL General Reference Model,” OPNETworks 2003 Symposium, Washington DC,August 2003 4 OPNET Modeler for communication Network Simulation, OPNET Technologies. http://www.OPNET.com