E-Learning Environment in Rural and Urban areas of Pakistan ... online [1]. For this purpose acceptance of computer things we do today is computer-aided.
World Applied Sciences Journal 27 (11): 1495-1507, 2013 ISSN 1818-4952 © IDOSI Publications, 2013 DOI: 10.5829/idosi.wasj.2013.27.11.1787
Implementation of Technology Acceptance Model in E-Learning Environment in Rural and Urban areas of Pakistan Ghias Ud Din Shah, Mansoor Nazir Bhatti, Mehwish Iftikhar, Muhammad Imran Qureshi and Khalid Zaman Department of Management Sciences, COMSATS Institute of Information Technology Abbottabad, Pakistan Abstract: Increasing innovative trends in information and communication technologies may create new forms of learning. Information technology (IT) has been empowered to support teaching and learning in classrooms. Increased emphasis on e-learning process has caused some basic behavioral changes in traditional learning process. Current study tries to investigate the technology acceptance behavior of the students using e-learning. Study used Technology Acceptance Model (TMA) for the assessment of student behavior using E-learning in rural and Urban Area of Pakistan. A five point likert scale questionnaire is used to collect data from convenient sample of 400 students enrolled in e-learning from the rural and urban areas of Pakistan. Result indicates infrastructure of e-learning environment (information quality, service quality and system quality) has a direct effect with perceived usefulness of e-learning and ease to use which lead to positive intentions towards use of E-learning. Key words: Information Technology
E-learning
Technology Acceptance Model
INTRODUCTION In today’s world literacy has proven to be one of the most important quests of learning. Especially the Computer literacy has caused a major apprehension to many individuals accepting the fact that most of the things we do today is computer-aided. In order to enhance learning, computer has made major impacts especially in education. There is online learning, distance education and e-learning. Today’s education has taken various shapes, especially this time the language that is spoken by most of the learners and individuals is based on ICTs i-e information and communication technologies. Increasing innovative trends in information and communication technologies (ICTs) and the current expansion in electronic learning may create new forms of learning. Today’s learners have tried to enhance their learning in institutions by embracing these technologies. Information technology (IT) has been empowered to support teaching and learning in classrooms [1] [2] interaction between students and teachers became very much restricted because of limited time and space, in traditional classroom environment. Contrary to this, IT
Information quality
provides a platform like online discussion forum students and teachers can easily interact with one another without any limitation [3, 4, 5, 6]. In order to broaden the learning experience teachers can be benefited from IT by delivering some of the part of course content online [1]. For this purpose acceptance of computer technology is required. Lots of models have been developed for better understanding and investigation of such factors that affect the computer technology acceptance like TRA (theory of reasoned action) by [5 7, 8]; the theory of planned behavior (TBP)) [5, 6], the technology acceptance model i-e TAM [9]. However current research is focused on the TAM i-e technology acceptance model and to understand how it is implemented on e-learning. Literature Review: Most of the researchers have studied systems of e-learning that are deep rooted in the traditional face-to-face learning with the great recognition of IT’s importance [10]. Researchers strongly consider that the IT use in such an e-learning context is valuable and beneficial and can be the source of enhancing learning outcomes [11].
Corresponding Author: Ghias Ud Din Shah, Department of Management Sciences, COMSATS Institute of Information Technology Abbottabad, Pakistan.
1495
World Appl. Sci. J., 27 (11): 1495-1507, 2013
The Commission on Technology and Adult Learning [12] defines e-learning as it is a learning experiences or instructional content that is delivered by electronic technology. It consist of instructions that are enabled through all electronic media including the internet, extranets, intranets, satellite broadcasts, interactive TV and CD-ROMs, audio/video tapes etc [13]. [14] Defines e-learning as the ‘‘rise of network technology to design, deliver, select, administer and extend learning’’. There are two major categories of e-learning i-e synchronous and asynchronous [15]. Synchronous learning consists of learning model that initiates a classroom course, meeting or lectures with the help of internet technologies. While Asynchronous learning uses a web-based version of computer-based training (CBT), which is accessible on a CD-ROM or across an organization’s LAN i-e local area network. There are lots of studies that have investigated about what factors are influencing most the e-learning participation. Most of them are the extension of TAM i-e technology acceptance model [16, 17, 18]. This model states that if we want to determine the success of a system it can be done by determining the user acceptance of the system, that could be measured by 3 factors i-e Perceived Usefulness (PU), perceived ease of use (PEOU) and attitude towards usage (ATU) of the system [16]. If we take the example [19, 20] added perceived credibility into TAM in order to study the acceptance of asynchronous e-learning systems of engineers. [19] Studied deeply the difference of gender of employees’ e-learning acceptance on the bases of TAM. [21] Elaborated the TAM model by adding four determinants i-e individual, organizational, task characteristics and subjective norm of perceived ease of use and perceived usefulness. System will not be perceived as useful if it is not easy to use, so the electronic learning will no more be beneficial Just constructing an e-learning system is not an assurance of its acceptance and usage among students [1]. It is observed by most of the researchers that students may experience lots of difficulties in the formal usage of these systems and they may show dissatisfaction [2]. For the successful implementation of e-learning system student participation is very much important [1]. It is essential to study the ways that can facilitate student participation in the systems of e-learning [22]. Use of TAM is predicted as how many individuals are having control over the system, whether they can use it or not [23]. TAM specifies three factors, Perceived usefulness (PU) defined as “the degree to which a person
believes that using a particular system would enhance his or her performance" [16]. Perceived ease of use (PEOU) means "the degree to which a person believes that using a particular system would be free of effort" [16]. And attitude towards usage (ATU) refers to the “the degree to which an individual evaluates and associates the target system with his or her job” [18]. All of the factors play vital role in the implementation of e-learning. James O. [24] revealed that the implementation of e-learning mostly depends on teacher competence, computer provision and its access. In today’s world, technology is more flexible, accessible, more portable and more persistent than before. Everyone is now aware of the importance of digital technology that how it changes the ways for learning and education. This may serves as a mean for improved quality of educational opportunity, greater education diversity, greater standards and higher effectiveness. E-learning has implications for teachers and leaders, pupils and parents. The success of implementation of e-learning depends on following the pedagogical principles that are embedded in the e-learning experiences and can be applied to both the e-learning and the traditional classroom delivery method [25]. He also identified seven parameters that may affect the successful implementation of e-learning that comprises of institutional support, course development, teaching and learning, course structure, student support, faculty support and evaluation and assessment. [24] Discussed about the advantages and disadvantages of e-learning in his article, some of them include it is less costly to deliver, faster, self-paced, consistent and works anytime and anywhere for learners. It’s easy to update instructional material and permits multimedia usage that leads towards learning through use of audio, video, quizzes and other ways of interaction and communication. [28] mentioned that e-learning provide immediate feedback and can improve retention and in order to meet individual needs it allows learners to customize learning material easily. It provides an opportunity to get knowledge, make associations with new people and sharing of professional experience without any expenses of travelling, workshops and conferences [26]. On the other hand according to [24], e-leaning may have some disadvantages that are it requires more responsibility on the part of learner to keep up with changing learning processes. It may be costly in order to develop. Required technology might be threatening, frustrating and costly and can be confusing for learners.
1496
World Appl. Sci. J., 27 (11): 1495-1507, 2013
Students seem more active at all levels and they are fully aware of technological changes and capabilities and are inflowing through changing phases of e-learning via online interaction. Rapidly changing environment provides many opportunities but presents challenges and risks too. To cope with this issue everyone must react to these changes so that they can easily meet the need of modern day technologically driven society [24]. Behavior Theory and Technology Acceptance Model: Ajzen and Fishbein [8] presented the Theory of Reasoned Action (TRA) in 1975.This theory concerns about the behavioral tendency of a person.TRA argues that behavior of individual is determined by behavioral intensions and behavioral intensions are related to an individual’s attitude function that are directed toward the subjective norms and behavior that environs the behavior’s performance. By the perspective of this theory, both the attitude and subjective norms are having independent affect on each other and they both have indirect affect on behavior of an individual with the help of behavioral intension. Any positive or negative feelings while performing any sort of behavior is called persons attitude toward behavior. Social pressures are reflected by the subjective norm while individual is performing the behavior as well as his perception about whether its important for an individual the behavior should be performed. Theory of planned behavior (TBP) is proposed be Aizen [27] in 1985. It’s an extension of TPA i-e Theory of reasoned action that worked for more appropriate interpretation and prediction of behavioral theory. If we differentiate between TRP and TRA,TRP make predictions about the behavior under circumstances that are less controllable comparatively, while TRA predicts behaviors depends on such assumption that all the behaviors as well as behavioral motivations are controllable. Perceived behavioral control acts as a third variable in TBP concept. It shows individual perception about the difficulty or easiness about performing a particular behavior [29]. It is considered that perceived behavior control is verified with the help of total number of accessible control beliefs, or it is also said that persons perceived behavioral control is more stronger, if he feels that he got a lot more opportunities and resources when the difficulties in performing the behavior is less comparatively. Davis [10] proposed the Technology Acceptance Model, TAM to investigate the relationship of perceived emotions factor
with the use of science technology. TAM refers to the acceptance and usage of technology by users. This model basically depends on the Theory of reasoned action, TRA and Theory of planned behavior, TRB [30]. According to TAM two specified beliefs determine the use of computer, one is perceived usefulness and other is perceived ease of use, excluding normative beliefs and subjective norms. Modal argues that users attitudes towards usage of new technology is influenced by the two factors i-e perceived usefulness and perceived ease of use. If users feel that new technology is better for his/her job performance then they will show positive feelings about it, so they will also have positive attitude towards usage of new technology. Such sort of attitudes will also affect the user’s behavioral intension and usage of actual system. Some external variables also influence internal attitudes of users, beliefs and their intensions that further influence TAM [9]. Literature proved that perceived usefulness and perceived ease of use is actually influenced by different external variables. Hong et al. [31] determined that the five external variables may influence individual perception that includes computer's self-efficacy, the relevance and the knowledge of the search domain, the terminology and the screen design. Furthermore, Lewis et al. [32] sort out the external variables in order to include the institutional factor, the individual factor and the social. TAM has been tested across various computer technologies, user populations and organizational settings that have shown very successful results [34]. Most of the scholars have revised the TAM to boost its interpretation abilities. They just not only revised its structure, but have also added external variables and some mediators. While studying the relationships among variables, they have formed much better predicting models [28-32]. In present study revised TAM is used that is proposed by Venkatesh and Davis [33] consists of Perceived Usefulness, Perceived Ease-of-Use and Intention of Use. 2.3. Information system success model proposed by DeLone and McLean [35] developed a multidimensional IS success model, that integrates the model of communication which is created by Shannon and Weaver [36] and information impact theory created by Mason [37]. The revised model comprises of six dimensions of IS success that are interrelated to each other includes system and information quality, user satisfaction, IS use, organization impact and individual impact.
1497
World Appl. Sci. J., 27 (11): 1495-1507, 2013
Different studies have shown that user satisfaction cab be influenced by the system and information quality. There can be direct relationship between the degree of IS use and the degree of user satisfaction directly and indirect relationship with the individual's performance and can affect the whole organization eventually. Pitt et al. [38] revealed that information system success model of DeLone and McLean's did not contain IS service quality measures. They have the view that it is very important to include IS service quality and declare that system, service and information. Agreeing with Pitt et al. [38] on the service quality perspective and by giving references of the arguments of many scholars DeLone and McLean [39] presented an updated IS success model, by including the dimension of service quality into original version. All three Information, system and service quality may affect the two dimensions (interrelated) of IS use and user satisfaction simultaneously or separately though these two dimensions affect net benefits directly. This may also be the 1st time subsequence use that is introduced in order to measure the IS success model [49]. Pakistan is a country of a 160 million dwellers (PCO, 2006), the adult literacy rate of whom is only 53% (Economic Survey, 2006). Access to basic and higher education is a problem persistently posing challenges for the country’s ability to develop its human capital and move in the direction of a meaningful transition to a knowledge-based economy. The particular dearth of a critical mass of IT and ICT-related professionals is of special concern, given the rapid development and growing human resource demand within the Telecom and IT sectors of the country. Within the limited resources of the education budget, which is merely 2.1% of the GDP (op. cit.), relying on conventional means of imparting education will certainly not be enough. Furthermore, the shortage of high quality faculty, expensive higher, especially IT education and dearth of adequate educational facilities compound the problem even further. It is therefore imperative that parallel distance learning programs, designed to take advantage of the technological revolutions in communication and learning methodologies and focused on serving the under-served or time/distance-constrained, must be promoted. The concept of distance learning is not a new phenomenon in Pakistan, where institutions such as Allama Iqbal Open University (AIOU) have been providing for distance education since 1974 [48]. What is new, however, is the way in which digital media and ICTs are shaping the methodology of delivering distance education and adding
efficiency, convenience, interactivity and outreach to learning programs. With appropriate instructional strategies, it has been established that technology integration can lead to cognitive development (Wang, 2005) and it is ‘e-learning environments [-that] provide students with dynamic, interactive nonlinear access to a wide range of information represented as text, graphics, animation, audio and video’ (Kramarski & Gutman, 2006, p.25). Conventionally, a combination of radio, television, prints and f ace-to-face interaction has been the key mode of imparting distance education in the country (Reddi & Mishra, 2005). However, the growing ICT infrastructure in the country, the global changes in distance learning media and mechanisms and most importantly the growing utility of e-learning have set the stage for a re-orientation in the way distance learning is imparted in Pakistan. Unfortunately though, Pakistan has not been able to take advantage of the possibilities offered by e-learning. Of the many reasons behind this status, institutional and technical infrastructure, culture, computer literacy and access are some of the major challenges. Although government’s commitment to promote e-learning in the country is encouraging and initiatives such as the establishment of the Virtual University (VU) are commendable, Pakistan has yet to go a long way in reaping the unique socio-economic benefits of e-learning. Precisely how Pakistan is strategizing to promote e-learning, especially for higher education programs and what are the challenges that she confronts in establishing e-learning as an accepted medium of imparting education, are the central ideas of discussion in this paper. The case-study of a language e-learning platform also helps delve deeper into the project level challenges of e-learning initiatives within the socio-cultural setup of Pakistan. ICT Infrastructure: The past three years have witnessed landmark developments in the field of telecommunications in Pakistan. Since the government deregulated the sector in 2004, a large amount investment flowed in, thereby aiding the development of the much needed technology infrastructure. The sector attracted approximately US$ 2 Billion in foreign and local investment, translating into 54% of the total Foreign Direct Investment in the country (PTA, 2006). This investment has resulted in increasing the cellular subscriber base to 48.5 million and the fixed line / Wireless Local Loop subscriber base to about 5.6 million lines, ensuring service to 33% of the population
1498
World Appl. Sci. J., 27 (11): 1495-1507, 2013
and geographic coverage in over 1250 cities and towns by the end of 2006 (op. cit.). Pakistan already has extensive fiber optic backbone infrastructure operated by the incumbent telecom operator PTCL and new projects and ventures for inland and international submarine fiber optic infrastructure are underway. A project for nationwide wireless broadband voice and data WiMax network in Pakistan is also in the process of being rolled out. In terms of basic and broadband access to Internet, unfortunately, the fruits of telecom sector de-regulation haven’t been fully realized. The Internet subscriber population is 2.4 million with less than 30,000 DSL subscribers across the country. The entire broadband population is less than 50,000 including subscribers who are provided such connectivity by wireless or cable broad band. French Online Distance Learning Program: French Online is an e-learning method for individuals to learn French via the Internet. It was financed and initiated by the French Embassy in Pakistan and developed and run by the Alliance Française (AF) Islamabad, in collaboration with the Commission on Science and Technology for Sustainable Development in the South (COMSATS) and other partner educational institutes. The objective of creating this platform, which commenced in 2003, was to cater to the growing demand for learning French language in areas where formal teaching institutions were not available, or for professionals who were unable to integrate regular classes within their demanding schedules. French Online is a combination of distance and face-to-face learning being offered in 9 cities of Pakistan. Internet allows students to study at their own place and at their own pace, while the custom-designed e-learning platform enables tutors and students to maintain regular contact through a forum, class discussions and email. Moreover a workshop is organized at the end of every module, within the premises of the AF Islamabad or the partner institute, where students get a chance to perfect their pronunciation and practice conversation. French Online is offered to students via institutions as well as independent home/work-based learners (AF, 2006). MATERIALS AND METHODS This study is an ex post facto, non-experimental design. Ex post facto is a quantitative research that explores possible causes and effects. Ex post facto research is used to investigate the relationships between
independent and dependent variables in situations where it is impossible or unethical to manipulate the independent variable [51]. This type of study is very common and useful when using human subjects in real-world situations and the investigator comes in “after the fact” [40]. In this study ex-post facto research will assist in determining the implementation of TMA model in E-Learning Environment in Rural and Urban areas of Pakistan. Ahn et al. [41] used the Technology Acceptance Model to explore the online and offline features of Internet shopping malls and their relationships with the acceptance behaviors of customers. The results show that the external variables which affected the online features included information, service and system quality. Meanwhile, these variables directly influence perceived. Usefulness and perceived ease of use. Davis et al. [42] and Venkatesh and Davis [33] pointed out in relevant researches on Technology Acceptance Model (TAM) that information quality positively affects perceived usefulness, in other words, if the information quality of the knowledge management system is good, the output charts would be correct, the output knowledge would be fruitful and could be reused, thus, users believe the system is capable of providing correct information and knowledge above discussion could be summarize into following hypothesis. H1: There exists a positive relationship between Information quality and user's perceived usefulness. H2: There exists a positive relationship between Service quality and user's perceived usefulness. H3: There exists a positive relationship between Service quality and user's perceived ease of use. H4: There exists a positive relationship between System quality and user's perceived ease of use. H5: There exists a positive relationship between Perceived ease of use and user's perceived usefulness. H6: There exists a positive relationship between Perceived usefulness and user's intention to use. H7: There exists a positive relationship between Perceived ease of use and user's intention to use.
1499
World Appl. Sci. J., 27 (11): 1495-1507, 2013
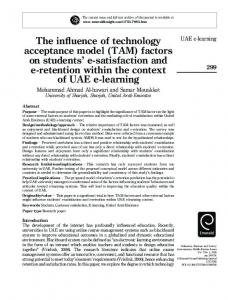
Extracted from:
Fan-yunpai (2011)
Fig. 1: Research framework Sample Selection: The population involved in this study consists of students who enrolled in e-learning process. Convenience sampling is used in this study [50]. Convenience sampling involves drawing elements from a group that is easily accessible and is one of the most commonly used purposive sampling techniques [43]. Data is collected through convenient sample of 400 students enrolled in e-learning from the rural and urban areas of Pakistan. Data Collection Instrument: An intensive study of literature of interest to identity existing measures for related constructs was done to finalize questionnaire. The questionnaire was pilot tested with fifteen students of e-learning. And we conducted face-to-face discussions with these students after they completed the questionnaire. Then questionnaire is modified to refine the survey based on their feedback. Likert Scale is used in this study as it is the most commonly used measure in scale design, with the 3-point and 7-point Likert scales generally enjoying the largest popularities. However, Berdie [44] addresses this questionnaire design in his study and defends the 5-point Likert scale for the following three reasons. First, in most cases, a 5-point Likert Scale is the most reliable measuring method. Once the questions are over five, it is hard for people to distinguish the right point. Secondly, a 3-point Likert Scale depresses people's strongest and mildest
opinion, while a 5-point Likert Scale can express it ideally. Thirdly, a 7-point Likert Scale causes confusion for those people with poor distinguishing ability. Hence, the study adopts the 5-point Likert Scale, with the responses rated as follows: 1 as strongly disagree, 2 as disagree, 3 as somewhat agree, 4 as agree and 5 as strongly agree. RESULTS Among all the respondents, there are only 343 men (85.75%) compared to 57women (14.25%) Total 35% of respondents are from Punjab, 12% from Baluchistan, 29% from Sindh, 24% from KPK. Reliability and Validity Analysis: The reliability of the questionnaire is measured by Cronbach's coefficient alpha ( ). The results from the study show a Cronbach's score of each dimensional scale: information quality at 0.83, service quality at 0.79, system quality at 0.77, perceived usefulness at 0.85, perceived ease of use at 0.91, intention to use at 0.83, while the construct as a whole is at 0.81. This indicates that the questionnaire has the sufficient internal consistency and alpha value is greater than acceptable value of 0.70. Table 1 shows the reliability analysis of each construct. Apart from the above, the study adopts factor analysis to measure the construct validity of the questionnaire, applying KMO value in the factor analysis.
1500
World Appl. Sci. J., 27 (11): 1495-1507, 2013 Table 1: Reliability Analysis Construct
Cronbach Alpha
KMO
0.83 0.79 0.77 0.85 0.91 0.83 0.81
0.78 0.59 0.58 0.81 0.84 0.79 0.76
Information quality Service Quality System Quality Perceived usefulness Perceived Ease of use Intentions to use Overall Table 2: Correlations IQ
SQ
SyQ
PU
PE
IU
Pearson Correlation Sig. (2-tailed) N Pearson Correlation Sig. (2-tailed) N Pearson Correlation Sig. (2-tailed) N Pearson Correlation Sig. (2-tailed) N Pearson Correlation Sig. (2-tailed) N Pearson Correlation Sig. (2-tailed) N
IQ
SQ
SyQ
PU
PE
IU
1
.548** .000 231 1
.406** .000 231 .381** .000 231 1
.384** .000 231 .372** .000 231 .575** .000 231 1
.341** .000 231 .476** .000 231 .443** .000 231 .571** .000 231 1
.396** .000 231 .528** .000 231 .507** .000 231 .461** .000 231 .558** .000 231 1
231 .548** .000 231 .406** .000 231 .384** .000 231 .341** .000 231 .396** .000 231
231 .381** .000 231 .372** .000 231 .476** .000 231 .528** .000 231
231 .575** .000 231 .443** .000 231 .507** .000 231
231 .571** .000 231 .461** .000 231
231 .558** .000 231
231
**. Correlation is significant at the 0.01 level (2-tailed).
Correlation Analysis: To analyze the relationship between variables, matrices of Pearson product moment correlation coefficients are used to measure the related index between variables. Samples to be tested are based on the questions of every construct. As Table shows, factors of e-learning behavior are correlated with each other positively, with each Pearson correlation coefficient ranging from 0.39 to 0.58.
More higher the KMO value is, more correlating factors the variables share, in turn, more appropriate it is for factor analysis. A KMO value above 0.5 justifies the use of factor analysis, it is not fit for factor analysis otherwise [47]. Hence, as Table shows, the KMO value of each variable is above 0.5, indicating each as appropriate for factor analysis as there are some correlating factors among the variables. It also suggests that the questionnaire have sufficient construct validity, as all the factor loadings exceed the acceptable 0.5. Characteristics of Construct: Table 2 demonstrates an average value of every construct variable. In the information system success model, variables include information quality (mean=3.76). Variables include perceived usefulness (mean=3.83), perceived ease of use (mean=3.72) and intention to use (mean=3.67). At the study's conclusion, e-learning system users have responded positively in all the information, service and system qualities, which indicate the models applied in the study are appropriate.
Path Analysis: Most commonly used technique in SEM Programs is estimation of maximum likelihood [43]. This technique is also used to estimate the value of the unknown parameters in model of the thesis. It gives a wide range of the outputs like goodness of fit indices thus providing answers to the questions like weather the model fits or not and to establish the acceptability of the model. [45] has given few indices that will be used to judge the fitness of the model. The model provides an acceptable fit to the data, i.e. the values of CFI, NFI, RMSEA, GFI and AGFI were found according to the cut points in both the measurement models. Model fit was achieved by following an examination of the modification indices.
1501
World Appl. Sci. J., 27 (11): 1495-1507, 2013
Fig. 2: Mean service quality is =3.63 and number of respondent is 231 with standard deviation 0.775
Fig. 3: Mean service quality is 3.63 and number of respondent is 231 with standard deviation 0.941 The standard values of the above mentioned Fitness Indices and values achieved in the research model are mentioned in Table 3. The value of GFI must be equal to or greater than 0.90. The value of AGFI must be equal to or greater than 0.90. The Acceptable rang of NFI is greater than or equal to .90 [45]. The acceptable value or cut off value for CFI is.90 or higher. The acceptable rang for RMSEA changed over the years in fifteen years or so. In early 19th century the range is from 0.05-0.10 and value above .010 is considered
poor fit [45]. RMSEA between .08-.10 is considered as moderate fit [45]. However the most recent cut off points lower limit is considered .05 [46] and upper limit of .07[45] is considered general consensus nowadays. The Acceptable rang of this index is greater than or equal to .90 [46]. In the study of [6] the CFI value is 0.973 which is above the .9 level used by convention. The Root Mean Square Error of Approximation (RMSEA) for their study was .069, which also reveals a very good fit between the model and the data in question. 1502
World Appl. Sci. J., 27 (11): 1495-1507, 2013 Table 3: Model Fitness Fitness Indices
Standard Values
Achieved Values
CFI NFI RMSEA GFI AGFI Chi Square (x2
0.90 0.90 .05-.07 0.90 0.90 Below 3.0
0.973 1.00 .069 .935 .900 1.966
Table 5: Hypothesis results Path Percieved_ease-to-use Percieved_ease-to-use Percieved_ease-to-use Percieved_usefulness Percieved_usefulness Percieved_usefulness Percieved_usefulness intentions_to use intentions_to use