Proceedings of OZCHI 2005, Canberra, Australia. November 23 - 25, 2005. Copyright the author(s) and CHISIG
IMPLEMENTING A WEB-BASED MEASUREMENT OF 3D UNDERSTANDING Ken Sutton The University of Newcastle
[email protected]
Andrew Heathcote The University of Newcastle
[email protected]
Miles Bore The University of Newcastle
[email protected]
ABSTRACT This paper outlines the conversion of a psychometric test to a web-based study. The test measures understanding of three-dimensional (3D) concepts as it applies to technical drawing. We describe the instrument in terms of its subtests and examine implementation and data collection issues. Comments are provided about technical, experimental design, participation and recruitment matters. We report comparisons of reliability and validity measures against a parallel laboratory-based study. Advantages and disadvantages of web-based studies are summarized and the relevance of the instrument to industry is addressed along with considerations for future developments.
KEYWORDS: Web-based Research, 3D Concepts, Spatial Cognition, 3D Measurement.
1.
INTRODUCTION
Conducting research as a web-based activity extends traditional laboratory-based studies. It offers potential to increase sample size, capture a wider demographic and allow a continuous and unsupervised delivery. Steyvers and Malmberg (2003) and Birnbaum (2004) provide evidence that reliability and validity of data from web studies compare favourably with data collected from parallel laboratory studies. This paper reports on the adaptation of a psychometric test of 3D understanding, currently under development, to a web-based setting. 3D understanding is the ability to extract information about 3D properties from 2D representations (i.e., drawings) and is relevant to vocations such as engineering, building construction, architecture and most industrial trades. Future research will address differences between these expert groups after initial development with a novice sample. The psychometric instrument was first tested in a laboratory setting, with results from that setting used to validate the web study. The web study was deployed as a ColdFusion Server project and we discuss some implementation issues.
2.
MEASUREMENT INSTRUMENT
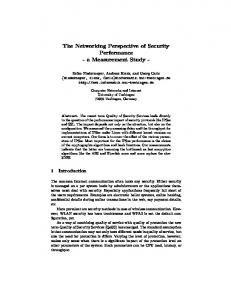
Understanding 3D concepts is an important aspect of technical drawing. Teaching these concepts is often problematic. The overall aim of this project is to develop a measurement instrument that will underpin learning tasks aimed at improving 3D understanding. The measurement instrument consists of 89 items divided into six subtests that measure both accuracy and response time (RT). Five subtests are based on previous psychological research while the sixth subtest assesses understanding of true length, an important concept in technical drawing. We contend that understanding 3D concepts is best measured across a range of tasks requiring different types of spatial reasoning (Blasko, Holiday-Darr, Mace & Blasko-Drabik, 2004). Descriptions of the subtests follow. Examples are shown in Figure 1, in order of description from left to right, and from top to bottom.
Additional copies are available at the ACM Digital Library (http://portal.acm.org/dl.cfm) or ordered from the CHISIG secretary (
[email protected]) 1 ISBN: 1-59593-222-4 OZCHI 2005 Proceedings
2.1 2D-3D Recognition Objects are presented as orthographic and isometric projections. Participants select which of two alternatives of one type matched a standard of the other type (Cooper, 1990; Bertoline & Miller, 1990). Subtests were either A (Orthographic Standard) or B (Isometric Standard).
2.2 Correct Fold Objects are presented as an isometric projection or as an unfolded view. Participants select which of two alternatives of one type matched a standard of the other type (Duesbury & O’Neil, 1990). Subtests were either A (Isometric Standard) or B (Folded Standard).
2.3 True Length Recognition Objects are presented as isometric and orthographic projections. Edges parallel to a viewing plane have their true length in a projection. In one subtest participants decide which projection of a set of orthographic projections shows the true length of a labelled edge in an isometric projection (True Length Recognition A). In another subtest, participants decide which of three isometric projections shows the true length of a labelled edge in a set of orthographic projections (True length Recognition B).
2.4 Mental Rotation Participants decide if a rotated isometric projection of an object matches the isometric projection of a standard or its mirror image (Metzler & Shepard, 1988).
2.5 Possible/ Impossible Structures Participants decide if an isometric projection can represent a 3D object (Schacter & Cooper, 1990).
2.6 Dot Coordinate Participants are shown an isometric projection of a 3D Cartesian coordinate system and a text description of the position of a point in that system. From four orthogonal projections, participants choose the projection that corresponds to the description (Bore & Munro, 2002). 2D-3D Recognition, A
2D-3D Recognition, B
Correct Fold A
Correct Fold B
True Length Recognition A
True Length Recognition B
Mental Rotation
Possible-Impossible Structures
Dot Coordinate
Figure 1: Psychometric Instrument Subtests
2
Participants were presented with onscreen written instructions and explanations. They carried out practice trials to become familiar with the procedure. No feedback in terms of accuracy and RT was given during practice or testing. Recruitment occurred through the web site the study was linked to (Psychological Research on the Net, http://psych.hanover.edu/Research/exponnet.html), and special psychological interest groups. Participants were not included in the analysis if they indicated having technical drawing experience or being under the age of 18. Participants could choose to nominate for a prize draw as a form of reimbursement. Results from 30 web-participants and 41 laboratory participants (tested using parallel implementation in the Superlab software) are reported.
3.
IMPLEMENTATION AND DISCUSSION
An existing laboratory study was adapted to run on a ColdFusion Server platform. As a measure to protect against poor web experimental design, implementation was checked against 16 standards suggested by Reips (2002). To test its reliability and validity, the web-based version needed to be consistent with the laboratory version in terms of design and structure. This imposed restrictions on the programmer. Further, because web-participants would work independently (laboratory participant’s questions were answered by the experimenter), additional instructions and explanations were necessary. Participation in the web study was more demanding in terms of reading and comprehending the test instructions than for the laboratory study. The programmer reported several issues. Because of the need to mirror the laboratory study, this sometimes prevented the use of best practices and options suited to ColdFusion technology. A better approach in the future may be to develop both laboratory and web studies in unison with consideration to both environments. Part of this would include choosing better interface options for participant responses. Another alternative is to run the web study in both environments. Other issues included how to accommodate a variety of end-user connections and making allowances for timing differences due to network bandwidth. The main technical difficulty with the web implementation was caused by use of the back button in the web browser and compilation problems with some participant data. The experimental design resulted in a complex study that might not normally be regarded as suitable for online research. It required dedication from participants who needed to work through detailed instructions and compulsorily complete practice trials before testing began. In contrast to the laboratory study, participants worked in isolation with no supervisory support. Collectively, these factors may have discouraged many potential participants. About 260 entered the demographics section of the study but this reduced to about 80 who actually made a start to the testing phase. This further reduced to 30 who provided complete data. Recruitment was another issue since the measures taken did not attract the sample size hoped for. A review of procedures indicated that promotion was not widespread enough to attract the numbers anticipated. Future studies will investigate other avenues. Despite some difficulties, the study is still active and attracting new participants without any changes to the experimental design. It offers advantages reported earlier and even with low numbers, it is likely to eventually produce a sample size superior to that possible for internal laboratory-based studies.
4.
COMPARISON WITH LAB-BASED RESEARCH
We tested reliability by comparing Cronbach alpha coefficients and validity by comparing mean accuracy and RT between laboratory and web based samples. Results are reported in Table 1. Generally, both laboratory and web-based subtest scores produced acceptable alpha reliability coefficients. Reliability coefficients for the combined subtests indicate high reliability in both laboratory and web-based studies. Significant differences in mean correct answers were found between laboratory and web samples on four of the nine subtests. Participants in the web-based study produced significantly lower total scores than laboratory-based participants.
3
Table 1: A Comparison of Web-based and Laboratory-based Results Subtests 2D-3D Recognition – A 2D-3D Recognition – B Correct Fold – A Correct Fold – B True Length Recognition – A True Length Recognition – B Mental Rotation Poss/Impossible Structures Dot Coordinate All Tests Combined
Web-Based Study Accuracy RT 75 (.68) 22 (.76) 79* (.79) 18 (.74) 51* (.42) 21 (.69) 67 (.57) 16 (.78) 74 (.89) 12 (.76) 70 (.80) 19 (.70) 81* (.62) 7* (.83) 78* (.83) 7* (.88) 40 (.92) 22 (.94) 70* (.96) 13 (.95)
Laboratory Study Accuracy RT 82 (.09) 21 (.69) 92* (.48) 17 (.82) 72* (.38) 25 (.56) 75 (-.02) 23 (.51) 85 (.80) 11 (.68) 81 (.54) 20 (.50) 90* (.61) 5* (.60) 88* (.74) 3* (.84) 53 (.82) 29 (.74) 80* (.90) 17 (.87)
Accuracy (% correct) and RT (sec) for correct responses, with Cronbach alpha reliability coefficients in brackets. A * indicates a significant (p