The model can be set up to operate with a maximum of 12 cells. (reactors) in .... For biofilm layers bn 5 b2 to bnd21 , where bnd is the deepest layer of biofilm ...
Improved Computational Model (AQUIFAS) for Activated Sludge, Integrated Fixed-Film Activated Sludge, and Moving-Bed Biofilm Reactor Systems, Part II: Multilayer Biofilm Diffusional Model Dipankar Sen1*, Clifford W. Randall2
ABSTRACT: Research was undertaken to develop a diffusional model of the biofilm that can be applied in lieu of a semi-empirical model to upgrade an activated sludge system to an integrated fixed-film activated sludge (IFAS) or moving-bed biofilm reactor (MBBR) system. The model has been developed to operate with up to 12 cells (reactors) in series, with biofilm media incorporated to one or more of the zone cells, except the anaerobic zone cells. The values of the kinetic parameters for the model were measured using pilot-scale activated sludge, IFAS, and MBBR systems. The biofilm is divided into 12 layers and has a stagnant liquid layer. Diffusion and substrate utilization are calculated for each layer. The equations are solved simultaneously using a finite difference technique. The biofilm flux model is then linked to the activated sludge model. Advanced features include the ability to compute the biofilm thickness and the effect of biofilm thickness on performance. The biofilm diffusional model is also used to provide information and create a table of biofilm yields at different substrate concentrations that can be used in the semi-empirical model. Water Environ. Res., 80, 624 (2008). KEYWORDS: modeling, biofilm, integrated fixed-film activated sludge, moving-bed biofilm reactor, activated sludge, AQUIFAS, dynamic simulation, model development. doi:10.2175/106143008X268434
Introduction Biofilm models have been developed and applied for biofilm systems that operate with very low mixed liquor suspended solids (MLSS) concentrations. This allows such models to ignore the contribution of the biomass in the MLSS. One of the alternatives being implemented for nitrogen removal upgrades is the addition of biofilm carrier particles (media) in existing or new activated sludge tanks, in addition to continuing to operate with a significant MLSS concentration (.1000 mg/L). The plant continues to operate with return activated sludge and is defined as an integrated fixed-film 1
Santa Clara Valley Water District, San Jose, California.
2
Department of Civil Engineering, Virginia Tech, Blacksburg, Virginia.
*1290 Bryant Avenue, Mountain View, CA 94040; e-mail: dsen@ valleywater.org. 624
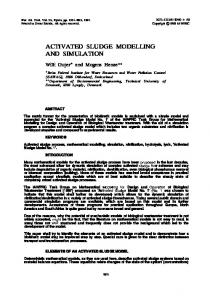
activated sludge (IFAS) system. Figure 1 shows how this can be done with fixed- or moving-bed media to increase the rates of chemical oxygen demand (COD) removal and nitrification. This paper presents the structure of a diffusional model of the biofilm (biofilm diffusional model), which can be run with the activated sludge model. It can be run in lieu of or to complement the analysis performed with a semi-empirical model (Sen and Randall, 2008a, 2008b). The model can be operated for steady-state and dynamic simulations. The dynamic simulation provides information on the variation in effluent quality, based on hourly, daily, weekly, or monthly changes in the influent loadings and recycle rates, including changes in loadings from solids dewatering. Literature Review The modeling of biofilm in activated sludge or MBBRs can be performed at different levels of complexity. The combination of removals in the mixed liquor and the biofilm makes the integrated model relatively more complex than activated sludge modeling. Further, the modeling of IFAS is more complex than ‘‘pure’’ biofilm systems, such as MBBRs, where it can be assumed that, for lowstrength wastewaters, the mixed liquor volatile suspended solids (MLVSS) is so low that there is very little removal of COD, nitrification, and denitrification by the suspended solids (Figure 1d). Sen and Randall (2008a) presented semi-empirical equations to model the biofilm. These equations were based on kinetics of COD uptake, nitrification, and denitrification by the biofilm carrier particles, as measured under different substrate conditions within the length of an IFAS and MBBR reactor. The equations incorporated an additional Monod expression to simulate the variation in substrate uptake rates, as a result of changes in external substrate concentrations, and the associated changes in the biofilm thickness and fraction of nitrifiers in the biofilm that develops along the length of a multicell reactor. Wanner et al. (2006) presented a set of equations for the biofilm that can be solved analytically. The analytical approach simplifies the set of differential equations, but requires more assumptions, such as knowledge of the rate-limiting substrate in each cell within a reactor. Also, it assumes knowledge of the limiting substrate in the Water Environment Research, Volume 80, Number 7
Sen and Randall
sludge model and used in lieu of flux rates computed by the semiempirical equations (Sen and Randall, 2008a). Sloughing can take place off the outermost biofilm layer and/or from the breakage of biofilm off the innermost layer. The rate of sloughing (biofilm yield for heterotrophs and nitrifiers) in each cell is based on the following: (1) Shear forces imparted by mixing and roll pattern; (2) Design of the biofilm carrier particle (media); and (3) Substrate and electron acceptor levels (i.e., COD, dissolved oxygen, NH4N, and NOxN levels in each cell).
Figure 1—Plant configurations.
layers within the biofilm (Harremoe¨s, 1978; Rittmann and McCarty, 1981). Bae and Rittmann (1996) presented examples where this could be extended to multiple limiting substrates. The numerical 1dimensional model relaxes these assumptions further (Reichart, 1998a, 1998b [AQUASIM 2.0]). The 1-dimensional model can be extended to multiple dimensions. Some researchers treat the length of a reactor or multicell reactor as the second dimension (also referred to as a pseudo 2 d). Others treat the spatial diversity within the biofilm as a second dimension, wherein the biofilm is allowed to grow and cover more of the media surface (Picioreanu, 1999). There is recognition that the concepts of 2-dimensional modeling are important in IFAS and MBBR media systems. For example, when plastic cylinders are used as biofilm carriers, an increase in the thickness of the biofilm can lead to loss in specific surface area on the inside surface of the plastic cylinders. For the same level of mixing, the biofilm thickness increases with the bulk liquid COD concentration. This loss in surface area may be partially compensated for (up to a certain concentration of COD in the bulk liquid) by the increase in biofilm surface area on the outer surface (Sen, Randall, Copithorn, Huhtamaki, Farren, and Flournoy, 2007).
Model Development In the biofilm diffusional model, the biofilm is broken up into 12 layers and a stagnant liquid layer. The flux rates occur because of diffusion between layers; COD, ammonium-nitrogen (NH4N), dissolved oxygen, and oxidized nitrogen (NOxN) utilization in each layer; and biomass and inert suspended solids (inerts) generation and decay in each layer. A finite difference technique is used to compute the flux rates. The flux rates are linked to the activated July 2008
An algorithm is included to compute biofilm thickness based on substrate and electron acceptor conditions in the mixed liquor in each cell and the intensity of mixing. The equations to compute the COD removal, NH4N removal (biomass uptake for synthesis and nitrification), and denitrification were developed based on Monod process kinetics. The removals by suspended solids in each cell of a multicell reactor are computed as per the International Water Association (London, United Kingdom) activated sludge model (International Water Association, 2000) and are dependent on the concentrations of suspended solids, biodegradable soluble COD (SCOD), NH4N, and dissolved oxygen. Additional removal resulting from biofilm in the IFAS and MBBR is computed based on removal rates per unit of surface area of biofilm multiplied by the surface area of biofilm in each cell. The equations showing the mass balance in each cell are presented in Sen and Randall (2008a). The model can be set up to operate with a maximum of 12 cells (reactors) in series. Influent and recycles can be fed to and removed from any cell. Biofilm support media can be installed in one or more cells. Each cell can be operated with or without aeration, as part of an anaerobic, pre- or post-anoxic, aerobic, or reaeration zone. For the unaerated cells, the model computes the dissolved oxygen and NOxN. This is compared with user-specified thresholds for aerobic, anoxic, and anaerobic conditions, to determine whether aerobic, anoxic, or anaerobic decay rates of biomass should be used for each cell. Modeling the Biofilm Using a Diffusional Model. In the biofilm diffusional model, one determines the volatile suspended solids (VSS) generated in each layer of the biofilm based on the substrate and electron acceptor conditions in the layer. The model computes the biofilm fluxes (jF) of COD, dissolved oxygen, biomass (VSS and inerts), and NOxN from one layer (dz) to the next and integrates the values over the thickness of the biofilm (LF), as follows: jF ¼
Z
LF
rF dz ¼ DF
0
@S @2S ¼ D 2 þ rF @t @z
dS dz
j
LF
ð1Þ ð2Þ
Where DF 5 diffusion coefficient of substrate S inside the biofilm (cm2/d or m2/d), and rF 5 rate of transformation of the substrate in a biofilm layer inside the biofilm (mg/cm3/d or kg/m3/d). Equation 2 shows a dynamic simulation, where the substrate conditions vary with time. For a steady-state simulation, the left side of eq 2 5 0. The biofilm diffusional model (biofilm 1- or 2-dimensional) determines the VSS generated in each layer of the biofilm, based on 625
Sen and Randall
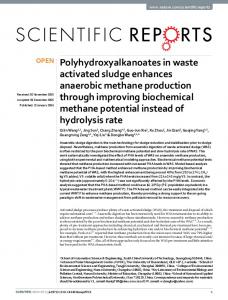
the substrate and electron acceptor conditions in the layer. Also, it determines the biofilm flux of COD, dissolved oxygen, biomass (VSS and inerts), and NOxN from one layer to the next. The flux from one concentric layer to the next deeper layer is the net of uptake and release in the layer and the flux from the concentric outer layer to this layer. For the VSS, the yield in each layer decreases with dissolved oxygen and NOxN levels inside the biofilm. Therefore, the biomass yield for the biofilm decreases as its thickness increases. Based on this principle, the innermost layer of biofilm is the layer at which the total thickness of the biofilm reaches a point where the VSS flux computed by the model begins to drop below the biomass yield for the biofilm that is observed in full-scale applications. This condition defines the thickness of the biofilm. One should note that the VSS flux for the biofilm is the sum total of biofilm flux from the surface layer (surface shearing) and from the breakage (sloughing) of ‘‘chunks’’ of the biofilm. The breakage occurs periodically from the inner layer. When the shearing from the surface layer is set to zero, all of the biomass yield (generation) from the biofilm is from the periodic breakage from the inner layers. For the biofilm to be stable (not increase or decrease in thickness over time), the rate of breakage off the innermost layer equals the biofilm flux generated. The following section discusses the equations for modeling the conditions inside the biofilm. This is also shown in Figure 2. The equations are presented for NH4N. The biofilm flux for NH4N, computed using the diffusional model, substitutes for biofilm flux computed by the semi-empirical approach (Sen and Randall, 2008a). The complete set of eqs 1 to 47 are given in Sen and Randall (2008a). Ammonium-Nitrogen. Equation 3 shows the NH4N flux rate across a layer of biofilm (in mg/cm2/d), as follows: DNF DNF ½SNbn�1 � SNbn � ¼ ½SNbn � SNbnþ1 � Lbn Lbnþ1 þ ðN uptake � N releaseÞbn
ð3Þ
DNF 5 rate of diffusion of NH4N in the biofilm (cm2/d); Lbn 5 thickness of biofilm layer, n (cm); Nbn 5 NH4N concentration in biofilm layer, bn (mg/cm3 or mg/L); Nuptake,bn 5 nitrification and heterotrophic synthesis in biofilm layer, bn (mg/cm2 of biofilm surface/d); and Nrelease,bn 5 decay of biomass in biofilm layer, bn (mg/cm2 of biofilm surface/d). The units can be converted to kg/1000 m2/d by multiplying the flux rates in mg/cm2/d by 10. For the stagnant liquid layer (boundary layer outside the biofilm), the equation takes the following form: ð4Þ
Where DNL 5 rate of diffusion of NH4N in bulk liquid and stagnant liquid layer (cm2/d). DNF 5 rate of diffusion of NH4N in the biofilm (cm2/d or m2/d). Because of resistance by the biomass, its value is 75 to 80% the rate in the bulk liquid. 626
For biofilm layer 1, bn 5 b1. The equation takes the following form: DNF DNF ½SNsL � SNb1 � ¼ ½SNb1 � SNb2 � Lb1 Lb2 þ ðN uptake � N releaseÞb1
ð5Þ
For biofilm layers bn 5 b2 to bnd21 , where bnd is the deepest layer of biofilm, the equation takes the following form: DNF DNF ½SNbn�1 � SNbn � ¼ ½SNbn � SNbnþ1 � Lbn Lbnþ1 þ ðN uptake � N releaseÞbn
ð6Þ
For the deepest layer bn 5 bnd (bnd is the deepest layer of the biofilm), assuming a nonporous media surface, as observed with plastic and cord media, the equation takes the following form: DNF ½SNbnd�1 � SNnd � ¼ ðN uptake � N releaseÞbnd Lbnd
ð7Þ
The NH4N uptake (mg/d) by biofilm in cell n (BFN,n), of the IFAS or MBBR system, is computed as follows: BFNn ¼
DNL ½SNn � SNsL �½biofilm surface area in cell n� LsL
ð8Þ
Where SNn 5 NH4N level in the bulk liquid in cell n (mg/cm3).
Where
DNL DNF ½SNn � SNsL � ¼ ½SNsL � SNb1 � LsL Lb1
LsL and Lb1 5 thickness of the stagnant liquid layer and the biofilm layer 1 (cm or m), respectively. SNsL 5 NH4N level at the interface of the stagnant liquid layer and biofilm layer 1 (b1) (mg/cm3 or kg/m3). SNn 5 NH4N concentration in cell n of the multicell reactor (mg/cm3 or kg/m3).
For eq 8, the biofilm surface area in cell n is in cm2. The value of BFn,N is converted to units of kg/d and substituted for Bn,N and Dn,N in eq 8 of the IFAS-MBBR model (Sen and Randall, 2008a). Therefore, the flux computed using the biofilm 1or 2-dimensional mechanistic model substitutes for fluxes computed using the semi-empirical equations. Thus, the mechanistic model operates within the multicell model. BFN;n converted to kg=d ¼ BN;n þ DN;n
ð9Þ
To run the model, the user has to specify the following: (1) Diffusion coefficients for the liquid and in the biofilm at temperature T, (2) Thickness of the stagnant liquid layer, and (3) MLSS of the biofilm. The thickness of the biofilm in each cell is computed using an algorithm presented below. It is recommended that the outermost layers of the biofilm, where the transformations are faster, be simulated as thinner layers compared with the inner layers. Also, it is important that the IFAS and MBBR model be designed in a manner that it guides the user through the selection of biofilm thickness for each cell. The thickness is a function of bulk liquid substrate and electron acceptor concentrations, media design, and mixing (turbulence). The bulk liquid concentration in a cell is a function of influent strength, recycle rates, and size and number of cells. For the same media and mixing intensities, the thickness will vary from cell 1 to cell n in Water Environment Research, Volume 80, Number 7
Sen and Randall
Figure 2—Schematic of dissolved oxygen, NH4N, and NOxN profiles inside the biofilm.
a multicell reactor. The best source of thickness of biofilm on the media is data from similar wastewater treatment plants operating with the same media. The SCODbio, dissolved oxygen, and NOxN concentrations in the bulk liquid are required for the computations. These are determined by linking the multilayer diffusional model of the biofilm to the multicell model discussed in Sen and Randall (2008a). The fraction of nitrifiers in the first biofilm layer (fnitr,bn51) must be specified based on measurements (Downing and Nerenberg, 2007) or computed. The model allows the user to use one of two methods for computing fnitr,bn51, as discussed below. In eqs 5 to 7, the NH4N uptake by the biomass in a biofilm layer bn (Nuptake,bn ) is the sum of uptake in cellular synthesis (DN,bn) and nitrification in the layer, as follows: Nuptake;bn ¼ DN;bn þ NH4 Nu;Nitr;bn DN;bn ¼ fN ½ðCODu;aer;bn ÞðYH;aer Þ þ ðCODu;anx;bn ÞðYHanx; Þ�
ð10Þ ð11Þ
Nuptake,bn 5 uptake (mg/cm2 of biofilm surface/d), and and CODu,anx,bn 5 COD used aerobically and anoxically in layer bn.
The structure of the equations for COD removal in layer bn is similar to eqs 22 and 23 for the MLVSS presented in Sen and July 2008
CODu;aer;bn ¼ qm;H;aer;bfd
DObn KH;DO;bfd þ DO
SCODbio;bn Lbn ð1 � fNitr;bn Þ MLVSSbn KH;S;aer;bfd þ SCODbio;bn
ð12Þ
Where MLVSSbn 5 MLVSS of layer bn (mg/cm3), and Lbn 5 thickness of layer bn (cm). In eq 12, the subscript bfd signifies coefficients for the biofilm diffusional model. This is important because measurements in pilot studies (Sen, 1995) showed that certain parameters, such as the maximum COD utilization rate, can be different for biomass in biofilm compared with the MLVSS. In eq 10, the nitrification in layer bn is computed as follows: NH4 Nu;Nitr;bn ¼ qm;NH4N�Nitr;bfd
Where
CODu,aer,bn
Randall (2008a), with BVF set to 0. The aerobic COD uptake in layer bn is as follows (units of mg/cm2 of biofilm surface/d):
DObn KN;DO;bfd þ DO
NH4 Nbn Lbn fNitr;bn MLVSSbn KN;bfd þ SCODbio;bn
ð13Þ
The MLVSS is computed based on the value of biofilm MLSS selected by the user and the fraction of VSS in layer bn computed by the model. The MLSS can be determined by measuring the thickness of the biofilm and the weight of growth per carrier 627
Sen and Randall
particle. The values reported in the literature range from 5000 to 50 000 mg/L MLSS (Boltz et al., 2008; Wanner et al., 2006). The lower end of the range has not been observed in MBBR and IFAS systems treating primary effluent. The biofilm in IFAS and MBBR systems with plastic carrier particles (as at Broomfield, Colorado, operated with Kaldnes Miljøteknologi K1 carriers) is between 10 000 and 15 000 mg/L. Values between 25 000 and 50 000 mg/L are observed in Captor sponge systems (Fairfield, Connecticut; Sen, 1995), where the growth is protected from shear inside the sponge. The growth ranged from 50 to 200 mg (average of 100 mg) just inside the sponge. It had a surface area of 22.5 cm2 and a thickness of 1 to 2 mm. Because of the wide range of numbers, it is recommended that the biofilm MLVSS be measured from full-scale MBBRs and IFAS systems. The computation of percent of VSS and inerts and their fluxes is performed using a series of equations similar to those for NH4N. The interdependencies between the equations for biomass, COD, NH4N, dissolved oxygen, and NOxN are similar to those shown for the semi-empirical version of the IFAS model discussed above. In eq 13, fnitr,bn is computed for each layer of the biofilm. Unlike the complete-mix system, in which fnitr does not change much along the series of reactors (cells) in series, fnitr,bn can change substantially from one layer to the next within the biofilm. In eqs 5 to 7, Nrelease,bn (mg/cm2 of biofilm surface/d) is computed as follows: Nrelease;bn ¼ ðfN ÞðkdH;EA;T MLVSSbn Lbn Þ=1000
ð14Þ
Where kdH,EA,T is selected based on the dissolved oxygen and NOxN level in layer bn compared with the aerobic and anoxic thresholds for dissolved oxygen and NOxN that are specified by the user. Chemical Oxygen Demand, Biomass (Volatile and Total Suspended Solids), Dissolved Oxygen, and Oxidized Nitrogen. The equations for COD, biomass (VSS and inerts), dissolved oxygen, and NOxN fluxes are similar to eqs 3 to 8 for NH4N. Biofilm Thickness, Growth, and Fraction Nitrifiers. For the biomass flux, the user can specify the rate at which biofilm is sheared off the outer layer. If this equals zero, all of the biomass flux is assumed to result from periodic breakage (sloughing) of the biofilm off an inner layer. Sloughing can take place off the outermost biofilm layer and/or from breakage of biofilm off the innermost layer. The rate of sloughing and the biofilm yield for heterotrophs and nitrifiers in each cell are dependent on the following: (1) Shear forces imparted by mixing and roll pattern; (2) Design of the biofilm carrier particle (media); and (3) Substrate and electron acceptor levels (i.e., COD, dissolved oxygen, NH4N, and NOxN levels in each cell). The biofilm thickness is a function of the substrate concentration in the bulk liquid (mixed liquor), average MLVSS of the biofilm, and shear forces. An algorithm was developed for biofilm thickness based on observations of growth on media in different cells within full-scale IFAS systems (Broomfield, Colorado; Port Neuf, Quebec; and Annapolis, Maryland). The algorithm is as follows:
Algorithm to compute biofilm thickness if NO3N . 0.5, then Thickness 5 Multiplier for Anoxic Thickness * [if SCODbio * NO3N) . 50, 50, (SCODbio * NO3N)] * 10,000/MLVSS (NH4N , 0.25, 4 * NH4N, 1)/Shear Factor if DO . 1, then Thickness 5 Multiplier for Aerobic Thickness * [if (SCODbio * DO) . 50, 50, (SCODbio * DO)] * 10,000/MLVSS * if (NH4N , 0.25, 4 * NH4N, 1)/Shear Factor Max Aerobic Thickness at (SCODbio 3 DO) of Max Aerobic Thickness at (SCODbio 3 NO3N) of Multiplier for aerobic thickness Multiplier for anoxic thickness
50 50 0.1 0.05
Shear factor for aerobic
4
Shear factor for anoxic
2
The algorithm allows biofilm thickness to increase in the aerobic cells with the SCODbio and dissolved oxygen concentration up to an upper limit (value of 50 for SCODbio 3 NOxN, with SCODbio and NOxN expressed in units of mg/L). In the anoxic cells, the biofilm thickness increases with SCODbio and NOxN in the anoxic cells up to its upper limit. The upper limit is based on experiences with municipal wastewater treatment systems with primary effluent COD concentrations less than 500 mg/L. This limit may have to be relaxed for industrial wastewater treatment systems that have higher organic concentrations. The formula is standardized to a biofilm MLVSS of 10 000 mg/L. The thickness increases inversely in proportion to the MLVSS of the biofilm. The multiplier for anoxic thickness will decrease based on the ratio of lm,anx to lm,aer. If the lm,anx for biofilm MLVSS is much lower in the post-anoxic cell than in the pre-anoxic cells, the thickness will be less. This is consistent with the observations at the pilot study for the Mamaroneck 628
* if
(umhanx/umhaer) * multiplier for aerobic thickness; will vary with umH from preanoxic to post anoxic Values range from 1 to 5 for aerobic. Increase with turbulence Values range from 0.5 to 2.5 for anoxic; function of mixing and liquid velocities relative to aerobic zone
Wastewater Treatment Plant (Johnson et al., 2007). The algorithm has been evaluated against the thickness observed at the Broomfield, Colorado, full-scale IFAS plant (Sen, Phillips, Murthy, Pattarkine, Copithorn, Randall, Schwinn, and Banerjee, 2007). The shear factor in aerobic cells varies from 1 to 5. It is 1 for systems with low mixing or a media whose design is conducive to the development of a thick biofilm. It is 5 for systems with very vigorous mixing and an open media structure (such as the Agar media [Aqwise Wise Water Technologies, Herzliya, Israel], which has rings instead of a cylinder). Typically, the shear factor applied to the anoxic cells is one-half of the value applied to the aerobic cells. This can be based on measurement of the velocity of the media along the surface of the tank relative to the velocity measured in the aerobic cells (this is done by measuring the time the media takes to move from point A to B along the surface of the aerobic and anoxic cells). Finally, the formula adjusts the thickness when NH4N Water Environment Research, Volume 80, Number 7
Sen and Randall
Table 1—Coefficients for biofilm diffusional model. Values were used to simulate the results from the pilot studies (Sen, 1995). The model is structured such that the user can change these values based on other observations. Diffusion Rates
Substrate
Temperature (8C)
Value Units 2
DS,L DN,L DDO,L DNO2,L DNO3,L DS,L
Acetate in water NH4N in water Dissolved oxygen in water NO2N in water NO3N in water Acetate in water
20 20 20 20 20 12
1.09 cm /d 1.2 cm2/d 1.6 cm2/d 1.4 cm2/d 1.4 cm2/d 0.82 cm2/d
DN,L DDO,L DNO2,L DNO3,L DS,F DN,F DDO,F DNO2,F DNO3,F
NH4N in water Dissolved oxygen in water NO2N in water NO3N in water Acetate in biofilm NH4N in biofilm Dissolved oxygen in biofilm NO2N in biofilm NO3N in biofilm
12 12 12 12 12 12 12 12 12
0.90 1.42 1.05 1.05 0.65 0.72 1.14 0.84 0.84
concentrations in a cell drop below 0.25 mg/L. This is to simulate thickness of biofilms that are starved of NH4N. Additionally, the biofilm develops up to a thickness at which the biofilm yield, as computed for the thickness calculated, is equal to values of observed yield. For the same substrate and electron acceptor levels, the biofilm yield decreases as the biofilm thickness increases. Therefore, the biofilm cannot increase beyond a thickness for which its computed yield drops below the observed yield. This relationship is used to check the validity of the shear factor. The biofilm 1-dimensional model computes the biomass flux (heterotroph 1 nitrifier flux) in each cell for the biofilm thickness. The thickness and biomass flux are then used to compute a biofilm mean cell residence time (MCRT), as follows: Biofilm MCRT ¼ ðLF ÞðXF Þ=Biomass flux per day
July 2008
Perry and Chilton (1973) Chen et al. (1989) Williamson and McCarty (1976) Williamson and McCarty (1976) Williamson and McCarty (1976) 75% of value at 208C, as shown above (Perry and Chilton, 1973) 75% of value at 208C based on ratio of solubilities at 20 and 128C 75% of value at 208C 75% of value at 208C 80% of value for water (Chen et al., 1989) 80% of value for water 80% of value for water 80% of value for water 80 % of value for water
concentrations of SCODbio, dissolved oxygen, and NH4N in the cell bulk liquid. The fnitr,b1 influences the fluxes of nitrifiers and substrates into the deeper layers and therefore influences the fnitr,bn computed for each of the deeper layers. Equation 17 shows one method of computing fnitr,b1 based on the relative rates of growth and yield of nitrifiers and heterotrophs in each layer. It is based on the relative growth rates of nitrifiers and heterotrotrophs. Monod kinetics are used to adjust the rates of growth, which are influenced by the electron acceptor and substrate levels. The default values of the kinetics coefficients are defined in Table 2. For Nitrosomonas in layer b1, the growth rate would be computed as follows: Ng;Nitr1;b1 ¼ qm;NH4 N�Nitr;bfd SO2b1 SNb1 KN;DO;bfd þ SO2b1 KN;bfd þ SNb1
ð16Þ
Based on operating experience with various MBBR and IFAS plants, it is recommended that the cells be operated with sufficient mixing to control the thickness and maintain a biofilm MCRT of 10 to 80 days. If the biofilm MCRT computed is higher, it is likely that the thickness computed is higher than the observed thickness. In this instance, the shear factor may have to be increased. If the biofilm MCRT is lower than 10 days, it is likely that the thickness computed is lower than the observed thickness. In designing a new plant, if the shear factor is reasonable and the model indicates a high thickness, there may be some risks that the biofilm thickness may become excessive and the media may plug up (with associated loss of surface area). The plant design may have to be refined by increasing the mixing, adding more media for the load treated, increasing the size of the first cell (to reduce its SCODbio), or changing the media to a larger diameter. Ultimately, through modeling, the user should be able to design a process that results in thickness similar to those observed in successful pilot- and full-scale studies. For the purposes of design, it is also helpful if the manufacturer of the media can provide a database that contains information on the thickness of biofilm that develops at various substrate and electron acceptor concentrations (SCODbio, NH4N, dissolved oxygen, and NOxN) from facilities where the media is performing satisfactorily. One challenge in modeling the biofilm is the initial estimate of fnitr in biofilm layer 1 (fnitr,b1). The fnitr,b1 can vary with the
cm2/d cm2/d cm2/d cm2/d cm2/d cm2/d cm2/d cm2/d cm2/d
Source
ð17Þ
The growth rate for Nitrobacter can be set equal to Nitrosomonas or computed using the NO2N concentration and the maximum growth rate and half-saturation constants for Nitrobacter. Equation 17 may also be expressed in terms of growth rate of ammonia-oxidizing bacteria (AOB) instead of Nitrosomonas. The growth rate for heterotrophs is computed as follows: SO2b1 SCODbio;b1 KH;DO;bfd þ SO2;b1 KH;S;aer;bfd þ SCODbio;b1 SNOxNb1 SCODbio;b1 þ qm;H;anx;bfd KH;DO;bfd þ SNOxNbn KH;S;aer;bfd þ SCODbio;b1 KH;DOi;bfd ð18Þ KH;DOi;bfd þ SO2;b1
Hg;b1 ¼ qm;H;aer;bfd
The fraction of nitrifiers in layer b1 is computed as follows: fNitr;b1 ¼ qm;NH4 N�Nitr;bfd
Ng;Nitr1;b1 þ Ng;Nitr2;b1 Ng;Nitr1;b1 þ Ng;Nitr2;b1 þ Hg;b1
ð19Þ
Where Ng,Nitr2,b1 5 growth rate of Nitrobacter or nitrite-oxidizing bacteria (NOB) in biofilm layer b1. 629
Sen and Randall
Table 2—Coefficients for biofilm diffusional model. Heterotrophs
Temp. (8C)
Value measured
12 12 12 12 12 12
2.56 6.38
Default Units
Reference
Aerobic um,H,aer,bfd qm,H.aer,bfd YH,aer kdH,aer KH,S,aer,bfd KH,DO,bfd
Max growth rate Max substrate util rate Yield Decay rate Half sat constant Half sat constant
35
2.56 mg VSS (mg COD � d)21 6.38 mg COD (mg VSS � d)21 0.41 mg VSS (mg COD)21 0.042 day21 48 mg/L COD 1 mg/L dissolved oxygen
Note d
Anoxic Denitrification kinetics for biofilm from preanoxic zone um.H,anx,bfd qm,H,anx,bfd
Max growth rate Max substrate util rate
1.25 mg VSS (mg COD � d)21 4.2 mg COD (mg VSS � d)21
12 12
Denitrification kinetics for biofilm from aerobic zon um.H,anx,bfd qm,H,anx,bfd YH,anx kdH,anx KH,S,anx,bfd KH,DO,i,bfd KH,NO3N,bfd
0.375 1.25 0.30
1.25 mg VSS (mg COD � d)21 4.2 mg COD (mg VSS � d)21 0.31 mg VSS (mg COD)21 0.028 day21 48 mg/L COD 0.25 mg/L dissolved oxygen 1.0 mg/L NO3N
Max growth rate Max substrate util rate Yield Decay rate Half sat constant Half inhibition constant Half sat constant
12 12 12 12 12 12 12
Decay rate
12
0.018 day21
12
0.33 mg VSSNitr1 (mg NH4N � d)21 6.62 mg NH4N (mg VSSNitr1 � d)21 0.05 mg VSSNitr1 (mg NH4N)21 0.023 day21 1 mg/L NH4N 1 mg/L dissolved oxygen 0.12 mg-N/mg VSS 1.42 mg COD/mg VSS
54
Note d Note d
Anaerobic kd Autotrophs Nitrosomonas, N1, or ammonia-oxidizing bacteria um,NH4N-nitr,bfd qm,NH4N-nitr,bfd YN1 kdN1 KN,nitr,bfd KDO,nitr,bfd fN fCOD
Max growth rate Max substrate util rate Yield for N1 Decay rate Half sat constant Half sat constant Nitrogen content of biomass COD content of biomass
12 12 12 12
Note c
Note d Note d
a
Unless mentioned, these values were determined from continuous-flow bench-scale pilot studies operated in activated sludge, IFAS, and MBBR modes (Sen, 1995). The biofilm biomass was removed from the biofilm (squeezed and scraped off), put into suspension in a jar, and tests were run similar to MLVSS from activated sludge systems. b The model is structured so that the modeler can use observed values instead of the default values for kinetic coefficients and h when observed values are available. c The value of 0.33 day21 is determined by applying h 5 1.05 to um,N1 of 0.625 day21 computed at 258C, Table 1 (Sen and Randall, 2008a). Weiss et al. (2005) determined a value of 1.047 for biofilm in MBBRs. 0.625 5 (0.33) (1.05)(25-12) d Literature referenced: Barker and Dold (1997), Marais and Ekama (1976), Randall et al. (1992), and Wentzel et al. (1991).
Alternatively, the model allows the user to select a second method for computing fnitr,b1 at various concentrations of SCODbio, dissolved oxygen, and NH4N in the bulk liquid. This method uses a Microsoft Excel data table function (Microsoft Corporation, Bellevue, Washington). By using the data table function, one is able to evaluate the range of initial guesses of fnitr,b1. For those initial guesses for which the computed values of fnitr,b1 are below the initial guess, the initial guess is too high. For those initial guesses where the computed value of fnitr,b1 is higher than initial guess, the initial guess is too low. This allows the user to zoom in on the fnitr,b1 for which the initial guess is reasonably equal to the computed value. This method results in values of fnitr,bn that are close to those observed by Downing and Nerenberg (2007). Tables 1 and 2 provide lists of default values of kinetics coefficients. While these values have worked well in full-scale verifications (Sen and Randall, 2008b), the user has the flexibility to change 630
them as part of the model calibration. Tables 3 and 4 summarize the equations for the MLSS and biofilm in a matrix format. Model Analysis and Verification The results from steady-state and dynamic simulation using the biofilm diffusional model are presented in Sen and Randall (2008b). The model was verified in steady-state against the results observed from the pilot studies. The effluent quality was also evaluated against actual plant data and the results of the semi-empirical model. This was done by running both models with several 31-day periods of daily data from the IFAS plant at Broomfield, Colorado. The model’s predictions of MLVSS and MLSS in the reactor; effluent quality (SCOD, nitrogen forms, and phosphorus); and day-to-day variation in nitrogen forms, biofilm thickness, and amount of growth on the media in the two IFAS cells in series were similar to those observed at the plant. Water Environment Research, Volume 80, Number 7
Sen and Randall
Table 3—Matrix showing equations for heterotrophs and the interrelationship of kinetic coefficients for the mixed liquor in each cell of reactor (X 5 MLVSS). XN SS SN SO2 (dissolved XH (X[12fnitr]) (X fnitr) (SCODbio) (NH4N) oxygen) Heterotrophs using dissolved oxygen
1
Heterotrophs using NO3N
1
21 YHaer
2fN
Kinetic expression for cell n (n 5 cell number in multicell reactor)
SNO3N (NO3N)
2ð12fCOD YHaer Þ YHaer
YHaer[qm,H,aer,SS
SO2n SCODbio;n KH;DO;SS 1SO2n KH;S;aer;SS 1SCODbio;n
3 Vn(1 2 BVFn) (1 2 fNitr) Xn]
AOB (N1) using dissolved oxygen
21 YHanx
2ð12fCOD YHanx Þ 2:86 YHanx
2fN
21 YN1
23:43ð12fN YN1 Þ YN1
2fN
21:14 YN2
21 YN2
24:57ð12fN YN1 Þ YN1
21 YN1
1
SNOxNn SCODbio;n KH;NOxN;SS 1SNOxNn KH;S;anx;SS 1SCODbio;n KH;DO;i;SS 3 KH;DO;i;SS 1SO2 Vn(1 2 BVFn) (1 2 fNitr)Xn] n
YHanx[qm,H,anx,SS
YN1[qm,NH4N2Nitr,SS
SO2n SNn KDO;nitr;SS 1SO2n KN;nitr;SS 1SNn
3 Vn(1 2 BVFn) fNitrXn]
NOB (N2) using dissolved oxygen AOB 1 NOB (if YN1 5 YN2 and effluent NO2N 5 0)
1
21 YN1
2
2 fN
Summary
S
O2n 2 YN1[qm,NH4N2Nitr,SS KDO;nitr;SS 1SO2n 3 Vn(1 2 BVFn) fNitrXn]
SNn KN;nitr;SS 1SNn
and fluxes are a function of its substrate concentrations, mixing, and shear forces.
(1) A computational model has been developed for IFAS and MBBR systems. The model is structured to operate with up to 12 reactors (cells) in series. Each cell can be configured to operate anaerobically, anoxically, aerobically, or post-anoxically, with its own amount of biofilm support media. In the absence of media, the model operates as an activated sludge system. (2) The biofilm fluxes are computed by a biofilm diffusional that divides the biofilm into 12 layers and a stagnant liquid layer and uses a finite difference technique to solve for substrate utilization across and transport within each layer. (3) The biofilm diffusional model computes biofilm thickness and fluxes in each cell within a multicell reactor. The thickness
Credits The authors acknowledge the contributions of the staff and faculty of the Environmental Engineering Program of Virginia Tech located at both Blacksburg and Northern Virginia, specifically that of Thomas J. Grizzard; support from Greg Farren, Jim Welch, and Mike Bonk of the Anne Arundel County, Maryland, Department of Public Works operations staff; and assistance from Rip Copithorn of Stearns & Wheler, LLD (Bowie, Maryland). The U.S. Environmental Protection Agency Chesapeake Bay Program (Annapolis, Maryland), Maryland Department of the Environment, and Anne
Table 4—Matrix showing equations for heterotrophs and the interrelationship of kinetic coefficients inside each layer of a multilayer biofilm.* XN SS SN SO2 (dissolved XH (X[12fnitr]) (X fnitr) (SCODbio) (NH4N) oxygen) Heterotrophs using dissolved oxygen Heterotrophs using NO3N AOB (N1) using dissolved oxygen NOB (N2) using dissolved oxygen AOB 1 NOB (if YN1 5 YN2 and effluent NO2N 5 0)
1
21 YHaer
1
21 YHanx
2fN
SNO3N (NO3N)
2ð12fCOD YHaer Þ YHaer
Kinetic expression for biofilm layer n (bfn 5 layer number in multicell reactor) YHaer[qm,H,aer,bfd
SO2bfn SCODbio;bfn KH;DO;bfd 1SO2bfn KH;S;aer;bfd 1SCODbio;bfn
3 Vbfn (1 2 fNitr) Xbfn] 2ð12fCOD YHanx Þ 2:86 YHanx
2fN 21 YN1
23:43ð12fN YN1 Þ YN1
2fN
21:14 YN2
21 YN2
24:57ð12fN YN1 Þ YN1
21 YN1
1
SNO3 Nbfn SCODbio;bfn KH;NO3 N;bfd 1SNO3 Nbfn KH;S;anx;bfd 1SCODbio;bfn KH;DO;i;bfd 3 KH;DO;i;bfd 1SO2 Vbfn(1 2 fNitr)Xbfn] bfn SO2 SNbfn YN1[qm,NH4N2Nitr,bfd KDO;nitr;bfdbfn 1SO2bfn KN;nitr;bfd 1SNbfn
YHanx[qm,H,anx,bfd
3 Vbfn fNitrXbfn] 1 2
21 YN1
2 fN
2 YN1[qm,NH4N2Nitr,bfd
SO2bfn SNbfn KDO;nitr;bfd 1SO2bfn KN;nitr;bfd 1SNbfn
3 Vbfn fNitrXbfn]
* Equations are used to compute the substrate uptake and biomass generation in each of 12 layers of the biofilm. The model sums the substrate uptake and biomass generation over the 12 layers, to compute the substrate and biomass flux for the biofilm (kg/1000 m2/d) in each cell of the reactor. This is multiplied by the biofilm surface area in each cell, to obtain the uptake for the cell. The values of qm,H,aer,bfd and qm,H,anx,bfd are for the biomass in the biofilm. July 2008
631
Sen and Randall
Arundel County (Maryland) funded the pilot studies, which initiated the model development. The Water Environment Research Foundation (Alexandria, Virginia) funded some of the collaboration with full-scale facilities. Submitted for publication September 18, 2007; revised manuscript submitted December 18, 2007; accepted for publication January 8, 2008. The deadline to submit Discussions of this paper is October 15, 2008. References Bae, W.; Rittmann, B. E. (1996) A Structured Model of Dual-Limitation Kinetics. Biotechnol. Bioeng., 49, 683–689. Barker, P. S.; Dold, P. L (1997) General Model for Biological Nutrient Removal Activated Sludge Systems: Model Presentation. Water Environ. Res., 69, 969–984. Boltz, J. P.; Johnson, B. R.; Daigger, G. T. (2008) Modeling Integrated Fixed-Film Activated Sludge (IFAS) Bioreactors I: Mathematical Treatment and Model Development. Water Environ. Res. (submitted for publication). Chen, G. H.; Ozaki, H.; Terashima, Y. (1989) Modeling of the Simultaneous Removal of Organic Substances and Nitrogen in a Biofilm. Water Sci. Technol., 21, 791–804. Downing, L. S.; Nerenberg, R. (2007) Evaluation of the Hybrid Membrane Biofilm Process (HMBP) for Nitrification and Denitrification of Wastewater. Proceedings of Nutrient 2007, Baltimore, Maryland, March 4–7; Water Environment Federation: Alexandria, Virginia, 1127–1138. Harremoe¨s, P. (1978) Biofilm Kinetics. In Water Pollution Microbiology, Vol. 2, Michell, R. (Ed.); Wiley and Sons: New York. International Water Association (2000) IWA Activated Sludge Models ASM1, ASM2d and ASM3. IWA Task Group on Mathematical Modeling for Design and Operation of Biological Wastewater Treatment, International Water Association: London, United Kingdom. Johnson, T. L.; Shaw, A.; Landi, A.; Lauro, T.; Butler, R.; Radko, L. (2007) A Pilot-Scale Comparison of IFAS and MBBR to Achieve Very Low Total Nitrogen Concentrations. Proceedings of Nutrient 2007, Baltimore, Maryland, March 4–7; Water Environment Federation: Alexandria, Virginia, 521–535. Marais, G. V. R.; Ekama, G. A. (1976) The Activated Sludge Process: Part I—Steady State Behaviour. Water SA, 2, 164–200. Perry, R. H.; Chilton, C. H. (1973) Chemical Engineer’s Handbook; McGraw Hill: New York. Picioreanu, C. (1999) Multidimensional Modeling of Biofilm Structure. Ph.D. thesis, Department of Biotechnology, Delft Univeristy of Technology, Delft, Netherlands. Randall, C. W.; Barnard, J. L.; Stensel, D. H. (1992) Design and Retrofit of Wastewater Treatment Plants for Biological Nutrient Removal; Technomic Publishing Co. Inc.: Lancaster, Pennsylvania.
632
Reichart, P. (1998a) AQUASIM 2.0—Tutorial. Swiss Federal Institute for Environmental Science and Technology (EAWAG): Du¨ bendorf, Switzerland. Reichert, P. (1998b) AQUASIM 2.0. User Manual. Swiss Federal Institute for Environmental Science and Technology (EAWAG): Du¨bendorf, Switzerland. Rittmann, B. E.; McCarty, P. L. (1981) Substrate Flux Into Biofilms of Any Thickness. J. Environ. Eng., 108, 831–849. Sen, D. (1995) COD Removal, Nitrification and Denitrification Kinetics and Mathematical Modeling of Integrated Fixed Film Activated Sludge Systems. Ph.D. Dissertation, Virginia Tech, Blacksburg, Virginia. Sen, D.; Phillips, H.; Murthy, S.; Pattarkine, V.; Copithorn, R. R.; Randall, C. W.; Schwinn, D. E.; Banerjee, S. (2007) Minimizing Aerobic and Post-Anoxic Volume Requirements in Tertiary Integrated Fixed Film Activated Sludge (IFAS) and Moving Bed Biofilm Reactor (MBBR) Systems Using the Aquifas Model. Proceedings of the 80th Annual Water Environment Federation Technical Exposition and Conference [CD-ROM], San Diego, California, Oct. 12–17; Water Environment Federation: Alexandria, Virginia, 201–228. Sen, D.; Randall, C. W. (2008a) Improved Computational Model (AQUIFAS) for Activated Sludge, Integrated Fixed-Film Activated Sludge, and Moving-Bed Biofilm Reactor Systems, Part I: Semi-Empirical Model Development. Water Environ. Res., 80, 439–453. Sen, D.; Randall, C. W. (2008b) Improved Computational Model (AQUIFAS) for Activated Sludge, Integrated Fixed-Film Activated Sludge, and Moving-Bed Biofilm Reactor Systems, Part III: Analysis and Verification. Water Environ. Res., 80, Sen, D.; Randall, C. W.; Copithorn, R. R.; Huhtamaki, M.; Farren, G.; Flournoy, W. (2007) Understanding the Importance of Aerobic Mixing, Biofilm Thickness Control and Modeling on the Success or Failure of IFAS Systems for Biological Nutrient Removal. Water Practice, 1 (5), 1–18. Wanner, O.; Eberl, H.; Morgenroth, E.; Noguera, D.; Picioreanu, C.; Rittman, B.; Loosdrecht, M. V. (2006) Mathematical Modeling of Biofilms, IWA Task Group on Biofilm Modeling. Scientific and Technical Report 18; IWA Publishing: London, United Kingdom. Weiss, J. S.; Alvarez, M.; Tang, C.; Horvath, R. W.; Stahl, J. F. (2005) Evaluation of Moving Bed Biofilm Reactor Technology for Enhancing Nitrogen Removal in a Stabilization Pond Treatment Plant. Proceedings of the 78th Annual Water Environment Federation Technical Exposition and Conference [CD-ROM], Washington D.C., Oct. 29–Nov. 2; Water Environment Federation: Alexandria, Virginia, 3889–3904. Wentzel, M. C.; Ekama, G. A.; Marais, G. V. R. (1991) Kinetics of Nitrification Denitrification Biological Excess Phosphorus Removal Systems—A Review. Water Sci. Technol., 23, 555–565. Williamson, K.; McCarty, P. L. (1976) Verification Studies for Biofilm Model for Bacterial Substrate Utilization. J. Water Pollut. Control Fed., 48, 281–289.
Water Environment Research, Volume 80, Number 7