Hindawi Publishing Corporation Journal of Applied Mathematics Volume 2014, Article ID 428602, 13 pages http://dx.doi.org/10.1155/2014/428602
Research Article Improved Crosstalk Reduction on Multiview 3D Display by Using BILS Algorithm Xiaoyan Wang and Chunping Hou School of Electronic and Information Engineering, Tianjin University, Tianjin 300072, China Correspondence should be addressed to Xiaoyan Wang;
[email protected] Received 4 December 2013; Accepted 10 July 2014; Published 24 July 2014 Academic Editor: Nachamada Blamah Copyright © 2014 X. Wang and C. Hou. This is an open access article distributed under the Creative Commons Attribution License, which permits unrestricted use, distribution, and reproduction in any medium, provided the original work is properly cited. In multiview three-dimensional (3D) displays, crosstalk is one of the most annoying artefacts degrading the quality of the 3D image. In this paper, we present a system-introduced crosstalk measurement method and derive an improved crosstalk reduction method. The proposed measurement method is applied to measure the exact crosstalk among subpixels corresponding to different view images and the obtained results are very effective for crosstalk reduction method. Furthermore, an improved crosstalk reduction method is proposed to alleviate crosstalk by searching for the optimal integral intensity values of subpixels on the synthetic image. The derived algorithm based on modified Schnorr-Euchner strategy is implemented to seek the optimal solution to this box-constrained integer least squares (BILS) problem, such that the Euclidean distance between solution and its target decreases substantially. The method we develop is applicable to both multiview 3D parallax barrier displays and multiview 3D lenticular displays. Both simulation and experimental results indicate that the derived method is capable of improving 3D image quality more effectively than the existing method on multiview 3D displays.
1. Introduction Crosstalk is a critical factor affecting the image quality in multiview three-dimensional (3D) displays [1], which is caused by the incomplete isolation of different image channels. In order to mitigate the Moir´e fringe [2] and balance the horizontal versus vertical resolution [3] of 3D displays, the slanted parallax barrier or lenticular lens array is used [4]. However, the shape of subpixels on the display screen is rectangular or triangle and so on, and the shape of visible image observed through a slanted slit cannot exactly coincide with boundary of subpixels. This causes the viewers to observe not only the intended view image but also the other unintended view images and leads to the crosstalk observed at the optimal viewing positions on multiview 3D displays. As introduced in [5], the available mathematical definitions of crosstalk are diverse and sometimes contradictory. In 2009, Huang et al. defined two terms [6]: system crosstalk that is independent of the content (determined only by the display) and viewer crosstalk that varies depending on the content. Most of literatures concerning the methodology
[7, 8] for measuring system-introduced crosstalk on multiview 3D displays provided the methods based on the illumination measurement. However, it is often difficult to measure the amount of crosstalk exactly, due to the complexity of the system, lack of measurements, reluctance of manufacturers to release data, and difficulty of making the measurement [5]. A number of methods [9, 10] for crosstalk reduction on multiview 3D displays have been proposed in the literatures to date. For instance, lowing aperture ratio and fixing a special 3D barriers are both effective for crosstalk cancellation. But these methods are at the cost of the intensity or extra devices. Recently, Li et al. [11] have suggested a method to eliminate the crosstalk by correcting the subpixels values on synthetic image. Despite the fact that this method to some extent reduced the crosstalk, the crosstalk coefficients matrix was obtained by the illumination measurement. The experiment error of crosstalk measurement influenced the results of crosstalk reduction. Moreover, how to obtain the solutions to the equations of crosstalk elimination was not mentioned. Few research efforts have been devoted to reducing crosstalk effectively on multiview 3D displays by taking it
2 as a box-constrained integer least squares (BILS) problem. Lattice reduction [12] is a powerful mathematical tool for solving diverse problems involving point lattices. In [13], the enumeration strategies by Schnorr-Euchner, Pohst, and Kannan were introduced. It was found that the SchnorrEuchner strategy is substantially faster than the other two [14]. An efficient search method based on the SchnorrEuchner enumeration strategy (see [15]) for solving integer least squares (ILS) problem was implemented in [16]. The method was then modified in [17] to solve the BILS problem by taking the box constraint into account. In this paper, we extend the definition of systemintroduced crosstalk to the multiview 3D displays and present a mathematical method for exactly measuring the systemintroduced crosstalk observed at the optimal viewing position. Crosstalk between the neighboring view images is not always equal to the exact crosstalk between subpixels corresponding to different view images. Our method is applied to obtain the crosstalk coefficient matrix A, in which precise crosstalk between the subpixels is presented. The obtained results are more effective for crosstalk reduction method than for the one via the typical experiment. Moreover, we adopt the variable 𝑎 to simulate the slight movement of viewable image, while the viewer is moving parallel to the display screen in the viewing zone such that the more exact crosstalk at the optimal viewing position is obtained. One of major contributions in this paper is the proposal of reasonable measurement method of system-introduced crosstalk between the neighbouring subpixels above and below corresponding to the different view images. In actual display devices, the subpixel values are constrained to the integer set Z. Without regard to it, the crosstalk elimination result still remains the biggist accumulated quantization error, which has the negative impact on image quality. That means the crosstalk elimination [11] on multiview 3D displays is not as complete as expected. Hence, it is effective by taking reduction process as a BILS problem. In this paper, we concentrate our efforts on developing a crosstalk reduction method, which gives a few modifications of Schnorr-Euchner strategy based algorithms given in [17], to correct for the synthetic image with the minimum quantization error. The experiments demonstrate that the proposed method reduces crosstalk effectively and greatly improves the 3D image quality. Moreover, based on the fact that the proposed method is based on the geometrical relationship of parallax barrier and subpixels, it is applied to eliminate crosstalk between the neighbouring subpixels above and below, rather than the neighbouring view images. If the distribution mode of view images changes on the synthetic images [18], that is, the neighbouring subpixels above and below do not correspond to the neighbouring view images, the method [11] becomes invalid. In contrast, the improved method still remains effective. The following notation is used in the paper. R𝑚×𝑛 and R𝑛 denote the set of all real 𝑚 × 𝑛 matrices and the set of all real 𝑛-vectors, respectively. Z𝑚×𝑛 and Z𝑛 denote the set of all integer 𝑚 × 𝑛 matrices and the set of all integer 𝑛-vectors, respectively. I𝑚×𝑛 ∈ Z𝑚×𝑛 denotes 𝑚 × 𝑛 matrix with all entries equal to 1. For a real scalar 𝑧, ⌊𝑧⌉ stands for its nearest
Journal of Applied Mathematics integer, ⌊𝑧⌋ stands for the largest integer less than or equal to 𝑧, and ⌈𝑧⌉ stands for the smallest integer greater than or equal to 𝑧. The operation sign(𝑧) returns −1 if 𝑧 ≤ 0 and 1 if 𝑧 > 0. For a matrix A, a𝑗 denotes the 𝑗th column of A, 𝑎𝑘𝑗 denotes the 𝑘th entry of vector a𝑗 , and A𝑇 denotes the transposed matrix of A. Bold upper case letters and bold lower case letters denote matrices and vectors, respectively.
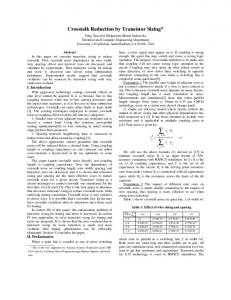
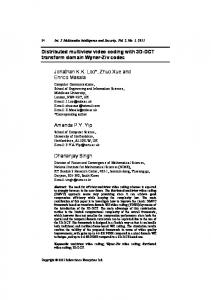
2. Crosstalk Measurement and Crosstalk Reduction Method 2.1. Crosstalk Measurement Method. Multiview 3D displays provide 3D perception without requiring any form of special glasses or other user-mounted devices. Among them, parallax barrier displays and lenticular displays are prevalent in actual devices, as indicated in Figure 1. The synthetic image prepared for the 8-view 3D display is synthesized by 8 different view images, as can be seen in Figure 2. The rectangles represent the subpixels, and the numbers marked in them indicate view image numbers. The subpixels illuminated with color in Figure 2(a) are prepared for the observer at the first optimal viewing position. At the same time, the visible image observed through the slits is illustrated in Figure 2(b). They do not overlap perfectly; that is the main cause of crosstalk observed at optimal viewing position. We extend the definition of system-introduced crosstalk [6] from stereoscopic display to the multiview 3D display and precisely define the system-introduced crosstalk observed at the 𝑛th optimal viewing position on the 𝑁-view 3D display as follows: 𝜒𝑛 =
∑𝑁 𝑙=1, 𝑙=𝑛 ̸ 𝑌𝑙 − 𝑌𝐵 𝑌𝑛 − 𝑌𝐵
,
(1)
where 𝑌𝑙 (𝑙 = 1 ⋅ ⋅ ⋅ 𝑁) denotes the luminance measured at the 𝑛th optimal viewing position with white in the 𝑙th view image and black in all of other view images on the synthetic image and 𝑌𝐵 denotes the environmental light intensity. This definition is black-white crosstalk, since it uses full-black and full-white images in the testing scheme. Full-white and full-black are used because maximum leakage usually occurs when the pixels in the desired view image are full-black and the pixels in the other view images are full-white. The crosstalk between the neighboring view images on 𝑁-view 3D display was considered in formula (1), rather than the crosstalk between the left eye image and the right eye image given in [6]. For the 𝑁-view 3D display, ∑𝑁 𝑙=1, 𝑙=𝑛 ̸ 𝑌𝑙 − 𝑌𝐵 in formula (1) is replaced with 𝑠1 , which is the viewable area of unintended view images observed at the 𝑛th optimum viewing position. 𝑌𝑛 − 𝑌𝐵 is replaced with 𝑠2 , which is the viewable area of intended view image observed at the 𝑛th optimum viewing position. Thus, we define the system-introduced crosstalk as follows: 𝑠 𝜒𝑛 = 1 𝑠2 (2) ∑V ∑ℎ 𝑠 (𝑖 − 1, 𝑚) + ∑V𝑚=1 ∑ℎ−1 𝑖=1 𝑠5 (𝑖 + 1, 𝑚) = 𝑚=1 𝑖=2 4 , ∑V𝑚=1 ∑ℎ𝑖=1 𝑠3 (𝑖, 𝑚)
Journal of Applied Mathematics
3
(a)
(b)
Figure 1: Structures of two kinds of multiview 3D displays. (a) A parallax barrier display. (b) A lenticular display. R G B R G B R G B R G B R G B R
R G B R G B R G B R G B R G B R
1 2 3 4 5 6 7 8 1 2 3 4 5 6 7 8
1 2 3 4 5 6 7 8 1 2 3 4 5 6 7 8
8 1 2 3 4 5 6 7 8 1 2 3 4 5 6 7
8 1 2 3 4 5 6 7 8 1 2 3 4 5 6 7
7 8 1 2 3 4 5 6 7 8 1 2 3 4 5 6
7 8 1 2 3 4 5 6 7 8 1 2 3 4 5 6
7 8 1 2 3 4 5 6 7 8 1 2 3 4 5 6
7 8 1 2 3 4 5 6 7 8 1 2 3 4 5 6
6 7 8 1 2 3 4 5 6 7 8 1 2 3 4 5
6 7 8 1 2 3 4 5 6 7 8 1 2 3 4 5
5 6 7 8 1 2 3 4 5 6 7 8 1 2 3 4
5 6 7 8 1 2 3 4 5 6 7 8 1 2 3 4
(a)
(b)
Figure 2: Distribution mode of 8 different view images’ subpixels on the synthetic image. (a) View image prepared for the first viewing position. (b) Visible image observed through the slits at the first viewing position.
where (𝑖, 𝑚) denotes the subpixel that is in the 𝑖th row on synthetic image observed through the 𝑚th slit at the 𝑛th optimal viewing position, V denotes the number of slits, and ℎ denotes the vertical resolution of the synthetic image. 𝑠3 denotes the viewable area of subpixel belonging to the intended view image and 𝑠4 and 𝑠5 denote the viewable areas of neighboring unintended subpixel above and below respectively. The distributions of 𝑠3 , 𝑠4 , and 𝑠5 are illustrated in Figure 3. The dotted lines present the edges of slits. The rectangles present the subpixels on the display screen. Based on the image composition theory, the subpixels showing the intended view image are determined in all subpixels observed at the 𝑛th optimal viewing position. Calculate
𝑠3 , 𝑠4 , and 𝑠5 and substitute the results into expression (2) to obtain the system-introduced crosstalk. Let the visible area’s width observed through a slit on the synthetic image be 𝑡 (this equals the width of one subpixel). As a result, 𝑠3 , 𝑠4 , and 𝑠5 remain constant when 𝑚 varies over the range of [1, V]. When we substitute 𝑠3 (𝑖) = 𝑠3 (𝑖, 1), 𝑠4 (𝑖 − 1) = 𝑠4 (𝑖 − 1, 1), 𝑠5 (𝑖 + 1) = 𝑠5 (𝑖 + 1, 1) for 𝑠3 (𝑖, 𝑚), 𝑠4 (𝑖 − 1, 𝑚), 𝑠5 (𝑖 + 1, 𝑚) respectively, formula (2) is still valid. 𝑚 = 1 means that subpixels are observed through the first integral slit. Therefore, the system-introduced crosstalk on the multiview 3D display at the 𝑛th viewing position is derived as 𝜒𝑛 =
ℎ ℎ−1 𝑠1 ∑𝑖=2 𝑠4 (𝑖 − 1) + ∑𝑖=1 𝑠5 (𝑖 + 1) = . 𝑠2 ∑ℎ𝑖=1 𝑠3 (𝑖)
(3)
4
Journal of Applied Mathematics If Δ 0 < 𝑡 − Δ 0 − Δ 1 (𝑖), 𝜃
𝑠3 (𝑖) = 3𝑡2 −
s4 (i − 1, m)
2
Δ21 (𝑖) (𝑡 − 2Δ 0 − Δ 1 (𝑖)) − 2 tan 𝜃 2 tan 𝜃
𝑠4 (𝑖 − 1) = 0,
(6) 2
ith row
(𝑡 − Δ 1 (𝑖)) 𝑠5 (𝑖 + 1) = . 2 tan 𝜃
3t s3 (i, m)
s5 (i + 1, m)
t
Figure 3: Illustration of system-introduced crosstalk measurement method.
(2) Crosstalk measurement when 𝜃 > arctan(1/3): when the subpixel is evenly divided by the left side of the slit, the intercept length on the bottom edge of this subpixel is Δ 0 = |(3𝑡 ⋅ tan 𝜃 − 𝑡)/2|. When the subpixel in the 𝑖th row is intercepted by the left edge of the first integral slit, Δ 1 (𝑖) = 3𝑖𝑡 ⋅ tan 𝜃 − ⌊3𝑖𝑡 ⋅ tan 𝜃⌋. When Δ 1 (𝑖) > Δ 0 , the subpixel in the 𝑖th row ⌊3𝑖 ⋅ tan 𝜃⌋ + 1th column on the synthetic image shows the color belonging to intended view image. If Δ 1 (𝑖) − Δ 0 ≤ Δ 0 , 𝑠3 (𝑖) =
Depending on the slant angle of parallax barrier 𝜃, the system-introduced crosstalk measurement is proposed as follows. (1) Crosstalk measurement when 𝜃 ≤ arctan(1/3): when the subpixel is divided equally by the left side of the slit, the intercept length on the bottom edge of the subpixel is 𝑡−Δ 0 = 𝑡 − |(3𝑡 ⋅ tan 𝜃 − 𝑡)/2| = (𝑡 + 3𝑡 tan 𝜃)/2. Let the intercept of subpixel on the lower limb by the left edge of the first integral slit be Δ 1 (𝑖) = 3𝑖𝑡 ⋅ tan 𝜃 − ⌊3𝑖𝑡 ⋅ tan 𝜃⌋. When Δ 1 (𝑖) ≥ 𝑡 − Δ 0 , the subpixel in the 𝑖th row ⌊3𝑖 ⋅ tan 𝜃⌋ + 2th column on the synthetic image shows the color belonging to intended view image. Consider
𝑠3 (𝑖) =
3 2 𝑡 + Δ 1 (𝑖) + Δ 0 − 𝑡 × 3𝑡, 2 2
𝑠4 (𝑖 − 1) =
(2Δ 0 + Δ 1 (𝑖) − 𝑡) , 2 tan 𝜃
(4)
(2Δ 1 (𝑖) + 𝑡) 𝑡 Δ21 (𝑖) − , 2 tan 𝜃 2 tan 𝜃
𝑠4 (𝑖 − 1) = 0,
(7) 2
(𝑡 − Δ 1 (𝑖)) 𝑠5 (𝑖 + 1) = . 2 tan 𝜃 If Δ 1 (𝑖) − Δ 0 > Δ 0 , 𝑠3 (𝑖) = 3𝑡2 −
2
Δ21 (𝑖) (𝑡 + 2Δ 0 − Δ 1 (𝑖)) − , 2 tan 𝜃 2 tan 𝜃 2
𝑠4 (𝑖 − 1) =
(Δ 1 (𝑖) − 2Δ 0 ) , 2 tan 𝜃
(8)
2
(𝑡 − Δ 1 (𝑖)) 𝑠5 (𝑖 + 1) = . 2 tan 𝜃 When Δ 1 (𝑖) ≤ Δ 0 , the subpixel in the 𝑖th row ⌊3𝑖⋅tan 𝜃⌋th column on the synthetic image shows color belonging to intended view image. If Δ 0 − Δ 1 (𝑖) ≤ 𝑡 − Δ 0 , 2
(2Δ 0 − Δ 1 (𝑖)) (2Δ 1 (𝑖) + 𝑡) 𝑡 𝑠3 (𝑖) = 3𝑡 − − , 2 tan 𝜃 2 tan 𝜃
𝑠5 (𝑖 + 1) = 0.
2
When Δ 1 (𝑖) < 𝑡 − Δ 0 , the subpixel in the 𝑖th row ⌊3𝑖 ⋅ tan 𝜃⌋ + 1th column on the synthetic image shows the color belonging to intended view image. If Δ 0 ≥ 𝑡 − Δ 0 − Δ 1 (𝑖),
2
𝑠4 (𝑖 − 1) =
(𝑡 + Δ 1 (𝑖) − 2Δ 0 ) , 2 tan 𝜃
(9)
𝑠5 (𝑖 + 1) = 0. If Δ 0 − Δ 1 (𝑖) > 𝑡 − Δ 0 ,
𝑠3 (𝑖) =
3 2 𝑡 + Δ 1 (𝑖) + Δ 0 − 𝑡 × 3𝑡, 2
𝑠4 (𝑖 − 1) = 0,
(5) 2
𝑠5 (𝑖 + 1) =
𝑠3 (𝑖) = 3𝑡2 −
(𝑡 − Δ 1 (𝑖)) . 2 tan 𝜃
[2 (2Δ 0 − Δ 1 (𝑖) − 𝑡) + 𝑡] 𝑡 (2Δ 1 (𝑖) + 𝑡) 𝑡 − , 2 tan 𝜃 2 tan 𝜃 𝑠4 (𝑖 − 1) = 0, 𝑠5 (𝑖 + 1) = 0. (10)
Journal of Applied Mathematics
5
Substituting these results into expression (3) obtains the system-introduced crosstalk for arbitrary multiview 3D display. In the method given above, the top left corner of the visible image observed through the first integral slit and the top left corner of synthetic image coincide. Variable 𝑎 is used to denote the distance from the top left corner of the visible image observed through the first integral slit to the top left corner of synthetic image. Let 𝑎 be within the range of [0, 𝑡]. Then, Δ 1 (𝑖) = 3𝑖𝑡 ⋅ tan 𝜃 + 𝑎 − ⌊3𝑖𝑡 ⋅ tan 𝜃 + 𝑎⌋. The following calculation procedure is the same as that given above. Varying 𝑎 from 0 to 𝑡 simulates the slight movement of visible image on the synthetic image, while the viewing position is moving parallel to the display screen in the viewing zone. The crosstalk varies with the variable 𝑎. Thus, we define the system-introduced crosstalk as 𝜒𝑛 = min𝑎∈[0,𝑡] 𝜒𝑛 (𝑎) that is the system-introduced crosstalk observed at the optimal viewing point. 2.2. Improved Crosstalk Reduction Method. For crosstalk reduction, the neighboring subpixels in the same column should be considered because the subpixels in same column on synthetic image show the same color, which is the main leakage among different view images. What we want to do is to correct the subpixel value on the synthetic image from 𝑏(𝑖, 𝑗) to 𝑥(𝑖, 𝑗) such that the leakage from the neighboring subpixels in same column will become useful for the image quality of multiview 3D displays; that is, 𝑏 (𝑖, 𝑗)
(1) B1 = {X ∈ Z𝑤×ℎ : X < L or X > U}; (2) B2 = {X ∉ Z𝑤×ℎ : L ≤ X ≤ U}. We propose an alternative method to obtain the optimum solution to equations set (12). For the given B, X is the solution to a BILS problem: min ‖B − AX‖22
X∈B𝑋
B𝑋 = {X ∈ Z𝑤×ℎ : L ≤ X ≤ U} ,
(13)
where ‖ ⋅ ‖2 denotes the Euclidean norm. Given a real ℎ-vector b𝑗 and a real ℎ×ℎ matrix A with full column rank, lattice reduction is applied to solve the problem: 2 min b𝑗 − Ax𝑗 2 ,
𝑠3 (𝑖) 𝑥 (𝑖, 𝑗) + 𝑠5 (𝑖 + 1) 𝑥 (𝑖 + 1, 𝑗) { { { { 𝑠3 (𝑖) + 𝑠5 (𝑖 + 1) { { { { 𝑖=1 { { { { { 𝑥 (𝑖−1, 𝑗)+𝑠 𝑥 (𝑖, 𝑗)+𝑠5 (𝑖+1) 𝑥 (𝑖+1, 𝑗) 𝑠 (𝑖−1) (𝑖) 3 { { 4 ={ 𝑠4 (𝑖 − 1) + 𝑠3 (𝑖) + 𝑠5 (𝑖 + 1) { { { 2≤𝑖≤ℎ−1 { { { { − 1) 𝑥 (𝑖 − 1, 𝑗) + 𝑠 𝑥 (𝑖, 𝑗) 𝑠 (𝑖 (𝑖) { 4 3 { { { { 𝑠4 (𝑖 − 1) + 𝑠3 (𝑖) { { 𝑖 = ℎ, {
x𝑗 ∈B𝑥
(14)
ℎ
B𝑥 = {x𝑗 ∈ Z : l𝑗 ≤ x𝑗 ≤ u𝑗 }
(11) where 𝑏(𝑖, 𝑗) and 𝑥(𝑖, 𝑗) denote the subpixel values in the 𝑖th row 𝑗 column on the synthetic image before and after correction, respectively. That means that the intensity obtained at the 𝑛th optimal viewing position is equal to the intensity of the 𝑛th intended view image, after correction. To solve this problem, it can be written as follows: AX = B,
crosstalk among the subpixels corresponding to different view images on the synthetic image, rather than among the whole neighboring view images. In the actual display devices, 𝑥(𝑖, 𝑗) is set to be 0, if 𝑥(𝑖, 𝑗) < 0; 𝑥(𝑖, 𝑗) is set to be 255, if 𝑥(𝑖, 𝑗) > 255; and 𝑥(𝑖, 𝑗) is set to be ⌊𝑥(𝑖, 𝑗)⌉, if 𝑥(𝑖, 𝑗) ∉ Z. This operation causes the fact that the unique solution to problem (12), X = A−1 B, may not be the optimal solution, which means crosstalk elimination does not perform completely. If the rank of A is ℎ, which means A is full rank, the equation set has the unique solution X = A−1 B. However, B is constrained to the box B𝐵 = {B ∈ Z𝑤×ℎ : L ≤ B ≤ U}, where L = 0 × I𝑤×ℎ and U = 255 × I𝑤×ℎ . Hence X may be in following two boxes:
(12)
where B ∈ Z𝑤×ℎ and X ∈ Z𝑤×ℎ are the synthetic images before and after correction, respectively. A ∈ Rℎ×ℎ is the crosstalk coefficient matrix. The entry of A, 𝑎(𝑝, 𝑞) denotes the leakage degree from the subpixel in the 𝑞th row 𝑗th column to the one in the 𝑝th row 𝑗th column on the synthetic image. 𝑝 and 𝑞 are both the numbers from 1 to ℎ. We obtain 𝑎(𝑝, 𝑞) by the proposed method, which exactly reflects the
for 𝑗 = 1, 2, . . . , 𝑤. The optimal solution to problem (14) is also the solution to (13). In lattice theory, A is called the generator matrix of the lattice L(𝐴) = {Ax𝑗 : x𝑗 ∈ Zℎ }, b𝑗 is called the input vector, and (14) is referred to as a closestpoint problem, since it is the problem to find a point in the lattice which is closest to the given input point b𝑗 . At first, we transform the matrix A to an upper triangular matrix, which has good properties to make the search algorithm more efficient. Here, this can be performed by the QR decomposition of A: AP = QR,
(15)
where P ∈ Zℎ×ℎ is a permutation matrix, Q ∈ Rℎ×ℎ is orthogonal, and R ∈ Rℎ×ℎ is nonsingular upper triangular. With the QR decomposition, we have 2 2 b𝑗 − Ax𝑗 = Q𝑇 b𝑗 − RP𝑇 x𝑗 . 2 2
(16)
Define b𝑗 = Q𝑇 b𝑗 ,
z𝑗 = P𝑇 x𝑗 ,
l𝑗 = P𝑇 l𝑗 ,
u𝑗 = P𝑇 u𝑗 , (17)
6
Journal of Applied Mathematics
where l𝑗 is the lower bound of x𝑗 and u𝑗 is the upper bound of x𝑗 . l𝑗 is the lower bound of z𝑗 ; u𝑗 is the upper bound of z𝑗 . Here, 𝑙1𝑗 = 𝑙2𝑗 = ⋅ ⋅ ⋅ = 𝑙ℎ𝑗 = 0; 𝑢1𝑗 = 𝑢2𝑗 = ⋅ ⋅ ⋅ = 𝑢ℎ𝑗 = 255. When P is an identity matrix, BILS problem (14) is equivalent to the following one: 2 min b𝑗 − Rz𝑗 2
z𝑗 ∈B𝑧
(18)
ℎ
B𝑧 = {z𝑗 ∈ Z : l𝑗 ≤ z𝑗 ≤ u𝑗 } , for 𝑗 = 1, 2, . . . , 𝑤. Then the proposed algorithm tries to solve (18). Note that, if ̂z𝑗 is the solution to (18), then x̂𝑗 = P̂z𝑗 = ̂z𝑗 is the solution ̂ is the solution to (13). to (14) and X We provide a search algorithm which avoids some drawbacks of algorithm BGBF (Algorithm 1) [17]. Our algorithm is applied to obtain the correction result of synthetic image one column by one column. When we input b = b𝑗 (𝑗 is the number from 1 to 𝑤), the correction result of this column ̂z = ̂z𝑗 is obtained. After 𝑤 times operations, synthetic image ̂ Thus, we obtain the is processed to the correction result Z. ̂ ̂ final correction result X = Z. In Step 1 or Step 3, the last value of 𝑧𝑘 may be the lower bound 𝑙𝑘 or the upper bound 𝑢𝑘 . To avoid enumerating some integers outside the interval [𝑙𝑘 , 𝑢𝑘 ] in Step 5, we set Δ 𝑘 = − sign(𝜌𝑘 ). For instance, when ⌊𝑠𝑘 ⌉ > 𝑢𝑘 in Step 1 or Step 3, 𝑧𝑘 = ⌊𝑠𝑘 ⌉ > 𝑢𝑘 , 𝑧𝑘 = min(𝑧𝑘 , 𝑢𝑘 ) = 𝑢𝑘 , and the offset variable Δ 𝑘 = −1 (since 𝜌𝑘 = (𝑠𝑘 − 𝑧𝑘 )𝑟𝑘𝑘 = (𝑠𝑘 − 𝑢𝑘 )𝑟𝑘𝑘 > 0), which means the next value is 𝑧𝑘 := 𝑧𝑘 − 1 = 𝑢𝑘 − 1. This process mostly avoids enumerating integer beyond the box constraint. However, when 𝑢𝑘 − 0.5 ≤ 𝑠𝑘 < 𝑢𝑘 , ⌊𝑠𝑘 ⌉ = 𝑢𝑘 , 𝜌𝑘 = (𝑠𝑘 − 𝑧𝑘 )𝑟𝑘𝑘 = (𝑠𝑘 − 𝑢𝑘 )𝑟𝑘𝑘 < 0, and Δ 𝑘 = − sign(𝜌𝑘 ) = 1, 𝑧𝑘 = 𝑧𝑘 + Δ 𝑘 will be outside the interval [𝑙𝑘 , 𝑢𝑘 ]. To avoid this happening, we set Δ 𝑘 := −1 and compute 𝑧𝑘 := 𝑧𝑘 + Δ 𝑘 if 𝑧𝑘 + Δ 𝑘 > 𝑢𝑘 in Step 5; we set Δ 𝑘 := 1 and compute 𝑧𝑘 := 𝑧𝑘 + Δ 𝑘 if 𝑧𝑘 + Δ 𝑘 < 𝑙𝑘 ; otherwise, we compute 𝑧𝑘 := 𝑧𝑘 + Δ 𝑘 and Δ 𝑘 := −Δ 𝑘 − sign(Δ 𝑘 ). Therefore, our algorithm always enumerates the integers within the box constraint at each level. In algorithm BGBF, if 𝑇 > 𝛽 and 𝑘 ≠ ℎ in Step 4, that means no any other integer will satisfy inequality ∑ℎ𝑙=𝑘 𝑟𝑙𝑙2 (𝑠𝑙 − 𝑧𝑙 )2 < 𝛽 in level 𝑘. If 𝜌𝑙 = 0 (𝑙 = 𝑘 + 1, 𝑘 + 2 ⋅ ⋅ ⋅ ℎ) at that time, there is still not any other integer satisfying the inequality and we should exit loop directly and return the optimal solution 𝑧̂. Therefore, if 𝑇 > 𝛽, 𝑘 < ℎ, and 𝜌𝑙 = 0 (𝑙 = 𝑘 + 1, 𝑘 + 2 ⋅ ⋅ ⋅ ℎ), our algorithm exits the loop and returns the optimal solution ̂z = ̂z𝑗 ; otherwise go back to level 𝑘 + 1.
3. Results and Discussion In this section, we aim to validate the improved crosstalk reduction method on multiview 3D displays, both qualitatively and quantitatively. We first give a specific example to demonstrate that the improved method alleviates the crosstalk on multiview 3D lenticular display effectively. Then computer simulation is carried out to compare the crosstalk correction results with typical method on two test
sequences. Numerical results are presented to validate the performance of the improved method in terms of the mean square error (MSE) and peak signal-to-noise ratio (PSNR). Finally, a photometer is used for measurement to compare the crosstalk reduction results by the improved method and typical method. The experiment results indicate that the improved method eliminates the crosstalk more effectively and improves the quality of the 3D images further. At first, we compare the crosstalk values obtained via the proposed method and measured through the experimental method. To verify the effectiveness of the proposed crosstalk measurement method, a photometer (FS-5500TLS) is used to measure the crosstalk at the optimal viewing position. At first, 8 black-and-white test images are obtained in which each view image is white (that means that the subpixel values corresponding to the certain view image are equal to 255) and, in turn, presented on the display screen. In the blackand-white test image, only subpixel values corresponding to the certain view image are equal to 255, and all of the other subpixel values are equal to 0. We perform the experiment, using a multiview 3D parallax barrier display screen (42HD, provided by Tianjin 3-D Imaging Technique Co. Ltd.) is used to display synthetic images. Then, measure environmental light intensity and each test images intensity, respectively, along the horizontal direction at the optimal viewing distance. The photometer is used for luminance measurements. The luminances 𝑌𝑙 and 𝑌𝐵 are obtained; then crosstalk 𝜒𝑛 = 0.38 is got through formula (1). Through the proposed crosstalk measurement method, we get the crosstalk 𝜒𝑛 = 0.38 when 𝛼 = arctan(2/9) on the multiview 3D display. The result well matches the actual measured crosstalk value. The close agreement between the proposed method and measured crosstalk results demonstrates that the proposed crosstalk measurement method can be used to measure the crosstalk on the multiview 3D display. In our implementation, 𝑎̂ = arg min𝑎 𝜒𝑛 (𝑎) and the crosstalk coefficient matrices A ∈ Rℎ×ℎ are obtained by the proposed system-introduced crosstalk measurement method. The improved crosstalk reduction method is applied to calculate the correction values of subpixels one column by one column. However, when dimension ℎ is large, the search time becomes significant. So 𝐴 is rewritten as 𝐴1 0 ⋅ ⋅ ⋅ 0 0 0 𝐴2 ⋅ ⋅ ⋅ 𝐴=( . . .. ) , .. .. d . 0 0 ⋅ ⋅ ⋅ 𝐴⌈ℎ/𝑟⌉
(19)
where 𝐴𝑙 ∈ R𝑟×𝑟 . To determine 𝑟, we analyze the relationship of neighboring subpixels in the same column. For example, when parallax barrier is slanted at the angle of arctan(2/9), we get the distribution mode of different view images’ subpixels on the synthetic image, illustrated in Figure 2. Taking the first column on the left as an example, the third and fourth subpixels belong to the seventh view image and are observed at the seventh optimal viewing position. That means the third and fourth subpixels do not interact and are not related to each other. Consequently, we consider that every 3 subpixel
Journal of Applied Mathematics
7
Input: The upper triangular matrix R ∈ Rℎ×ℎ with positive diagonal entries, the vector b = b 𝑗 ∈ Zℎ , the lower bound vector l = l 𝑗 ∈ Zℎ , the upper bound vector u = uj ∈ Zℎ , the initial hyper-ellipsoid bound 𝛽. Output: The solution ̂z ∈ Zℎ to the BILS Problem (18). Step 1. (Initialization) Set 𝑘 := ℎ, 𝑇𝑘 := 0, Compute 𝑠𝑘 := 𝑏𝑘 /𝑟𝑘𝑘 , 𝑧𝑘 := ⌊𝑠𝑘 ⌉, 𝑧𝑘 := max(𝑧𝑘 , 𝑙𝑘 ), 𝑧𝑘 := min(𝑧𝑘 , 𝑢𝑘 ), 𝜌𝑘 := (𝑠𝑘 − 𝑧𝑘 )𝑟𝑘𝑘 , Δ 𝑘 := − sign(𝜌𝑘 ). Step 2. Compute 𝑇 := 𝑇𝑘 + 𝜌𝑘2 , if 𝑇 < 𝛽 and 𝑘 ≠ 1, then Go to Step 3 else Go to Step 4 end if Step 3. Set 𝑇𝑘−1 := 𝑇, 𝑘 := 𝑘 − 1 ℎ Compute 𝑠𝑘 := (𝑏𝑘 − ∑𝑚=𝑘+1 𝑟𝑘𝑚 𝑧𝑚 ) /𝑟𝑘𝑘 , 𝑧𝑘 := ⌊𝑠𝑘 ⌉, 𝑧𝑘 := max(𝑧𝑘 , 𝑙𝑘 ), 𝑧𝑘 := min(𝑧𝑘 , 𝑢𝑘 ), 𝜌𝑘 := (𝑠𝑘 − 𝑧𝑘 )𝑟𝑘𝑘 , Δ 𝑘 := − sign(𝜌𝑘 ). Go to Step 2 Step 4. If 𝑇 < 𝛽, then Set 𝛽 := 𝑇, ̂z := z , 𝑘 := 𝑘 + 1, else if 𝑘 = ℎ, then Terminate else 𝑘 := 𝑘 + 1 if 𝜌𝑘 = 0, then 𝐾 := 𝑘 repeat if 𝑘 = ℎ, then Terminate end if 𝑘 := 𝑘 + 1 until 𝜌𝑘 ≠ 0 if 𝑘 ≠ ℎ, then 𝑘 := 𝐾 end if end if end if Step 5. If 𝑧𝑘 + Δ 𝑘 > 𝑢𝑘 , then Set Δ 𝑘 := −1 Compute 𝑧𝑘 := 𝑧𝑘 + Δ 𝑘 else if 𝑧𝑘 + Δ 𝑘 < 𝑙𝑘 , then Set Δ 𝑘 := 1 Compute 𝑧𝑘 := 𝑧𝑘 + Δ 𝑘 else Compute 𝑧𝑘 := 𝑧𝑘 + Δ 𝑘 , Δ 𝑘 := −Δ 𝑘 − sign(Δ 𝑘 ) end if Compute 𝜌𝑘 := (𝑠𝑘 − 𝑧𝑘 ) 𝑟𝑘𝑘 Go to Step 2. Algorithm 1: Crosstalk reduction algorithm.
values are correlative in one column; that is, 𝑟 = 3 when 𝜃 = arctan(2/9). Obviously, when 𝜃 < arctan(1/3), 𝑟 can be determined easily in the same way. When 𝜃 ≥ arctan(1/3), we can determine 𝑟, according to the need. We input the vector b = Q𝑇𝑙 b𝑙𝑗 and upper triangle matrix R𝑙 ∈ R𝑟×𝑟 , where R𝑙 and Q𝑙 ∈ R𝑟×𝑟 are the results of QR composition of A𝑙 , b𝑙𝑗 = (𝑏𝑙,𝑗 , 𝑏𝑙+1,𝑗 , . . . , 𝑏𝑙+𝑟−1,𝑗 )𝑇
(𝑙 is the number from 1 to ⌈ℎ/𝑟⌉; 𝑗 is the number from 1 to 𝑤). After one operation, output 𝑧̂ = (̂𝑧𝑙,𝑗 , 𝑧̂𝑙+1,𝑗 , . . . , 𝑧̂𝑙+𝑟−1,𝑗 )𝑇 . ̂ is After ⌈ℎ/𝑟⌉ × 𝑤 times operations, the correction result X obtained. First, we give a specific example to demonstrate the effectiveness of the proposed method for a group of images of a scene “Euro.” A multiview 3D lenticular display screen
8
Journal of Applied Mathematics
(a)
(b)
(c)
Figure 4: Photos of a scene “Euro” taken at the fourth optimal viewing position. (a) Result before correction. (b) Result by method given in [11]. (c) Result by our method.
(46HD, provided by SuperD Co. Ltd.) is used to display synthetic images. The result before correction and the result by the method in [11] and our method are presented on the display screen, respectively. Figure 4 shows the photos taken at the fourth optimal viewing position. As can be seen the edges of “Euro” are blurring in the result before correction and it is still not good enough in the result by the method in [11]. Compared with Figures 4(a) and 4(b), the photo in Figure 4(c) is the clearest, especially at the boundaries of “golden bricks.” Furthermore, it can be observed from Figure 4 that objects’ jagged edges (such as Euro’ edges and the golden stick’ edges) are still obvious in the result by the method in [11]. In contrast, our method well solves this problem; the phenomenon of contour jaggies largely disappears in the result by our method. It can be discovered from the experiment results that the proposed method reduces the crosstalk more effectively on the multiview 3D lenticular display. Then, we compare the correction results obtained by the proposed method and the method in [11] for two test sequences in terms of MSE and PSNR. Two test sequences are used in our implementation, namely, “Fireman” and “Lotus.”
They are obtained from Tianjin 3D Imaging Technique Co. Ltd., Tianjin, China, which are 3D test sequences with proper parallax between adjacent views. The resolution of “Fireman” is 1024 × 600, while the resolution of “Lotus” is 1920 × 1024. To be fair, the commonly used metric MSE is used to evaluate the residual crosstalk, which is defined as MSE = (1/(ℎ × 𝑤))‖AX − B‖22 . Note that the MSE is converted to the PSNR based upon the relationship PSNR = 10 log10 (2552 /MSE). Figure 5 plots the PSNR values versus both the frame and the view numbers in two sequences. For a closeup look, as an example, Figure 6 compares our correction results with the results by the method in [11]. The PSNR values versus the frame number for each view of “Fireman” are shown in the figure. Furthermore, the MSE curves for each view of “Lotus” are plotted in Figure 7, showing the frame-level residual crosstalk (MSE) of each view versus the frame number. It can be concluded that the improved method performs better than the typical method for both sequences in terms of MSE and PSNR. The MSE per frame in results by the method in [11] and our method for two test sequences is compared. Figure 8 plots the MSE versus the frames for the sequences “Fireman” and
Journal of Applied Mathematics
9
PSNR for “Lotus”
50 48 46 44 42 40 38 200
PSNR (dB)
PSNR (dB)
PSNR of “Lotus”
150 Fram 100 50 e num b er
0
1
2
5 6 3 4 number w ie V
7
8
42 40 38 36 34 32 200
150 Fram 100 e num 50 b er
0
(a)
0
1
PSNR (dB)
8
7
8
PSNR of “Fireman”
PSNR (dB) 150 Fram 100 e num 50 b er
2
7
(b)
PSNR of “Fireman”
50 45 40 35 30 25 200
1
6 5 3 4 umber n w ie V
2
3
5 6 4 mber u n View
7
8
38 36 34 32 30 28 26 200
150 Fram 100 50 e num ber
(c)
0
1
2
3
5 6 4 mber u n View
(d)
Figure 5: PSNR versus both the frame and the view numbers in corrected sequences. (a) PSNR of corrected “Lotus” by our method. (b) PSNR of corrected “Lotus” by the method in [11]. (c) PSNR of corrected “Fireman” by our method. (d) PSNR of corrected “Fireman” by the method in [11].
“Lotus.” As can be seen, the intensity observed at the optimal viewing position in the correction result by our method is very near to the intensity of intended view image; that is, the residual crosstalk reduces greatly in the results by our method. We then estimate the average PSNR per view for the two test sequences. Table 1 lists the average residual crosstalk (PSNR) of each view of the two test sequences in results by the method in [11] and our method. These comparative results clearly demonstrate that the crosstalk reduction is better performed in our results. To further verify the effectiveness of the proposed method, a photometer is used to measure the luminance at the optimal viewing position in our experiment. The screen we use for the measurements is the same 8-view 3D lenticular display as mentioned above. The screen is placed in a dark room and test images (before and after correction) and various reference images are displayed on it alternatively. The typical experiment measures crosstalk based on maximum pixel value. However, the pixel value is a random variable from 0 to 255 in the practical application, which is rarely 0 or 255. Furthermore, while the intended view image is observed, the other view images are all observed at the same time, rather than being observed alternatively. In typical experiment,
Table 1: Crosstalk reduction results (PSNR) comparison in two sequences. Sequences “Fireman” View 1 View 2 View 3 View 4 View 5 View 6 View 7 View 8 “Lotus” View 1 View 2 View 3 View 4 View 5 View 6 View 7 View 8
Before correction
PSNR (dB) Method in [11]
Our method
26.0711 31.3607 31.5242 32.1086 32.0063 31.3716 31.3093 26.1231
29.0970 34.7981 34.9284 35.2510 35.5148 34.7109 34.5597 29.2921
32.5948 40.8481 41.7979 41.5759 43.1056 41.0957 40.3676 33.0626
30.1898 36.0433 36.0373 36.0175 36.0111 35.9936 35.9739 30.1766
34.1157 39.9944 40.0222 39.9877 39.9765 39.9391 39.8958 34.6226
39.7694 46.7904 47.4171 47.2790 47.2212 47.0899 46.5392 42.0747
Journal of Applied Mathematics 42
48
40
46
38
44
PSNR (dB)
PSNR (dB)
10
36 34
42 40
32
38
30
36
28
0
20
40
60
80 100 120 Frame number
140
160
180
34
200
0
20
40
60
80 100 120 Frame number
50
45
45
40
35
0
20
40
60
80 100 120 Frame number
160
180
200
140
160
180
200
140
160
180
200
(b)
50
PSNR (dB)
PSNR (dB)
(a)
140
140
160
180
40
35
200
0
20
40
60
80 100 120 Frame number
(c)
(d)
50
48
45
PSNR (dB)
PSNR (dB)
46
40
44 42 40 38 36
35
0
20
40
60
80 100 120 Frame number
140
160
180
34
200
0
20
40
60
80
120
(f)
48
44
46
42
44
40
PSNR (dB)
PSNR (dB)
(e)
42 40 38 36 34
100
Frame number
38 36 34 32
0
20
40
60
80 100 120 Frame number
140
160
180
200
30
0
20
40
60
80 100 120 140 160 180 200 Frame number
Before correction Method in [11] Our method
Before correction Method in [11] Our method (g)
(h)
Figure 6: PSNR versus frames for each view in “Lotus.” (a) PSNR of view 1 in “Lotus.” (b) PSNR of view 2 in “Lotus.” (c) PSNR of view 3 in “Lotus.” (d) PSNR of view 4 in “Lotus.” (e) PSNR of view 5 in “Lotus.” (f) PSNR of view 6 in “Lotus.” (g) PSNR of view 7 in “Lotus.” (h) PSNR of view 8 in “Lotus.”
Journal of Applied Mathematics
11 70
250
60 50
150
MSE
MSE
200
100
40 30 20
50 0
10 0
20
40
60
80 100 120 Frame number
140
160
180
0
200
0
20
40
60
(a)
60
60
50
30
180
200
140
160
180
200
140
160
180
200
140
160
180
200
30 20
20
10
10 0
20
40
60
80 100 120 Frame number
140
160
180
0
200
0
20
40
60
(c)
80 100 120 Frame number (d)
60
70
50
60 50 MSE
40 MSE
160
40
40
MSE
MSE
50
30 20
40 30 20
10 0
140
(b)
70
0
80 100 120 Frame number
10 0
20
40
60
80 100 120 Frame number
140
160
180
0
200
0
20
40
60
(e)
80 100 120 Frame number (f)
250
70 60
200
40
MSE
MSE
50
30
150 100
20 50
10 0
0
20
40
60
80 100 120 Frame number
140
160
180
200
0
0
20
40
60
80 100 120 Frame number
Before correction Method in [11] Our method
Before correction Method in [11] Our method (g)
(h)
Figure 7: MSE versus frames for each view in “Fireman.” (a) MSE of view 1 in “Fireman.” (b) MSE of view 2 in “Fireman.” (c) MSE of view 3 in “Fireman.” (d) MSE of view 4 in “Fireman.” (e) MSE of view 5 in “Fireman.” (f) MSE of view 6 in “Fireman.” (g) MSE of view 7 in “Fireman.” (h) MSE of view 8 in “Fireman.”
MSE
12
Journal of Applied Mathematics 100 90 80 70 60 50 40 30 20 10 0
Table 2: Crosstalk reduction results (absolute deviation) comparison. View number
0
20
40
60
80
100
120
140
160
180
200
Frame number Before correction Method in [11] Our method
1 2 3 4 5 6 7 8
Absolute deviation (Cd/m2 ) Method in [11] Our method 6.609 5.968 8.532 7.919 18.503 2.000 16.945 0.855 3.040 2.584 11.063 10.624 21.049 2.042 21.173 1.741
which means the viewer crosstalk is eliminated largely by the proposed method.
(a)
MSE
30 25
4. Conclusions
20
Despite the fact that many researchers have been devoted to evaluating and eliminating the crosstalk in the stereoscopic display, there is still a lack of work on crosstalk reduction on multiview 3D displays. Typical methods for crosstalk measurement are based on the experiments, which cannot measure the precise crosstalk. In this paper, a systemintroduced crosstalk measurement method is proposed to obtain crosstalk when slant angle of parallax barrier is an independent variable. Through this method, the crosstalk coefficient matrix A is obtained. Moreover, we improve the lattice search algorithm to reduce the crosstalk on multiview 3D displays, which overcomes some shortcomings of algorithm BGBF. Both simulations and experimental results are presented to demonstrate that proposed method is capable of effectively reducing crosstalk on multiview 3D displays. In practical applications, our system-introduced crosstalk measurement method can be employed to study the performance of multiview 3D techniques and our crosstalk reduction technology can improve the multiview 3D viewing quality. We hope the reader can implement our algorithms without difficulty.
15 10 5 0
0
20
40
60
80
100
120
140
160
180
200
Frame number Before correction Method in [11] Our method (b)
Figure 8: MSE versus frames in “Fireman” and “Lotus.”
when the luminance measured at the 𝑛th optimal viewing position is near to the intended luminance in the 𝑛th test image, the influence on the other viewing position is not evaluated. To be fair, we decide to use only one test image and 8 reference images for comparison. The test image is composed of 8 view images, 𝑉1 = 𝑉2 = 20, 𝑉3 = 𝑉4 = 220, 𝑉5 = 𝑉6 = 40, and 𝑉7 = 𝑉8 = 200, where 𝑉𝑛 denotes pixel value of the 𝑛th view image. The luminance 𝐼𝑛 is measured at the 𝑛th optimal viewing position by the photometer when the test image is presented on the screen. The intended view image’s luminance 𝐼ref𝑛 for the 𝑛th viewing position is obtained at the 𝑛th viewing position when the 𝑛th reference image is presented on the screen. 𝑉1 = 𝑉2 = ⋅ ⋅ ⋅ = 𝑉8 = 𝑉𝑛 in the 𝑛th reference image; that is, there is no crosstalk for 𝑛th view image. Absolute deviation is used to evaluate the performance, which is defined as |𝐼𝑛 − 𝐼ref𝑛 |. The corrected test images by the method in [11] and our method are presented on the display screen, respectively. Table 2 lists the deviation values of the correction results for each view by our method and the method in [11]. These comparative results clearly demonstrate that luminance measured in our result is very close to the intended view image’s luminance,
Conflict of Interests The authors declare that there is no conflict of interests regarding the publication of this paper.
Acknowledgments This work was supported by National 863 Programm (no. 2012AA03A301) and by Ph.D. Programs Foundation of Ministry of Education of China (no. 20110032110029).
References [1] L. Xing, J. You, T. Ebrahimi, and A. Perkis, “Assessment of stereoscopic crosstalk perception,” IEEE Transactions on Multimedia, vol. 14, no. 2, pp. 326–337, 2012.
Journal of Applied Mathematics [2] V. V. Saveljev, “Characteristics of Moir´e spectra in autostereoscopic three-dimensional displays,” Journal of Display Technology, vol. 7, no. 5, pp. 259–266, 2011. [3] C. van Berkel, “Image preparation for 3d lcd,” in Stereoscopic Displays and Virtual Reality Systems VI, vol. 3639 of Proceedings of SPIE, pp. 84–91, 1999. [4] H. Urey, K. V. Chellappan, E. Erden, and P. Surman, “State of the art in stereoscopic and autostereoscopic displays,” Proceedings of the IEEE, vol. 99, no. 4, pp. 540–555, 2011. [5] A. J. Woods, “How are crosstalk and ghosting defined in the stereoscopic literature?” in Stereoscopic Displays and Applications, vol. 7863 of Proceedings of SPIE, pp. 1–12, 2011. [6] K. Huang, K. Lee, and H. Lin, “Crosstalk issue in stereo/autostereoscopic display,” in Proceedings of the International Display Manufacturing Conference, pp. 2–18, 2009. [7] A. Boev, A. Gotchev, and K. Egiazarian, “Crosstalk measurement methodology for auto-stereoscopic screens,” in Proceedings of the 1st International Conference on 3DTV, pp. 1–4, May 2007. [8] K. Vermeirsch, G. van Hoey, M. van Beurden, and P. Surman, “Measurement and evaluation of head tracked autostereoscopic displays,” in Proceedings of the 5th 3DTV Conference: The True Vision - Capture, Transmission and Display of 3D Video (3DTV-CON ’11), pp. 1–4, May 2011. [9] C. Lee, G. Seo, J. Lee, T. H. Han, and J. G. Park, “Autostereoscopic 3D displays with reduced crosstalk,” Optics Express, vol. 19, no. 24, pp. 24762–24774, 2011. [10] W. Zhao, Q. Wang, A. Wang, and D. Li, “Autostereoscopic display based on two-layer lenticular lenses,” Optics Letters, vol. 35, no. 24, pp. 4127–4129, 2010. [11] X. Li, Q. Wang, D. Li, and A. Wang, “Image processing to eliminate crosstalk between neighboring view images in threedimensional lenticular display,” IEEE/OSA Journal of Display Technology, vol. 7, no. 8, pp. 443–447, 2011. [12] D. Wubben, D. Seethaler, J. Jalden, and G. Matz, “Lattice reduction,” IEEE Signal Processing Magazine, vol. 28, no. 3, pp. 70–91, 2011. [13] M. O. Damen, H. El Gamal, and G. Caire, “On maximumlikelihood detection and the search for the closest lattice point,” IEEE Transactions on Information Theory, vol. 49, no. 10, pp. 2389–2402, 2003. [14] X. Chang and Q. Han, “Solving box-constrained integer least squares problems,” IEEE Transactions on Wireless Communications, vol. 7, no. 1, pp. 277–287, 2008. [15] C. Schnorr and M. Euchner, “Lattice basis reduction: improved practical algorithms and solving subset sum problems,” Mathematical Programming, vol. 66, no. 2, pp. 181–199, 1994. [16] E. Agrell, T. Eriksson, and A. a. . Vardy, “Closest point search in lattices,” IEEE Transactions on Information Theory, vol. 48, no. 8, pp. 2201–2214, 2002. [17] J. Boutros, N. Gresset, L. Brunel, and M. Fossorier, “Softinput soft-output lattice sphere decoder for linear channels,” in Proceeding of the IEEE Global Telecommunications Conference (GLOBECOM '03), vol. 3, pp. 1583–1587, December 2003. [18] H. Lim, S. H. Kim, Y. G. Lee, and H. Park, “A simultaneous view interpolation and multiplexing method using stereo image pairs for lenticular display,” in Proceedings of the 14th IEEE International Conference on Image Processing (ICIP ’07), pp. V205–V208, San Antonio, Tex, USA, September 2007.
13
Advances in
Operations Research Hindawi Publishing Corporation http://www.hindawi.com
Volume 2014
Advances in
Decision Sciences Hindawi Publishing Corporation http://www.hindawi.com
Volume 2014
Journal of
Applied Mathematics
Algebra
Hindawi Publishing Corporation http://www.hindawi.com
Hindawi Publishing Corporation http://www.hindawi.com
Volume 2014
Journal of
Probability and Statistics Volume 2014
The Scientific World Journal Hindawi Publishing Corporation http://www.hindawi.com
Hindawi Publishing Corporation http://www.hindawi.com
Volume 2014
International Journal of
Differential Equations Hindawi Publishing Corporation http://www.hindawi.com
Volume 2014
Volume 2014
Submit your manuscripts at http://www.hindawi.com International Journal of
Advances in
Combinatorics Hindawi Publishing Corporation http://www.hindawi.com
Mathematical Physics Hindawi Publishing Corporation http://www.hindawi.com
Volume 2014
Journal of
Complex Analysis Hindawi Publishing Corporation http://www.hindawi.com
Volume 2014
International Journal of Mathematics and Mathematical Sciences
Mathematical Problems in Engineering
Journal of
Mathematics Hindawi Publishing Corporation http://www.hindawi.com
Volume 2014
Hindawi Publishing Corporation http://www.hindawi.com
Volume 2014
Volume 2014
Hindawi Publishing Corporation http://www.hindawi.com
Volume 2014
Discrete Mathematics
Journal of
Volume 2014
Hindawi Publishing Corporation http://www.hindawi.com
Discrete Dynamics in Nature and Society
Journal of
Function Spaces Hindawi Publishing Corporation http://www.hindawi.com
Abstract and Applied Analysis
Volume 2014
Hindawi Publishing Corporation http://www.hindawi.com
Volume 2014
Hindawi Publishing Corporation http://www.hindawi.com
Volume 2014
International Journal of
Journal of
Stochastic Analysis
Optimization
Hindawi Publishing Corporation http://www.hindawi.com
Hindawi Publishing Corporation http://www.hindawi.com
Volume 2014
Volume 2014