adenosine and N6-methyladenosine were the same, we added 18.7 pmol of adenosine and 106 pmol of internal. Sample Preparationand Analysis. Immediately ...
CLIN. CHEM. 38/2,
256-262
(1992)
Improved Detection of Ischemia-Induced Increases in Coronary Sinus Adenosine in Patients with Coronary Artery Disease Caries R. Ayers,’ Marcia R. Lehman,’ Heidi E. Taylor,’ Vicki L. Gordon,’ Peter J. Sabla,’ Don Ras,3 Thomas C. SkaIak,3 and Joel Linden’ Marc D. Feldman,’4
Attempts to monitor coronary sinus adenosine as a clinical marker of myocardial ischemia in humans have been disappointing. Accordingly, procedures have been developed for detecting adenosine in blood collected from the human coronary sinus. Collection involves using a double-lumen metabolic catheter, which allows blood to be mixed with a stop solution at the catheter tip, thereby minimizing adenosine formation and degradation. A fivecomponent stop solution almost completely arrests adenosine formation and degradation. Adenosine analysis is improved by using both boronate and C18 Sep-Pak columns to purify and concentrate adenosine in human plasma before HPLC. Plasma adenosine in the coronary sinus of patients with and without coronary artery disease, measured before and during peak atnal pacing, showed a twofold atrial pacing-induced increase in adenosine in the patients with coronary artery disease (n = 9, P 10%, all results presented are the means of duplicate determinations. Recovery of aclenosine and internal standard during sample preparation. To verify that the recoveries of both adenosine and N6-methyladenosine were the same, we added 18.7 pmol of adenosine and 106 pmol of internal
Sample Preparationand Analysis Immediately
after collection, the blood sample was
centrifuged at 4800 x g for 2 mm. Each supernate was 4Nonatandard
abbreviations:
ERNA, e,’ythro-9(2-hydroxy-3-no-
nyl)-adenine; AOPCP, a,-methylene-adenosinediphosphate; Re, Reynolds numbers; and Hct, hematocrit.
5Th1s equation was derived as follows: The total volumeof blood/stop solution in the collectionsyringe is 4 mL, of which 0.2 mL is AOPCP/EHNA, 2.9 mL is stop solution,,and 0.9 rnL is blood. The plasma volume collected = 0.9 mL (1- Hct). Thetotal volume collected minus erythrocytes =4 mL - (0.9 mLXHct). Therefore, each 1 mL of collected sample contains a volumeof plasma given by 1 mL{0.9mL(1 - Hct)44 mL - (O.9mLXHct)]}, or 1 mL((1 - Hct)/ (4.44 - Hot)].
CLINICALCHEMISTRY,Vol.38, No.2, 1992 257
standard to 1 mL of stop solution and processed and this sample as above. The chromatographic peak areas were compared with those for identical amounts of adenosine and internal standard injected directly onto the HPLC column. Duplicate samples were analyzed on three separate occasions (n = 6). Linear recovery of adenosine added to plasma. We collected 4 mL of blood in 12 mL of stop solution as described above. The supernatant fluid from this sample was divided into six 1-mL portions, to which we added adenosine (0, 4.7, 9.4, 18.7, 28.1, and 37.4 pmol) and processed the samples as above. The amount of adenosine detected was plotted as a function of adenosine added. Effect of adenosine deaminase on HPLC profiles. We collected blood as in the preceding section but divided the supernate into two portions. One portion was processed as described above. The second portion was processed similarly except that the dried samples were reconstituted with 200 iL of adenosine deaminase (2 kU/L added to HPLC-grade H20; Sigma Chemical Co.). After letting the samples sit at room temperature for 20 mm, we added 200 p.L of KH2PO4 (10 mmol/L, pH 3.6) to each sample. The deaminase was inactivated by boiling for 3 mm, and the sample was filtered as before and injected onto the HPLC column. We did not add internal standard to the sample to be deaminated because it was a substrate for the enzyme. analyzed
Stop-Solution Verification To determine the extent to which adenosine breakdown is arrested by the metabolic catheter when dipyridamole, EDTA, and heparin are added at its tip and EENA and AOPCPare added in the collection syringe, we performed the following experiment. Peripheral venous blood (3.6 mL) was drawn from a volunteer into heparin (25 kilo-int. unita/L). The blood was immediately dispensed into 11.6 mL of dipyridamole and EDTA solution (at concentrations given in Sample Collection) containing 16 L of [14C]adenosine (New England Nuclear, Boston, MA; specific activity 57.2 Ci/mol; 58 159 dpm/mL in blood plus stop solution). At 9 and 60s after withdrawal of blood from the volunteer, 0.8 mL of EHNA and AOPCP were added (9 s is the average transit time for blood in the metabolic catheter). Blood, five-component stop solution, and PC]adenosine were centrifuged at 2500 x g for 1.5 ruin, and the supernate was removed. We added 50 L of trichloroacetic acid solution (final concentration in supernate, 50 g/L) to 950 pL of supernate and centrifuged at 2500 x g for 1 mm. We then mixed 0.5 mL of this supernate with 0.5 mL of ti-noctylamine (0.5 mmol/L) in Freon and centrifuged again at 2500 x g for 1 mm. We injected 50 1zL of the top (aqueous) layer into the HPLC column and continuously monitored the radioactivity with a Beckman 171 radioisotope detector. To determine the extent to which AMP is degraded, we substituted 483 pL of [“CUJ)]AMP (specific activity 590 Ciimol; 71713 dpni/mL in blood plus stop solution) for [‘4C]adenosine. The metabolism of adenosine and AMP was markedly 25$ CLINICALCHEMISTRY,Vol.38, No.2, 1992
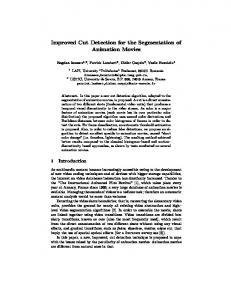
inhibited by the stop solution at 9s. [‘4C]Adenosine and [14CJAMP were recovered in HPLC peaks corresponding to these purines at the following rates (mean ± SD): 98.5% ± 0.8% (n = 6) and 90.5% ± 1.5% (n = 8), respectively. At 60 s, although the metabolism of [14C]adenosine was still markedly inhibited [95.5% ± 1.2% was still present (n = 2)], the metabolism of [14C]AMP was not: 1.2% ± 0.5% remained (n = 2). Metabolic Catheter Verification A model of the metabolic catheter was built to verify that the stop solution and blood are mixed at its tip. We used a precision-bore glass tube to simulate the outer catheter, to allow a direct microscopic view of flow at the tip. An inner catheter was inserted into the glass tube, and the coupled syringe system was connected to an infusion-withdrawal pump to control the flow rate. The open end of the glass tube was located in a small reservoir with a pressure of 1-3 cm of H20 (-100-300 Pa), simulating the coronary sinus. Dextran solutions with viscosities equal to those of blood at 37#{176}C and stop solution at 25#{176}C were used. The dextran stop solution also contained cresyl violet (20 g/L) to provide contrast for flow visualization. For all observations we used a microscope with a 3.5x Leitz long-working-distance objective and photographed the flow patterns for later analysis. The Reynolds numbers (Re) that indicated adequate miring (11) were then determined. Flow rates of 0.045, 0.090,0.180,0.270,0.315, and 0.405 mIIs were examined, corresponding to Re of 7.7, 15.5, 31.0, 46.5, 54.2, and 69.7, respectively. Analysis of flow data involved determination by digital densitometry of the black-and-white negative micrographa of the space between the glass model of the outer and inner catheters. A uniform abeorbance (optical density) between these catheters was interpreted as adequate mixing. A gradation of optical densities was interpreted as indicating regions of laminar flow and inadequate mixing of simulated blood and stop solution. Figure 2 shows micrographs of the flow patterns in the glass model of the outer catheter, at the location of the inner catheter tip. The black rectangular shapes are the tips of the inner catheters. The left and right boundaries of the micrographs are the inner walls of the glass model of the outer catheter. The dashed lines drawn on each micrograph indicate where the optical density was measured. Panels A-C show an unmixed (clear) region of simulated blood at the left wall of the outer catheter and a dark (blue dye) region of stop solution near the inner catheter body. This gradation of rnirtng is reflected in the optical density measurements, which show a continuous decrease from the inner catheter body to the wall of the outer catheter. In panel D the micrograph appears to show uniform mixing, but the optical density measurements show that a concentration gradient is still present. In panels E and F the optical density is uniform across the lumen of the outer catheter, indicating that complete mixing has been achieved. Thus, adequate mixing occurs at the tip of the metabolic catheter if Re are maintained at 54.2. This
two- or three-vessel coronary artery
disease, with at least one stenosis >70%. Patients were identified 18 h before catheterization and were approached for consent. All medications were stopped at this time. We waited 30 miii between the routine diagnostic catheterization and the research protocol. The atrial pacing stages were 100,120, and 140 beats/ruin, each for 2 miii, with a final stage of 160 beats/ruin for 5-7 mm. We measured baseline and peak pacing coronary sinus adenosine, simultaneous coronary sinus and aortic lactate and oxygen saturation, heart rate, and blood pressure, and obtained a 12-lead electrocardiogram.
(I,
z -J
C-)
Results
I0
Assay Verification
0
Recovery of adenosine and internal standard during In three paired samples (ii =6) the percentage recoveries for adenosine and N6-methyladenosine through all steps of the assay, from preparation for boronate column application to reconstitution in phosphate buffer, were 61.9 (SD 7.0)% and 61.1 (SD 5.5)%, respectively (not significantly different). Analytical recovery of adenosine added to plasma. The amount of adenosine detected by the assay was linearly related (r2 = 0.97) to the amount of exogenousadenosine added to plasma. In addition, the slope of the regression line was near unity (0.973), and the sum of endogenous and added adenosine was close to the predicted value (y = 17.61 + 0.973x). Effect of adenosine deaminase on HPLC profiles. Figure 3 depicts chromatograms for paired samples obtained from the same volunteer. One sample of each pair was incubated with adenosine deamunase; the other was not. Adenosine deaminase e1iminited the adenosine peak, indicating that this peak was indeed adenosine. (We did not add internal standard to the sample to be denminted because it was a substrate for the enzyme.) sample preparation.
-
l.4
0.7
RADIAL
0.0
DISTANCE,
0.7
R (mm)
FIg.2. MixIng of artificial blood with stopsolution inthemodelofthe metabolic catheter as shown in micrographs (right) and densitometnc measurements (Iel offlowpatterns The blackrecfangularshapesarethe tips of the Innercatheters, and the left and right boundaiiesof the mlcrographsaretheInnerwallsof the glass model of theoutercatheter.Adequate mixing of simulated blood and stop solutionIs achievedat a Reynoldsnumberof 54.2 (panelE), correspondingto a flow rate of 0.315mLJs
corresponds to withdrawal of a 4-mL sample (of blood plus stop solution) in 12.78(0.315 mIJs). For all studies with patients, 4 mL of blood plus stop solution was withdrawn in 12 s, which exceeds the minimum flow rate required for adequate mixing.
A.Control
BAdenoueDeominase
Oxygen and Lactate Analysis
Oxygen saturation of blood samples was determined by an electrochemical fuel-cell method (Co-oximeter; Corning Medical, Medfleld, MA) in the catheterization laboratory. Blood lactate concentrations were determined with the aca (E.I. du Pont de Nemours and Co., Wilmington, DE), by a modification of the Marbach and Weil method, which involves the oxidation of lactate to pyruvate. Lactate production was defined as coronary sinus lactate exceeding aortic lactate at peak pacing. Studies wfth Patients Fifteen patients with a history of stable angina pectons or atypical chest pain were chosen from the elective cardiac catheterization schedule. Six of these patients were found to have normal epicardial coronary arteries and left ventriculography. The other nine had
Fig. 3. Effectof adenosinedeamlnase on HPLCprofilesfor paired samplesfromthesamevolunteer,before (A) and after ( treatment with adenosinedeaminase Adenoelne(black arrow) andInternalstandard(wl,Ite arrow) were elutedat 9.7 and28.8 mm,respectively.Internalstandardwas not added to the sample to bedeaminated CLINICAL CHEMISTRY, Vol. 38, No. 2, 1992 259
0.4
Studieswith Patients Patients’ results are displayed in Table 1. There was no difference in baseline heart rates, but the normal group attained a higher peak heart rate during atrial pacing. There was no difference in the baseline or peak atrial pacing rate-pressure products between the normal and coronary artery disease groups. Seven of nine coronary artery disease patients had normal baseline electrocardiograms and developed >1.5 mm ST-segment depression. The other two patients also developed >1.5 mm ST-segment depression, but the electrocardiogram changes with atnial pacing were nondiagnostic because their baseline electrocardiograms were abnormal, with ST-segment depression. One of six normal patients with ST-segment depression at baseline developed >1.5 mm ST depression with atnial pacing. Eight of nine coronary artery disease patients developed reproduction of their typical angina with atnial pacing, whereas only one of six normal patients developed reproduction of their typical chest pain symptoms with pacing. There was no difference at baseline or change with pacing in the aortocoronary sinus oxygen content difference between the coronary artery disease and normal groups. Only three of the nine patients with coronary artery disease had lactate production, defined as the myocardial lactate extraction fraction becoming negative,although the coronary artery disease group as a whole had a decrease in the extraction fraction. There was no change in the myocardial lactate extraction fraction forthe normal group. There was no difference in the baseline coronary sinus adenosine concentration between the two groups; every patient in the coronary artery disease group had an increase in coronary sinus adenosine of 1.5-fold (Figure 4).There was no change in coronary sinus adenosine with atrial pacing in the normal group.
CAD
(n=9)
0.3
I
0.2
: 0.
Ba..lln.
Pacing
1
Normal (n=6) 0.3
:
fi
,J.u
BasslIn.
Pacing
FIg. 4. Coronarysinusadenosineconcentrations (pmol/L) at baselIneand peak atrial pacingfor Individualpatients In the coronary artery disease (CAD)andnormalgroups Means ± SD are shown for each group. The IncreaseIn the CAD group was
signifIcant(*