J. Cent. South Univ. (2013) 20: 1896−1903 DOI: 10.1007/s11771-013-1688-3
Improved Goldstein filter for InSAR noise reduction based on local SNR SUN Qian(孙倩)1, LI Zhi-wei(李志伟)1, ZHU Jian-jun(朱建军)1, DING Xiao-li(丁晓利)2, HU Jun(胡俊)1, XU Bing(许兵)1 1. School of Geosciences and Info-Physics, Central South University, Changsha 410083, China; 2. Department of Land Surveying and Geo-Informatics, The Hong Kong Polytechnic University, Hong Kong, China © Central South University Press and Springer-Verlag Berlin Heidelberg 2013 Abstract: Although the modified Goldstein filter based on the local signal-to-noise (SNR) has been proved to be superior to the classical Goldstein and Baran filters with more comprehensive filter parameter, its adaptation is not always sufficient in the reduction of phase noise. In this work, the local SNR-based Goldstein filter is further developed with the improvements in the definition of the local SNR and the adaption of the filtering patch size. What’s more, for preventing the loss of the phase signal caused by the excessive filtering, an iteration filtering operation is also introduced in this new algorithm. To evaluate the performance of the proposed algorithm, both a simulated digital elevation model (DEM) interferogram and real SAR deformation interferogram spanning the L’ Aquila earthquake are carried out. The quantitative results from the simulated and real data reveal that up to 79.5% noises can be reduced by the new filter, indicating 9%−32% improvements over the previous local SNR-based Goldstein filter. This demonstrates that the new filter is not only equipped with sufficient adaption, but also can suppress the phase noise without the sacrifice of the phase signal. Key words: interferometric synthetic aperture radar (InSAR); Goldstein filter; signal-to-noise (SNR); adaptivity
1 Introduction Interferometric synthetic aperture radar (InSAR) has been proved to be a very powerful tool for measuring surface topography [1] and ground deformation associated with earthquakes [2−4], underground mining [5−6], land reclamation [7−8], glacier flow [9−11], etc. A pair of SAR images acquired over the same area but with slightly different angles is used to generate an interferogram [12]. Generally, the interferometric phase is in the form of modulus 2π, which needs a phase unwrapping operation to retrieve the terrain elevation or surface deformation [13−14]. Due to the effects of the water vapor in the atmosphere and the spatial-temporal decorrelation, the interferometric phase is always very noisy [15]. If the noise was not properly removed, it will not only affect the quality of the elevation or deformation measurements derived from the interferogram, but also bring pseudo residues that interfere with the phaseunwrapping process [13]. Various methods have been applied to improve the quality of InSAR interferogram [16−19], one of which is filtering the interferometric phase [20−25]. Some
approaches are used to complex interferometric phase data while others are processed in the frequency domain. For instense, BEZERRA-CANDEIAS et al [20] combined three different spatial filtering algorithms based on 1) a morphological filter, 2) a modified median filter, and 3) a modified mode filter, taking into account of the periodic characteristic of the wrapped phase in SAR interferogram. The advantage of these spatial filters is their simplicity; however, the main disadvantage is the destroy in the fringe structure especially in the high-fringe areas. Thus, a better filtering algorithm was demanded to reduce the phase noise efficiently while has no or minimum impact on the image structure. In the late 1990s, many different types of adaptive filters both in the space and frequency domains were presented to remove the phase noise of SAR interferogram. Among these techniques, Goldstein filtering algorithm [21] is the most commonly used method for noise reduction, which have been embedded in some popular SAR data processing software, e.g., GAMMA. However, the filtering strength of the Goldstein algorithm is constant for the phases with different noises. It does not necessarily enhance or recover the interferometric phase signal when reducing the phase noise [22]. A modified algorithm was proposed
Foundation item: Projects(40974006, 40774003) supported by the National Natural Science Foundation of China; Project(NCET-08-0570) supported by the Program for New Century Excellent Talents in Universities of China; Project(2011JQ001) supported by the Fundamental Research Funds for the Central Universities of China; Project(PolyU 5155/07E) supported by the Research Grants Council (RGC) of the Hong Kong Special Administrative Region, China; Project(CX2011B102) supported by the Doctoral Research Innovation of Hunan Province, China Received date: 2012−05−02; Accepted date: 2012−08−07 Corresponding author: LI Zhi-wei; Professor, PhD; Tel: +86−731−88830573; E-mail:
[email protected]
J. Cent. South Univ. (2013) 20: 1896−1903
1897
by BARAN et al, which adaptively changes the filtering strength by the interferometric coherence [22]. But the phase noise in the SAR interferogram is affected by not only coherence but also the look numbers [24]. In Ref. [25], another modified adaptive filter, which will be called the SNR filter in the following sections, was derived from the classical Goldstein filter by controlling the filtering strength with the local signal-to-noise (SNR). It is demonstrated that the local SNR is superior to the interferometric coherence in reflecting the quality of the interferogram. In this work, the local SNR-based Goldstein filter is further developed to better suppress the phase noise and preserve the integrity of phase signal. In this new algorithm, the local SNR is redefined for better reflecting the phase noise, and a new filtering patch size is proposed to adaptively change with the local SNR. Besides, an operation of iteration filtering is applied to prevent the loss of the phase signal. The new filter is applied to both simulated and real SAR interferograms to reduce the phase noise. The comparisons of the new filter with the classical Goldstein, Baran and SNR filters are also conducted.
2
Goldstein filter developments
algorithm
and
its
In this section, the fundamental concepts behind the most widely used adaptive Goldstein filter and its modifications are reviewed [21−22, 25]. The Goldstein filter is implemented in frequency domain. It smoothes the spectrum |Z(u, v)| in each segmented patch by spatial convolution with a block kernel S{·}, and then multiplying the smoothed spectrum by the 2D FFT samples Z(u, v): Zˆ (u , v) S{| Z (u, v) |} Z (u, v)
(1)
where is the filter parameter; u and v are spatial frequencies; Zˆ (u , v) is the spectrum of the smoothed Fourier samples. The mentioned patches are the small pieces of interferogram, which are overlapped to preserve the continuities at the boundaries. The filter parameter is an arbitrary value which typically lies in the range of [0, 1]. For the case 0, the smoothing operator equals one, and there is no filtering. When the larger value of is chosen, the filtering becomes more significant, and for the value of 1, the strongest filtering occurs. As the exponent is a pre-chosen parameter in the Goldstein filter, it is difficult to choose the appropriate value of the parameter with different parts of the interferogram. The resolution of interferometric phase would decrease if too large a value for is employed. In order to make the filter parameter more adaptive, BARAN et al [22] presented a modification to
the Goldstein filter by making the parameter depend on the mean value of the coherence over the effective patch (patch size minus overlap size): Zˆ (u, v) S{| Z (u , v) |}1 Z (u , v )
(2)
In this filter, the parameter has been replaced by 1 . This approach relates the strength of filtering to the coherence of the overlapped part of the interferogram patch, and thus allows stronger filtering in the low coherence area while prevents the high coherence area being over-filtered. However, according to the probability density function (PDF) of the interferometric phase, it has been shown that the noise standard deviation depends on the interferometric coherence as well as the number of looks [26]. Therefore, phase noise in the interferogram with the same coherence but different look numbers can be quite different [24]. For example, when the coherence is the same, the phase noise in a 1-look interferogram will be twice larger than that in a 10-look interferogram. Therefore, although the algorithm developed by BARAN et al has some improvements in reducing phase noise, its limitation is obvious as the coherence can only partially reflect the phase noise of the interferogram. Besides, the precise determination of the interferometric coherence is still a problem for InSAR data [15]. Another modified Goldstein filter is choosing the local SNR as the guide of the filtering strength [25]. Simply, SNR is the ratio of the signal to noise, which is commonly used to measure the quality of an image [25, 27]. The higher the SNR, the better the quality of the image. Compared with the interferometric coherence, SNR absorbs the influence of look number and therefore can better reflect the phase standard deviation. The local SNR is calculated by the ratio of the maximum to minimum value of the phase variances:
σ2 ,max R 10 log10 2 σ ,min
(3)
where σφ is the standard deviation of the phase, which is a very meaningful measurement for the noise of interferometric phase and can be estimated directly from both unfiltered and filtered interferograms. Then, the constructed filtering parameter based on the local SNR is as follows: exp R α 1 max(exp R )
(4)
where max(·) is the operator of maximization.
3 Filter modifications Although the SNR filter is superior to the Goldstein
J. Cent. South Univ. (2013) 20: 1896−1903
1898
and Baran ones in reduction of the phase noises, its adaptation is not always sufficient. As the local SNR is calculated by the ratio of the extreme value of the variances in the logarithm form and the filtering parameter is constructed in the exponential form as Eq. (4), the filtering parameter is generally concentrated on a relatively small interval, e.g., [0.8, 1]. This distribution is not very reasonable, especially for the area with weak phase noise. Therefore, improvements are required. In this section, a new SNR filter algorithm is presented with the improvements in the definition of SNR and determination of the filtering patch. In the new SNR algorithm, the local variance is estimated for each corresponding effective patch: α (( ( (i, j ) (i, j )) 2 ) /( N 1))1/ 2
(5)
N
where φ(i, j) is the value of phase corresponding to the pixel in the effective patch; (i, j ) is the mean value of phase over the chosen effective patch; N is the number of samples in the effective patch, which is 4×4 in this work. For each effective patch, the value of local SNR is then calculated with the ratio of the maximum value of the local variances estimated in the whole interferogram and the local variance in the logarithm form: σ 2 ,max Rrevise 10 lg σ2
Correspondingly, reconstructed:
(6) the
Rrevise max( Rrevise )
1 revise
filter
parameter
is
(7)
The results of a large amount of experiments demonstrate that the new filter parameter is well-distributed in the interval of [0, 1], and therefore can better reflect the phase noise in the interferogram. Besides, in the new algorithm, the filtering patch size, which is fixed in the Goldstein filter and its previous modifications, is also designed to adaptively change according to the local SNR. This operation is expected to increase the adaption of the filtering strength in the phase noise reduction. As the patch size can only be the index numbers of 2 in the Goldstein algorithm [21], e.g. 32, 64 and 128, the relation between the patch size and local SNR is established by a linear model: S patch
Rrevise 7 2 r max( Rrevise ) 2
(8)
where Spatch represents the filtering patch size, r(·) is the round-off operator. Note that the filtering strength is more sensitive to the filtering patch size than the filtering parameter [21]. In order to prevent the loss of the phase signal caused by
the excessive filtering strength, a second-iteration filtering operation is also introduced in this new algorithm. The phase difference between the original and the filtered interferogram is filtered again with the new SNR-based algorithm, and then added back to the previously filtered interferogram to produce the final filtered interferogram. In such a way, the SAR interferogram can be filtered with sufficient adaption, i.e., the areas with low SNR are strongly filtered, while those with high SNR are weakly filtered.
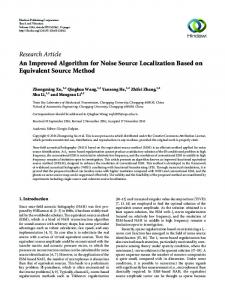
4 Validation with simulated data The performance of presented new filter was analyzed with simulated interferometric datasets in this section and with real interferometric datasets in the next. To assess the validity of the new filter, the Goldstein, Baran and SNR filters were applied to these datasets for comparison. The smoothing operator S{·} was set as a mean kernel of 3×3 pixels. The patch size was chosen as 32×32 pixels in Goldstein, Baran and SNR filters, and the overlap was 14 pixels. In addition, 0.7 was used for the Goldstein filter. For the sake of making the simulation as real as possible, a DEM shown in Fig. 1(a) was firstly simulated by using multifractal technique with a size of 650×650 pixels, where the highest elevation was about 700 m. The “true” interferometric phases were simulated with the ERS-1/2 imaging parameters and a perpendicular baseline of 100 m, and then wrapped from −π to π [28]. Besides, the coherence map shown in Fig. 1(b) was simulated considering three main decorrelation factors, i.e., thermal (sensor manual), geometrical (DEM) and temporal (fractal surface) [22]. Finally, the interferometric phase noises for 1-look interferogram were simulated and added to the “true” interferometric phases (Fig. 1(c)) to produce the simulated interferogram [28]. Four criteria were used to evaluate the performance of the filters in the following simulated and real experiments: 1) Mean of phase standard deviation (Pmean) [16] GOLDSTEIN et al proposed Pmean as a very meaningful measurement for the noise in interferometric phase. Pmean can be estimated directly from both filtered and unfiltered interferograms. The smaller the value of Pmean, the better the reduction of phase noise is. 2) Sum of phase difference (Swhole) [29] p 1 q 1
S whole Alocal ( x, y )
(9)
x 0 y 0
1 1 1 Alocal ( x, y ) ( x, y ) ( x l , y k ) 8 l 1 k 1
(10)
J. Cent. South Univ. (2013) 20: 1896−1903
1899
where φ(x, y) is the filtered interferometric phase. The smaller the value of Swhole, the better the performance of the filter algorithm is. 3) Residue (phase singularity) (Re) [22] Phase residue is defined as the discontinuous phase due to the noise in the interferogram. The more the residuals, the more the difficulties in unwrapping operation. 4) Root mean square error (Rmean) Rmean is a very important criterion for assessing the filtering performance for the simulated data: M 1N 1
Rmean
(i, j ) 2 i 0 i 0
MN
(11)
where Δφi, j is the difference between the “true” and filtered interferometric phases. The smaller the value of RMSE, the better the filter. Figure 2 shows the simulated interferogram with noise and the interferograms filtered with different filters. It is clear that the fringes in Figs. 2(b)−(e) become more distinguishable than those in Fig. 2(a), which illustrates the improvements after processing with the filters. Nevertheless, by comparing Fig. 2(e) with Fig. 2(b) and 2(c), it is found that the fringes filtered with the new SNR algorithm are contaminated by less noise than those filtered with the Goldstein and Baran algorithms, especially in the area enclosed by the black rectangular, which shows low coherence according to Fig. 1(b). Besides, careful observation reveals that the fringes filtered with new algorithm (Fig. 2(e)) are more continuous and have better edge preservation properties than those filtered with the SNR algorithm (Fig. 2(d)). The above-mentioned evaluating criteria were applied for the quantitative comparisons. From the statistical results (Table 1), the most obvious improvement is the number of residues, which decreases from 81 540/81 520 to 54/54 after filtering with new algorithm. The reduction of about 99.9% is achieved. The improvements of the new filter are also evident in terms of other criteria. For Swhole values, the improvements with the Goldstein, Baran, SNR filter and new filter are 49.6%, 27.1%, 70.5% and 79.5%, respectively. Although the criteria of Pmean and Rmean are similar for the SNR filter and the new filter, the improvement is obvious compared to the others.
5 Application to L’Aquila earthquake
Fig. 1 Simulated DEM (a), simulated coherence map (b) and simulated “true” interferometric phases (c)
A pair of ENVISAT ASAR descending images (Track: 00079; Orbits: 36 205 and 37 207) acquired on 1 February and 12 April 2009 was used to analyze the performance of the new algorithm. As the 2009 Italy L’
J. Cent. South Univ. (2013) 20: 1896−1903
1900
Fig. 2 Interferograms: (a) Simulated interferogram with noise; (b) Interferograms filtered with Goldstein filter; (c) Interferograms filtered with Baran filter; (d) Interferograms filtered with SNR filter; (e) Interferograms filtered with new filter Table 1 Statistical results of filter evaluations with simulated data Method No filter Goldstein filter Baran filter SNR filter New filter
Re point (+) 81 540 2 335 9 188 65 54
Re point (−) 81 520 2 334 9 189 65 54
Swhole/Rad
Pmean/Rad
Rmean/Rad
5
1.674 4
1.485 1
1.607 1×10
5
1.047 9
1.245 1
2.322 5×10
5
1.337 2
1.345 2
9.393 9×10
4
0.737 9
1.096 6
6.525 3×10
4
0.783 4
0.972 1
3.187 1×10
J. Cent. South Univ. (2013) 20: 1896−1903
Aquila earthquake was covered by the interferometric pair, the new filter can be tested with the derivation of coseismic surface displacement. The perpendicular baseline of the SAR pair was about 150 m. Multi-looking operation was carried out on the interferogram with five pixels in the azimuth and one pixel in the range direction. The 3-arcsecond SRTM data were exploited to remove the topographic phase in the interferogram. Figure 3 shows the derived differential interferogram. The rectangular outlines the study area, the near filed of the L’ Aquila earthquake. As most of the area is covered by steep mountains and thick vegetation, serious decorrelations arise in the interferogram, which induce much more noises than the simulated one. Figures 4(a)−(e) show the original differential
1901
Fig. 3 Differential interferogram covering L’ Aquila earthquake (Rectangular outlines study area)
Fig. 4 Differential interferograms: (a) Original; (b) Filtered with Goldstein filter; (c) Filtered with Baran filter; (d) Filtered with SNR filter; (e) Filtered with new filter
J. Cent. South Univ. (2013) 20: 1896−1903
1902
interferogram and the filtered versions by the Goldstein, Baran, SNR and new filters, respectively. It can be seen from the results that new filter makes the noisy interferogram much clearer than the other filters. We also can find that the fringes in Fig. 4(e) are more continuous than the interferograms filtered with Goldstein, Baran, and SNR filters. Although the new filter also does not work well in the area completely contaminated by noises, e.g. the top left and bottom right areas, the fringes can be better identified after being processed with the new filter in the areas with dense fringes. The statistical results for the real case are listed in Table 2. It is found that the new filter has 46.1% and 32.9% improvements for the evaluation criteria of Re and Swhole, compared to 32.1% and 0.06% by the Goldstein filter, 36.7% and 0.07% by the Baran filter, and 42.7% and 0.08% by SNR filter. More than 32% improvements in the value of Swhole, which represents better preservation of the edge of fringes, are consistent with the simulated results. The values of Pmean have similar improvements with the new filter. Although the real data of L’ Aquila earthquake is with serious loss of coherence, the improvements with the new filter still perform better to its competitors.
Acknowledgements The ENVISAT ASAR acquisitions were provided by the European Space Agency (ESA) under AO-4458, 4914 projects.
References [1]
[2]
[3]
[4]
[5]
Table 2 Statistical results of filter evaluations with real data Method
Re points (+)
Re points (−)
Swhole/ Rad
Pmean/ Rad
No filter
235 142
235 163
3.299 5×10⁵ 1.742 2
Goldstein filter
159 732
159 743
3.091 1×10⁵ 1.575 6
Baran filter
148 951
148 961
3.060 8×10⁵ 1.550 5
SNR filter
134 677
134 685
3.004 9×10⁵ 1.468 7
New filter
126 760
126 755
2.213 0×105 1.426 9
[6]
[7]
[8]
6 Conclusions 1) To reduce phase noises more adaptively and sufficiently, the modified Goldstein filter algorithm based on local SNR, which is redefined according to the local statistic characteristics of the interferometric phase, is further improved. 2) A new filtering parameter is constructed with the revised local SNR and the filtering patch size which is fixed in the Goldstein filter and its previous modifications is designed to adaptively vary with the local SNR. Besides, a second-iteration filtering operation is introduced in the new filter to minimize the loss of phase signal while reducing the phase noise. 3) The qualitative and quantitative analyses show good agreement with experimental results and demonstrate that the new filter outperforms the commonly used Goldstein, Baran filters and the previous SNR filter.
[9]
[10]
[11]
[12]
[13]
MADSEN S N, ZEBKER H A, MARTIN J. Topographic mapping using radar interferometry: Processing techniques [J]. IEEE Transactions on Geoscience and Remote Sensing, 1993, 31(1): 246−256. MASSONNET D, ROSSI M, CARMONA C, ADRAGNA F, PELTZER G, FEIGL K L, RABAUTE, T. The displacement field of the Landers earthquake mapped by radar interferometry [J]. Nature, 1993, 364: 138−142. WANG Yong-zhe, ZHU Jian-jun, OU Zi-qiang, LI Zhi-wei, XING Xue-min. Coseismic slip distribution of 2009 L’Aquila earthquake derived from InSAR and GPS data [J]. Journal of Central South University, 2012, 19: 244−251. HU Jun, LI Zhi-wei, DING Xiao-li, ZHU Jian-jun, ZHANG Lei, SUN Qian. 3D coseismic displacement of 2010 Darfield, New Zealand earthquake estimated from Multi-Aperture InSAR and D-InSAR measurements [J]. Journal of Geodesy, 2012, 86: 1026− 1041 SUN Qian, LI Zhi-wei, DING Xiao-li, ZHU Jian-jun, HU Jun. Multi-Temporal InSAR data fusion for investigating mining subsidence [C]// Proc of the 2011 International Symposium on Image and Data Fusion. Tengchong, China, 2011: 1−4. HAY-MAN NG A, GE Lin-lin, ZHANG Kui, LI Xiao-jing. Estimating horizontal and vertical movements due to underground mining using ALOS PALSAR [J]. Engineering Geology, 2012, 143/144: 18−27. CHEN Qiang, LIU Guo-xiang, DING Xiao-li, HU Jyr-ching, YUAN Ling-guo, ZHONG Ping, OMURA M. Tight integration of GPS observations and persistent scatterer InSAR for detecting vertical ground motion in Hong Kong [J]. International Journal of Applied Earth Observation and Geoinformation, 2010, 12(6): 477−486. ZAGAS T, TSITSONI T, GANATSAS P, TSAKALDIMI M, SKOTIDAKIS T, ZAGAS D. Land reclamation and ecological restoration in a marine area [J]. International Journal of Environmental Research, 2010, 4(4): 673−680. GOLDSTEIN R M, ENGELHARDT H, KAMB B, FROLICH R M. Satellite radar interferometry for monitoring ice sheet motion: Application to an Antarctic ice stream [J]. Science, 1993, 262: 1525−1530. KUMAR V, VENKATARAMANA G, HOGDA K A. Glacier surface velocity estimation using SAR interferometry technique applying ascending and descending passes in Himalayas [J]. International Journal of Applied Earth Observation and Geoinformation, 2011, 13(4): 545−551. GOURMELEN N, KIM S W, SHEPHERD A, PARK J W, SUNDAL A V, BJORNSSON H, PALSSON F. Ice velocity determined using conventional and multiple-aperture InSAR [J]. Earth and Planetary Science Letters, 2011, 307(1/2): 156−160. PRATI C, FERRETTI A, PERISSIN D. Recent advances on surface ground deformation measurement by means of repeated space-borne SAR observations [J]. Journal of Geodynamics, 2010, 49(3/4): 161−170. GOLDSTEIN R M, ZEBKER H A, WERNER C L. Satellite radar interferometry: Two dimensional phase unwrapping [J]. Radio Science, 1988, 23: 713−720.
J. Cent. South Univ. (2013) 20: 1896−1903 [14]
[15]
[16]
[17]
[18]
[19]
[20]
[21]
[22]
SHANKER A P, ZEBKER H. Edgelist phase unwrapping algorithm for time series InSAR analysis [J]. Journal of the Optical Society of America. A, 2010, 27(3): 605−612. ZEBKER H A, VILLASENOR J. Decorrelation in interferometric radar echoes [J]. IEEE Transactions on Geoscience and Remote Sensing, 1992, 30: 950−959. MARTINEZ-ESPLA J J, MARTINES-MARIN T, LOPEZSANCHEZ J M. Introduction of a grid-based filter to solve InSAR phase unwrapping [C]// Proceedings of IGARSS 2007. Barcelona, Spain, 2007: 4497−4500. LOFFELD O, NIES H, KNEDLIK S, YU W. Phase unwrapping for SAR interferometry—A data fusion approach by Kalman filtering [J]. IEEE Transactions on Geoscience and Remote Sensing, 2008, 46(1): 47−58. ZOU Wei-bao, LI Yan, LI Zhi-lin, DING Xiao-li. Improvement of the accuracy of InSAR image co-registration based on tie points—A review [J]. Sensors, 2009, 9(2): 1259−1281. LI Dong, ZHANG Yuan-hua. A fast offset estimation approach for InSAR image subpixel registration [J]. IEEE Transactions on Geoscience and Remote Sensing, 2011, 9(2): 267−271. BEZERRA-CANDEIAS A L, MURA J C, DUTRA L, MOREIRA J R. Interferogram phase noise reduction using morphological and modified median filters [C]// Proceedings of IGARSS’95. Firenze, Italy, 1995: 166−168. GOLDSTEIN R M, WERNER C L. Radar interferogram filtering for geophysical applications [J]. Geophysical Research Letters, 1998, 25(21): 4035−4038. BARAN I, STEWART M P, KAMPES B M, PERSKI Z, LILLY P. A
1903
[23]
[24]
[25]
[26] [27] [28]
[29]
modification to the Goldstein radar interferogram filter [J]. IEEE Transactions on Geoscience and Remote Sensing, 2003, 41(9): 2114−2118. LI Zhi-wei, DING Xiao-li, ZHENG Da-wei, HUANG Cheng. Least squares-based filter for remote sensing image noise reduction [J]. IEEE Transactions on Geoscience and Remote Sensing, 2008, 46(7): 2044−2049. LI Zhi-wei, DING Xiao-li, HUANG Cheng, ZHU Jian-jun, CHEN Yan-lin. Improved filtering parameter determination for the Goldstein radar interferogram filter [J]. ISPRS Journal of Photogrammetry and Remote Sensing, 2008, 63(6): 621−634. SUN Qian, ZHU Jian-jun, LI Zhi-wei, YIN Hong-jie, HU Bo, JIANG Mi. A new adaptive InSAR interferogram filter based on SNR [J]. Acta Geodaetica et Cartographica Sinica, 2009, 38(5): 437−442. (in chinese) BAMLER R, HARTL P. Synthetic aperture radar interferometry [J]. Inverse Problem, 1998, 14(4): R1−R54. ZOU Mou-yan. Deconvolution and signal recovery [M]. Beijing: Defense Industry Press, 2001. (in Chinese) LI Zhi-wei, DING Xiao-li, HUANG Cheng, ZOU Wei-bao, SHEA Y K. Filtering method for SAR interferograms with strong noise [J]. International Journal of Remote Sensing, 2006, 27(14): 2991−3000. LI Zhi-lin, ZOU Wei-bao, DING Xiao-li, Chen Yong-qi, Liu Guo-xiang. A quantitative measure for the quality of InSAR interferograms based on phase differences [J]. Photogrammetric Engineering and Remote Sensing, 2004, 70(10): 1131−1137. (Edited by YANG Bing)