AFRL-RZ-WP-TR-2008-2197 IMPROVED KINETIC MODELS FOR HIGH-SPEED COMBUSTION SIMULATION C.J. Montgomery, Q. Tang, A.F. Sarofim, M.J. Bockelie, J.K. Gritton, J.W. Bozzelli, F.C. Gouldin, E.M. Fisher, and S. Chakravarthy
Reaction Engineering International
JUNE 2008 Final Report THIS IS A SMALL BUSINESS TECHNOLOGY TRANSFER (STTR) PHASE II REPORT.
Approved for public release; distribution unlimited. See additional restrictions described on inside pages
AIR FORCE RESEARCH LABORATORY PROPULSION DIRECTORATE WRIGHT-PATTERSON AIR FORCE BASE, OH 45433-7251 AIR FORCE MATERIEL COMMAND UNITED STATES AIR FORCE
NOTICE AND SIGNATURE PAGE Using Government drawings, specifications, or other data included in this document for any purpose other than Government procurement does not in any way obligate the U.S. Government. The fact that the Government formulated or supplied the drawings, specifications, or other data does not license the holder or any other person or corporation; or convey any rights or permission to manufacture, use, or sell any patented invention that may relate to them. This report was cleared for public release by the USAF 88th Air Base Wing (88 ABW) Public Affairs Office (PAO) and is available to the general public, including foreign nationals. Copies may be obtained from the Defense Technical Information Center (DTIC) (http://www.dtic.mil). AFRL-RZ-WP-TR-2008-2197 HAS BEEN REVIEWED AND IS APPROVED FOR PUBLICATION IN ACCORDANCE WITH ASSIGNED DISTRIBUTION STATEMENT.
*//Signature//
//Signature//
_________________________________________
________________________________________
DEAN R. EKLUND, Project Manager Propulsion Technology Branch Aerospace Propulsion Division
PATRICIA PEARCE, Chief Aerospace Propulsion Division Propulsion Directorate
//Signature//
_________________________________________
ROBERT MERCIER, Deputy for Technology Aerospace Propulsion Division Propulsion Directorate
This report is published in the interest of scientific and technical information exchange and its publication does not constitute the Government’s approval or disapproval of its ideas or findings. *Disseminated copies will show “//Signature//” stamped or typed above the signature blocks.
Committed Individuals Solving Challenging Problems
REACTION
ENGINEERING INTERNATIONAL
September 17, 2008 Dr. Dean Eklund Aerospace Propulsion Division (AFRLIPRAT) 1950 Fifth Street Wright-Patterson AFB OH 45433-7251 Phone: (937) 255-0632 Fax: (937) 656-4659 RE: Contract No. FA8650-06-C-2658, Phase II STTR "Improved Kinetic Models for High Speed Combustion Simulation" Reaction Engineering International (REI) hereby waives its STTR Data Rights to all contents of the final report for subject contract. The Government is granted an unlimited nonexclusive license to use, modify, reproduce, release, perform, and display or disclose this report and the data contained herein. The report has been reviewed and we grant approval for public release, distribution unlimited. Any questions concerning this matter should be addressed to the attention of Dr. Mike Bockelie at (801)-364-6925 ext. 22. Regards, Michael J. Bockelie, Ph.D.
Executive Vice President CC: Dr. Chris Montgomery (REI), REI Project File 4790
77 West 200 South, Suite 210, Salt Lake City, Utah 84101
Telephone: (801) 364-6925 ext. 22 . FAX: (801) 364-6977
[email protected] http://www.reaction-eng.com
Form Approved OMB No. 0704-0188
REPORT DOCUMENTATION PAGE
The public reporting burden for this collection of information is estimated to average 1 hour per response, including the time for reviewing instructions, searching existing data sources, searching existing data sources, gathering and maintaining the data needed, and completing and reviewing the collection of information. Send comments regarding this burden estimate or any other aspect of this collection of information, including suggestions for reducing this burden, to Department of Defense, Washington Headquarters Services, Directorate for Information Operations and Reports (0704-0188), 1215 Jefferson Davis Highway, Suite 1204, Arlington, VA 22202-4302. Respondents should be aware that notwithstanding any other provision of law, no person shall be subject to any penalty for failing to comply with a collection of information if it does not display a currently valid OMB control number. PLEASE DO NOT RETURN YOUR FORM TO THE ABOVE ADDRESS.
1. REPORT DATE (DD-MM-YY)
2. REPORT TYPE
June 2008
3. DATES COVERED (From - To)
Final
18 May 2006 – 18 June 2008
4. TITLE AND SUBTITLE
5a. CONTRACT NUMBER
FA8650-06-C-2658
IMPROVED KINETIC MODELS FOR HIGH-SPEED COMBUSTION SIMULATION
5b. GRANT NUMBER 5c. PROGRAM ELEMENT NUMBER
65502D 6. AUTHOR(S)
5d. PROJECT NUMBER
C.J. Montgomery, Q. Tang, A.F. Sarofim, M.J. Bockelie, and J.K. Gritton (Reaction Engineering International) J.W. Bozzelli (New Jersey Institute of Technology) F.C. Gouldin and E.M. Fisher (Cornell University) S. Chakravarthy (Metacomp Technologies, Inc.) 7. PERFORMING ORGANIZATION NAME(S) AND ADDRESS(ES)
Reaction Engineering International 77 West 200 South, Suite 210 Salt Lake City, UT 84101
1205 5e. TASK NUMBER
PA 5f. WORK UNIT NUMBER
1205PA00 8. PERFORMING ORGANIZATION REPORT NUMBER
New Jersey Institute of Technology -----------------------------------------------------Cornell University -----------------------------------------------------Metacomp Technologies, Inc.
9. SPONSORING/MONITORING AGENCY NAME(S) AND ADDRESS(ES)
4790
10. SPONSORING/MONITORING AGENCY ACRONYM(S)
Air Force Research Laboratory Propulsion Directorate Wright-Patterson Air Force Base, OH 45433-7251 Air Force Materiel Command United States Air Force
AFRL/RZAT 11. SPONSORING/MONITORING AGENCY REPORT NUMBER(S)
AFRL-RZ-WP-TR-2008-2197
12. DISTRIBUTION/AVAILABILITY STATEMENT
Approved for public release; distribution unlimited. 13. SUPPLEMENTARY NOTES
This is a Small Business Technology Transfer (STTR) Phase II Report. Report contains color. STTR data rights have been waived. PAO Case Number: 88abw-2008-0301; Clearance Date: 25 Sep 2008. See also AFRL-RZ-WP-TR-2008-2224, which contains proprietary files referenced in the appendices of this report. 14. ABSTRACT
Report developed under an STTR contract. The overall goal of this STTR project has been to improve the realism of chemical kinetics in computational fluid dynamics modeling of hydrocarbon-fueled scramjet combustors. A new, pressure-dependent detailed chemical kinetic model for a JP-8 surrogate has been created. Extinction strain rate measurements have been performed with an opposed-jet burner at subatmospheric conditions for a variety of fuels, namely: methane, ethylene, n-heptane, Jet A, n-decane, trimethylbenzene, and blends of n-decane and trimethylbenzene. Skeletal and quasi-steady-state (QSS) reduced mechanisms have been created based on the new mechanism and mechanisms from the literature for ethylene, JP-8, and n-decane. Parallel strategies for the in situ adaptive tabulation (ISAT) algorithm have been implemented and tested. Reduced mechanisms and ISAT have been demonstrated in the CFD++ and VULCAN CFD codes. 15. SUBJECT TERMS
STTR Report, scramjet, combustion, reduced chemical kinetic mechanisms, ethylene, n-decane, 1,2,4 trimethylbenzene, JP-8, counterflow extinction, CFD, ISAT, CARM, surrogate fuels 16. SECURITY CLASSIFICATION OF: a. REPORT
b. ABSTRACT
Unclassified Unclassified
c. THIS PAGE
Unclassified
17. LIMITATION 18. NUMBER OF ABSTRACT: OF PAGES
SAR
166
19a. NAME OF RESPONSIBLE PERSON (Monitor)
Dr. Dean R. Eklund 19b. TELEPHONE NUMBER (Include Area Code)
N/A Standard Form 298 (Rev. 8-98) Prescribed by ANSI Std. Z39-18
i
Table of Contents Section
Page
List of Figures ..................................................................................................................................v List of Tables ............................................................................................................................... viii 1. Executive Summary ....................................................................................................................1 2. Introduction .................................................................................................................................3 3. Methods, Assumptions and Procedures ......................................................................................5 3.1 Surrogate Fuel Blends ...................................................................................................5 3.2 Chemical Kinetics Improvements .................................................................................6 3.2.1 Submechanism for C1, C2, and C3 Hydrocarbon and Oxy-Hydrocarbon Species .....................................................................................................................8 3.2.2 Kinetics of Normal Alkanes: Pentane, Heptane, Decane ............................15 3.2.3 Mechanism for TMB and Other Methyl-Substituted Aromatics .................17 3.3 Opposed Flow Extinction Experiments .....................................................................27 3.3.1 Burner and Associated Equipment...............................................................27 3.3.2 Temperature Control ....................................................................................29 3.3.3 Velocity Profiles .........................................................................................31 3.3.4 Method of Approaching Extinction .............................................................33 3.3.5 Characterizing Extinction Conditions ..........................................................34 3.3.6 Materials and Fuel Stability Tests................................................................34 3.3.7 Operating Conditions ..................................................................................39 3.4 Mechanism Reduction ................................................................................................40 3.4.1 Skeletal Mechanism Development ..............................................................40 3.4.2 Mechanism Reduction using QSS Assumptions..........................................41 3.5 Chemical Source Term Tabulation using ISAT..........................................................41 3.5.1 Multiprocessor ISAT Strategies ...................................................................42 3.6 CFD Demonstration ....................................................................................................43 3.6.1 The CFD++ CFD Code ................................................................................43 3.6.2 The VULCAN CFD Code ...........................................................................44 4 Results and Discussion ..............................................................................................................45 4.1 Chemical Kinetics Improvements ..............................................................................45 4.1.1 Small Molecule Validation: Methanol ..........................................................45 4.1.2 Kinetics of Other Small Molecules ...............................................................48 4.1.3 Formation of C2 Species ...............................................................................50 4.1.4 Comparisons of Mechanism to Experimental Results ..................................63 4.2 Opposed Flow Extinction Experiments ......................................................................94 4.2.1 Methane and Ethylene..................................................................................98 4.2.2 Temperature Profile ...................................................................................100 4.3 Modeling of Counterflow Extinction Experiments...................................................101 4.4 Mechanism Reduction ..............................................................................................105 4.5 Chemistry Tabulation (ISAT) ...................................................................................112 4.6 CFD Demonstration ..................................................................................................116 4.6.1 CFD ++ Results .........................................................................................116 4.6.2 VULCAN Results ......................................................................................117
iii
4.7 Technology Transfer .................................................................................................120 5. Conclusion ..............................................................................................................................122 6. Recommendations ...................................................................................................................123 References ....................................................................................................................................124 Appendix A: List of Cross Reactions ..........................................................................................130 Appendix B1: Bozzelli_Detailed_TMB-NC10_chem.inp ...........................................................131 Appendix B2: Bozzelli_Detailed_TMB-NC10_therm.dat ..........................................................132 Appendix B3: Bozzelli_Detailed_TMB-NC10_tran.dat .............................................................133 Appendix C1:Violi_Detailed_JP-8_chem.inp .............................................................................134 Appendix C2:Violi_Detailed_JP-8_therm.dat .............................................................................135 Appendix C3:Violi_Detailed_JP-8_tran.dat ................................................................................136 Appendix D1: Bozzelli_Skeletal_N-Decane_chem.inp...............................................................137 Appendix D2: Bozzelli_Skeletal_N-Decane_therm.dat ..............................................................138 Appendix D3: Bozzelli_Skeletal_N-Decane_tran.dat .................................................................139 Appendix E1:Violi_Skeletal_JP-8_chem.inp ..............................................................................140 Appendix E2:Violi_Skeletal_JP-8_therm.dat ..............................................................................141 Appendix E3:Violi_Skeletal_JP-8_tran.dat .................................................................................142 Appendix F1: USC_Skeletal_Ethylene_chem.inp .......................................................................143 Appendix F2: USC_Skeletal_Ethylene_therm.dat ......................................................................144 Appendix F3: USC_Skeletal_Ethylene_tran.dat .........................................................................145 Appendix G: Bozzelli_Reduced_Decane25.f90 ..........................................................................146 Appendix H: Bozzelli_Reduced_Decane30.f90 ..........................................................................147 Appendix I: Violi_Reduced_JP-8-30.f90 ....................................................................................148 Appendix J: Wang_Reduced_Ethylene19.f90 .............................................................................149 Appendix K: Wang_Reduced_Ethylene21.f90 ............................................................................150 Appendix L: REIISAT_src ..........................................................................................................151
iv
List of Figures Figure
Page
1. Experimentally Determined Relationship between Temperature at Ignition and Flame Strain Rate ..............................................................................................................................................6 2. Enthalpy Diagram for HCO3• System Calculated by Composite CBS-QB3 Method...............14 3. Production of CO and CC≡C via Elimination Reactions .........................................................19 4. Multi-Step, Sequential Process Leading to Formation of Phenyl from Benzyl (Scheme 1) ....20 5. Generic Chemical Activation Reaction System (Scheme 2) ....................................................21 6. Potential Energy Diagram for Methylphenyl + O2 Reaction ....................................................23 7. Schematic of Opposed-Jet Diffusion Flame Burner Apparatus ................................................27 8. Schematic of Thermocouple Used for Flame Temperature Measurements..............................29 9. Cold Flow Jet Exit Velocity Profiles Obtained with PIV for Configuration B ........................30 10. Cold Flow Jet Exit Velocity Profiles Obtained with PIV for Configuration C ......................30 11. Exit, Axial Velocity Profile with No Thermocouple in Place ................................................31 12. Exit, Axial Velocity Profile with Fine Wire Thermocouple Present ......................................32 13. Radial Profiles of Axial Velocity at 0.2 mm Downstream of Oxidizer Tube Exit .................33 14. Chromatograms (Total Ion Count) for Liquid and Vaporized Jet Fuel Samples ....................37 15. Representative Closeup Chromatograms of Shorter Time Ranges.........................................38 16. Diagram of Local ISAT Strategy ............................................................................................42 17. Diagram of the URan (Uniform Random Distribution) ISAT Strategy .................................43 18. PE Diagram of First O2 Addition to Secondary N-Pentyl-2 Radical ......................................54 19. Fragment of the PE Diagram of Oxygenation of 2-Hydroperoxide-N-Pent-4-yl Radical ......56 20. Detailed PE Diagram for Oxygenation of 2-Hydroperoxy-4-N-Pentyl ..................................57 21. Rate Constants of First Chemical Activation Reactions (PN-2J+O2) ....................................59 22. Temperature Dependence of Dissociation Rate Constants for PN-2QJ Adduct.....................60 23. Rate Constants of Second Chemical Activation Reactions (PN-2Q4J + O2) at 1 atm Pressure ..........................................................................................................................................61 24. Temperature Dependence of Dissociation Rate Constants for PN-2Q4QJ Adduct, at 1 atm Pressure ..........................................................................................................................................61 25. Rate Constants of Second Chemical Activation Reactions (DC-2Q4J + O2) as Function of Temperature at 1 atm Pressure .......................................................................................................62 26. Comparison of Model and Experimental Data for Methanol Pyrolysis at 1073 K, 1 atm and Initial Methanol Mole Fraction of 3.95% ......................................................................................64 27. Comparison of Model and Experimental Data for Methanol Pyrolysis at 1073 K, 3 atm and Initial Methanol Mole Fraction of 1.317% ....................................................................................65 28. Comparison of Model and Experimental Data for Methanol Oxidation at 873 K, 5 atm, = 1.0 and Initial Methanol Mole Fraction of 0.78% .........................................................................67 29. Comparison of Model and Experimental Data for Methanol Oxidation at 923 K, 3 atm, = 1.0 and Initial Methanol Mole Fraction of 0.78% .........................................................................68 30. Comparison of Model and Experimental Data for Methane/Methanol Mixture Oxidation at 873 K, 5 atm, = 1.0 and X0(CH4) = 0.78%, X0(CH3OH) = 0.78% ............................................69 31. Comparison of Model and Experimental Data for Methane/Methanol Mixture Oxidation at 873 K, 5 atm, = 1.0 and X0(CH4) = 0.39%, X0(CH3OH) = 0.39% ...........................................70 32. Comparison of Model Results to Experiments of Aronowitz et al .........................................72 v
33. Comparison of Model and Experimental Data from Held/Dryer at 1043 K, 2.1 atm, = 0.86 and X0(CH3OH) = 0.00344 ............................................................................................................74 34. Comparison of Model and Experimental Data from Held/Dryer at 1043 K, 2.1 atm, = 0.86 and X0(CH3OH) = 0.00344 ............................................................................................................75 35. Comparison of Model and Experimental Data from Held/Dryer at 949 K, 2.5 atm, = 0.83 and X0(CH3OH) = 0.00333 ............................................................................................................76 36. Comparison of Model and Experimental Data from Held/Dryer at 810 K, 10.0 atm, = 0.42 and X0(CH3OH) = 0.00415 ....................................................................................................78 37. Comparison of Model and Experimental Data from Held/Dryer at 783 K, 15.0 atm, =1.04 and X0(CH3OH) = 0.00415 ............................................................................................................79 38. Comparison of Model and Experimental Data from Held & Dryer at 781 K, 15.0 atm, =2.59 and X0(CH3OH) = 0.00415 ..................................................................................................80 39. Comparison of Modeling Results to Vandooren and van Tigglen’s Flame I Data Set...........82 40. Comparison of Modeling Results to Vandooren and van Tigglen’s Flame II Data Set .........84 41. C2H5 + O2 Reaction System - Comparison of W. Kaiser's Data at a Constant Molecular Density of 4.8 x 10¹⁸ molecule/cc with MEA and MSC Models ................................................. 85 42. Comparison of % C2H4 Yield From Kaiser’s Data and NJIT Model .....................................86 43. Comparison of Master Equation and Modified Strong Collision Model Predictions with Data for Total HO2 Formation ................................................................................................................87 44. Comparisons of Various Chemical Kinetic Mechanisms to Rapid Compression Machine Ignition Data at Various Pressures .................................................................................................88 45. Comparison of NJIT mechanism Predictions for Laminar Flame Speed Data for NHeptane/Air Mixtures to Experiments ...........................................................................................89 46. Comparison of the Predicted and Experimental Values for Ignition Delay of N-Heptane ....90 47. Comparison of Calculated Ignition Delays Using the NJIT Mechanism to the Experimental Results of Ciezki & Adomeit, and Minetti et al.............................................................................90 48. Comparison of the NJIT N-Decane/TMB Mechanism to the N-Decane Ignition Delay Measurements of Pfahl & Adomeit and Hornung et al..................................................................91 49. Comparison of the NJIT N-Decane/TMB Mechanism to the O-Xylene Ignition Delay Measurements of Battin-Leclerc et al ............................................................................................92 50. Comparison of the NJIT N-Decane/TMB Mechanism to the M-Xylene Ignition Delay Measurements of Battin-Leclerc et al ............................................................................................92 51. Comparison of Detailed and Skeletal Mechanisms to Ignition Delay Measurements............93 52. Comparison of Detailed and Skeletal Mechanisms to Ignition Delay Measurements............94 53. Extinction Strain Rates for Methane vs. Air as a Function of Pressure: Effect of Heating the Fuel Stream ....................................................................................................................................95 54. Extinction Strain Rates for Ethylene (red circles) and Methane (blue squares) as Functions of Pressure. ........................................................................................................................................ 96 55. Extinction Strain Rates for Ethylene and Methane as Functions of Pressure. Filled and Open Symbols Represent Data Sets Acquired on Different Days...........................................................96 56. Extinction Strain Rates for N-Heptane in N2 vs. Enriched Air (red circles), and N-Heptane in Methane vs. Air (blue squares), as Functions of Pressure .............................................................97 57. Extinction Strain Rates for N-Heptane in Methane vs. Air (blue squares) Compared to Pure Methane vs. Air (red circles), as Functions of Pressure ................................................................97 58. Extinction Strain Rates for Decane (red circles) and TMB (blue squares) as Functions of Pressure ..........................................................................................................................................98
vi
59. Extinction Strain Rates for Jet-A as a Function of Pressure ...................................................99 60. Extinction Strain Rates for Jet-A (red circles) and a 60/40 (by Liquid Volume) Blend of Decane and Trimethyl Benzene (blue squares), as Functions of Pressure ....................................99 61. Extinction Strain Rates for Jet-A and a 80/20 (by Liquid Volume) Blend of Decane and TMB, as Functions of Pressure ....................................................................................................100 62. Near-Centerline Temperature Profile Measured in a Flame Consisting of Ethylene in Nitrogen vs. Air .......................................................................................................................... 101 63. Comparison of Models and Experiments for the Methane Opposed Flow Flames ..............102 64. Comparison of Models and Experiments for the Ethylene Opposed Flow Flames ..............102 65. Comparison of Models and Experiments for the N-Heptane Opposed Flow Flames...........103 66. Comparison of Models and Experiments for the N-Decane Opposed Flow Flames ............104 67. Comparison of Models and Experiments for the Jet-A Opposed Flow Flames ...................104 68. Comparison of Calculated Ignition Delay for Ethylene/Air Mixtures for Detailed, Skeletal, and Reduced Mechanisms............................................................................................................106 69. Comparison Calculated Species and Temperature Time Histories for Ethylene/Air ConstantVolume Autoignition Using the Most Recent Detailed, Skeletal and Reduced Mechanisms .....107 70. Comparison of Detailed and Skeletal Mechanisms to Experiments for Kerosene/Jet-A Fuels .............................................................................................................................................108 71. Comparison of Calculated Ignition Delay for JP-8/Air Mixtures for Detailed, Skeletal and Reduced Mechanisms ..................................................................................................................108 72. Comparison Calculated Species and Temperature Time Histories for JP-8/Air ConstantVolume Autoignition Using Detailed, Skeletal and Reduced Mechanisms ................................109 73. Comparison Calculated Species and Temperature Time Histories for Ethylene/Air ConstantVolume Autoignition Using Detailed, Skeletal and Reduced Mechanisms Based on the NJIT Mechanism Developed During this Project .................................................................................110 74. Predicted Flame Structures for a Counterflow Diffusion Flame for Detailed, Skeletal, and Reduced Chemistry ......................................................................................................................111 75. Diagram of Supersonic Diffusion Flame Experiment of Evans et al. (1978) with Increased Inlet Temperatures and Ethylene Fuel .........................................................................................112 76. Temperature Plot and Block Divisions for the 2-D Supersonic Flame Test Case ................113 77. ISAT Speedup Histories for the 25-Species Reduced Mechanism.......................................115 78. ISAT Speedup Histories for the 30-Species Reduced Mechanism.......................................115 79. Comparison of Speedup of 25- and 30-Species Mechanisms for URan ISAT .....................116 80. 2D Supersonic Flame Results Using a 21-Species Reduced Mechanism in the CFD++ CFD Code ........................................................................................................................................... 117 81. 2D Supersonic Flame Results Using a 31-Species Reduced Mechanism based on the Violi et al Detailed Mechanism in the Vulcan CFD Code ........................................................................117 82. Diagram of the RC-18 Scramjet Combustor .........................................................................118 83. Results (Not Completely Converged) for the VULCAN Simulation of the RC-18 Scramjet Combustor Case ...........................................................................................................................119 84. Timing Comparisons for Local ISAT, URAN ISAT and Direct Source Term Evaluation for the RC-18 Scramjet Combustor Case Using a 21-Species Ethylene Reduced Mechanism ........120
vii
List of Tables Table
Page
1. Reactions and Model Fits to Experimental Data are Described in the C1 – C3 Sub-Mechanism Part of this Report ..........................................................................................................................13 2. Thermodynamic Properties for Species in HO2 + CO System ................................................14 3. Rate Parameters for the Abstraction of the Hydrogen from the –CHO Group in C2H3CHO by Different Abstracting Agents .........................................................................................................17 4. Structures and Names for Species Studied on the 2-Methylphenyl Radical + O2 Potential Energy Surface .............................................................................................................................. 24 5. Elementary Rate Parameters (Ea, A, n) for Reactions on the 2-Methylphenyl Radical + O2 Potential Energy Surface Obtained from Ab Initio/DFT Calculations and Transition State Theory ...................................................................................................................................... 25 6. Input Rate Parameters (Ea, A', n) for Use in Kinetic Modeling of the 2-Methylphenyl Radical + O2 Reaction at P = 1 atm ............................................................................................................25 7. Burner Configuration ................................................................................................................28 8. Chemicals Used in Fuel Stream ................................................................................................35 9. Chemicals Used in Oxidant Stream and Sheath Flows .............................................................35 10. Test Conditions for Opposed Jet Diffusion Flame Experiments ........................................... 39 11. Flame Characteristics for Experiments with N-Decane, TMB, Blends, and Jet Fuels ...........40 12. Skeletal and Reduced Mechanisms Created During This Project ........................................105 13. Conditions for Reacting Flow Simulation ............................................................................112 14. Comparison of Single Processor and URan and Local Parallelization Strategies Using an ISAT Tolerance of 1.E-3..............................................................................................................113 15. Comparison URan and Local Parallelization Strategies Using an ISAT Tolerance of 5.E-5 .............................................................................................................................................114 16. CPU Loads for the 25-Species Mechanism ..........................................................................114 17. CPU Loads for the 30-Species Mechanism ......................................................................... 114
viii
1. Executive Summary The overall goal of this STTR project has been to improve the realism of chemical kinetics in computational fluid dynamics (CFD) modeling of hydrocarbon-fueled scramjet combustors. This has been accomplished through
new, pressure-dependent detailed chemical kinetic models for JP-8 surrogates new, subatmospheric extinction measurements improved mechanism reduction techniques chemical source term tabulation techniques for multiprocessor CFD simulations demonstration in commonly used high-speed CFD codes.
Pressure-dependent extinction strain rate measurements have been performed with an opposedjet burner at subatmospheric conditions for a variety of fuels, including methane, ethylene, nheptane, Jet A, n-decane, trimethylbenzene (TMB), and blends of n-decane and TMB. Liquid fuels were vaporized and delivered in a carrier gas, N2 in most cases. Inlet velocity boundary conditions were characterized with particle imaging velocimetry (PIV) measurements. A set of extinction measurements with the heavier liquid hydrocarbons (Jet A, n-decane, TMB, and the blends) were performed with the same burner geometry and temperature control, and with very similar adiabatic flame temperatures and positions of the flame relative to the stagnation plane of the burner, as indicated by the value of the stoichiometric mixture fraction. This choice of conditions allows meaningful direct comparisons of these data sets to be performed. Under those conditions, Jet A flame extinction behavior was very similar to that of the n-decane/TMB blends, indicating the appropriateness of using these blends as surrogates for Jet A. Real fuels are modeled as a surrogate blend consisting of a small number of well-characterized compounds. The surrogate components should be selected to meet the goals of this study, namely, to develop CFD models that can predict the performance metrics for scramjets that include ignition, thrust, combustion efficiency and flame stability. Three fundamental flame properties that provide metrics for these performance goals are as follows:
Ignition delay Heat release rate Flame extinction.
Two-component JP-8 surrogates, consisting of a normal alkane (n-decane or n-dodecane) and a substituted aromatic (m-xylene or 1,2,4 trimethylbenzene (TMB)) are studied in this work. A new detailed chemical kinetic mechanism containing 577 species and 2043 reactions has been developed using modern computational chemistry techniques. It contains pressure-dependent kinetics for JP-8 surrogate components n-decane and TMB, as well as for smaller hydrocarbons such as n-heptane and ethylene and other aromatics such as m- and o-xylene and toluene. The mechanism is fundamental, meaning that the rates of the elementary reaction steps come from quantum mechanical calculations and measurements from the literature. No tuning has been done to achieve agreement with any experimental combustion measurements. Modern computational chemistry techniques are able to calculate thermochemical properties and reaction rates very accurately. Improvements were needed in the pressure dependence of current
1
detailed mechanisms for hydrocarbon combustion, especially at subatmospheric pressures. This is important for scramjet modeling because the pressure in a scramjet combustor may vary from about 0.3 to 4.0 atm. State of the art detailed chemical kinetic mechanisms are too large for direct use in CFD modeling, but form the basis of reduced chemistry models suitable for CFD. Reduced models are created by first creating a skeletal mechanism which retains only the most critical species and reaction steps. Next quasi-steady-state (QSS) assumptions are invoked to further approximate the skeletal mechanism. QSS models exist in the form of Fortran subroutines that iteratively solve the algebraic QSS equations. Genetic optimization is used to select the QSS species that minimize error. Combining this technique with the advanced chemistry source term tabulation technique of in situ adaptive tabulation (ISAT) provides a promising path toward increased chemical realism in high-speed reacting flow simulations. QSS reduced mechanisms and ISAT have been implemented into the CFD codes CFD++ and VULCAN. A 3D dual mode scramjet case (RC-18) has been run using VULCAN with a 21species ethylene reduced mechanism. 2D supersonic jets have been modeled using a JP-8 reduced mechanism in VULCAN and an ethylene reduced mechanism in CFD++. The Major Accomplishments of Phase II are listed below: Chemical Kinetics Improvement – A fundamental, pressure-dependent detailed chemical kinetic mechanism for a JP-8 surrogate was completed and tested. Low-Pressure Extinction Experiments – New experimental measurements were performed for jet fuel and other hydrocarbons. Implementation of ISAT – ISAT routines were implemented and demonstrated with reduced mechanisms in the CFD++ and Vulcan CFD codes. Reduced Mechanism Optimization – New reduced mechanisms for ethylene and JP-8 combustion have been generated that are more accurate and efficient than previous reduced mechanisms.
2
2. Introduction Scramjet propulsion has the potential to power high Mach number flight without the need to carry its own oxidizer like a rocket, thus significantly reducing the flight weight of the vehicle. The ability to burn atmospheric air gives a scramjet a higher specific thrust (Isp, which is the thrust normalized by the propellant mass flow rate) than a rocket. Scramjets are being considered as propulsion systems for single stage to orbit space planes as well as for very high speed civilian transport and military applications. The first application of scramjet technology is likely to be for a non-reusable vehicle (i.e., a missile). The combination of high speed (Mach 815) and small size/low weight compared to a rocket could allow significant payloads to be delivered with a short flight time between launch and arrival at target. Successful scramjetpowered missiles would give a significant military advantage in situations ranging from surface, air, or ship launched cruise missiles to theatre or intercontinental ballistic missile (ICBM) defense systems. Due to the complex physics of scramjet combustion and the difficulty and expense of experimental investigations, numerical simulations will play an increasingly important role in the development of scramjet engines. CFD simulations can give detailed information about the simulated flowfield. They can model conditions that can’t be easily duplicated experimentally and give information on quantities that are difficult to measure. CFD simulations can thus reduce the length and cost of the design cycle and test innovative concepts quickly and inexpensively compared to building and testing prototypes. While hydrogen has fueled the initial scramjet demonstrations, hydrocarbon fuels are advantageous because of their higher energy density and ease of transport. Hydrocarbonpowered scramjets face technical hurdles due to the need for rapid mixing and combustion inside the scramjet combustor. Hydrocarbon combustion simulations are difficult because fully detailed chemical kinetic descriptions of hydrocarbon oxidation may require the tracking of hundreds of chemical species and thousands of reaction steps. CPU and memory limitations prohibit implementation of full detailed chemistry of practical fuels into 3D CFD simulations, even using the latest massively parallel computers. Validated detailed mechanisms, though impractical for implementation into a CFD simulation, are the starting point for creating simplified chemical kinetic models which can be implemented into CFD codes. Creation of detailed chemical kinetic descriptions of the combustion of hydrocarbon blends representing practical fuels is a continuing area of active research1-5. Modern computational chemistry techniques are able to calculate thermochemical properties and reaction rates very accurately. Improvements were needed in the pressure dependence of current detailed mechanisms for hydrocarbon combustion. This is important for scramjet modeling because the pressure in a scramjet combustor may vary from about 0.3 to 4.0 atm. The challenge in formulating a chemical kinetic mechanism for jet fuels lies in both the selection of a surrogate mixture of chemical compounds to represent the fuel and the development of chemical kinetics for the compounds. The surrogate components should be selected to meet the goals of this study, namely, to develop CFD models that can predict the performance metrics for scramjets that include ignition, thrust, combustion efficiency and flame stability. Three fundamental flame properties that provide metrics for these performance goals are:
Ignition delay Heat release rate
3
Flame extinction
It is important that the kinetic models for the jet fuels be validated for the conditions of interest to scramjets: temperatures of 500 to 2600 K, pressures of 0.3 to 4 atm and residence times of the order of a millisecond6,7. Automated reduction using QSS assumptions8 has been successfully applied for a number of reacting flow CFD applications, including scramjet combustors9,10. Combining this technique with advanced chemistry source term tabulation techniques11 and numerical optimization of the reduced mechanism to improve accuracy and reduce stiffness12 make this a promising path towards increased chemical realism in high-speed reacting flow simulations. The experimental component of the work presented here consists of flame extinction measurements in an opposed-jet burner. This choice of experiments focuses on a regime of relevance to scramjet operation while avoiding the complexities of a realistic scramjet geometry and flowfield. These experiments involve a simple, well-defined, laminar flow field that can be modeled computationally with relatively low uncertainty. The range of temperatures and pressures achievable span the operating conditions of the scramjet. Extinction conditions are highly relevant to scramjet operation: As discussed by Peters13, the opposed jet diffusion flame burner simulates local, high strain rate conditions in mixing layers. Local extinction in such layers affects overall combustion efficiency and is important to predicting flame stabilization. Counterflow flames have been used in several recent investigations of liquid fuel kinetics 14-16, but none of these studies have included subatmospheric conditions.
4
3. Methods, Assumptions, and Procedures This section describes the theoretical, numerical, and experimental techniques used in this project to improve chemical kinetic realism in scramjet combustor CFD simulations. 3.1 Surrogate Fuel Blends Real fuels consist of petroleum distillates containing hundreds of hydrocarbon compounds. They are created to meet certain property standards and will vary in composition depending on the date and place produced. Since it is not possible to include all the species present in a fuel sample in a model, surrogate blends17 are developed that contain the major compound classes present in fuels and represent the properties considered important for a given simulation. Proposed JP-8 surrogate blends contain 2 to 10 compounds. The choice of a surrogate blend depends on the desired model outputs. For example, a different (and probably more complex) surrogate is needed to predict chemical details like soot precursor concentrations than is needed to predict ignition delay and flame stability. We have pursued a two-component surrogate as the basis for the kinetics development part of this project. Detailed mechanisms of large hydrocarbons contain many species and reactions. A great deal of reduction will be necessary to produce a model that can be feasibly run in a CFD code. One important area of simplification is to choose a fuel surrogate with the minimum necessary number of components. Kinetics were developed for n-decane and 1,2,4- TMB. Ndecane has been a component of many proposed surrogates. TMB allows the proper average carbon number to be kept close to that of JP-8 and has the effect of significantly slowing ignition when mixed with normal alkanes. Furthermore, experimental results shown in the recent paper by the Surrogates Working Group18 demonstrate that, “Virtually all the surrogates (including those with iso-cetane) except the ones with trimethylbenzene ignite at temperatures lower than those for the jet fuels.” Figure 1 reproduces the figure from Colket et al. showing the ignition data. The Aachen surrogates5, which are less reactive than JP-8 contain TMB.
5
Figure 1. Experimentally Determined Relationship between Temperature at Ignition and Flame Strain Rate Note: For an Average JP-8 and Several Proposed Surrogates (from Colket et al. 2007)
3.2 Chemical Kinetics Improvements Kinetic modeling has become a valuable resource to understand, predict, design and/or optimize complex reaction processes. Most real processes do not occur under isobaric conditions, such as combustion engines and turbines where the pressure in the system varies from less than 1 atm to over 10 atm. Changes in pressure during a reaction will affect unimolecular dissociation and chemical activation reactions, which play an important role in the kinetic process within these nonisobaric systems. Use of a kinetic mechanism that incorporates pressure dependence will allow a more fundamental approach to modeling these chemical systems and provide better prediction of chemical processes outside of experimental calibration ranges, based on fundamental thermochemical principles. Modern computational chemistry techniques are able to calculate thermochemical properties and reaction rates very accurately. Improvements were needed in the pressure dependence of current detailed mechanisms for hydrocarbon combustion. This is important for scramjet modeling because the pressure in a scramjet combustor may vary from about 0.3 to 4.0 atm. There are two types of reactions in which pressure dependence is important: One is in the unimolecular dissociation of parent fuels (hydrocarbons) and hydrocarbon fragments. This often occurs in initiation or chain propagation reactions and in the early stages of combustion. Collisions with the bath gas serve to populate or maintain an equilibrium energy distribution (Boltzmann distribution). When considering pressure dependence of reaction rates we are concerned with the fraction of molecules at the very high energy needed for dissociation. 6
If the pressure is not sufficiently high, the rate of population (or re-population) of these highly excited species is not sufficient to maintain an equilibrium state of molecules with sufficient energy to react. The rate constants for the unimolecular dissociation reactions decrease, (or “fall off”), from what would occur at equilibrium conditions at higher pressures. The other type of reaction in which pressure-dependence is significant is in the smaller molecule chemistry. This is the sub-mechanism consisting of detailed chemistry for the C3–C4 and smaller species. Exothermic association and addition reactions occur with the radical pool. These reactions generate chemically activated (energized) species called an adduct as a result of the new bonds that form from the exothermic reactions. There is a competition for reaction of this energized adduct to different paths, as the adduct can react to new products, dissociate back to reactants or be stabilized by the bath gas. The rate constants for reaction to new products decrease with increasing pressure, because collisions with the bath gas (stabilization) occur more rapidly. The mechanisms for JP-8 involve large hydrocarbon species. In addition to the parent molecule a number of large molecule decomposition paths for each fuel needed to be considered for falloff at lower pressures. In most detailed mechanisms the large hydrocarbons are rapidly converted to smaller (C3 and similar size) intermediates, where more fundamental and accurate reaction rate constants and mechanisms are available. There are many reactions in this C3–C4 chemistry submechanism that have important pressure dependence. The number of reactions to be evaluated for pressure dependence in the JP-8 surrogate mechanism is significant, so a dual approach was used. Several methods to represent pressure dependence in rate constants have been proposed19-26. The Troe parameterization method19 is based on the product between the Lindemann-Hinshelwood fall-off rate expression and a broadening factor to expand the curvature range of this prediction. The Troe formalism requires four parameters. There are two similar methods to include pressure dependence, the Stanford Research Institute method (SRI)20, and the parameterization method proposed by Wang and Frenklach21, with differences in the representation of the broadening factor. The SRI method requires five parameters and the Wang-Frenklach method requires 10 parameters. Pawlowska et al.22 proposed two different semi-empirical equations to describe the fall-off, taking into account the average energy transfer for stabilization. Their J-equation formalism requires 10 parameters while the a-equation requires 12 parameters. The methods described by Poole and Gilbert23 and Kazakov, et al.24 all require more parameters than Troe's original four parameters. Venkatesh, et al.25,26 proposed a method that was not based on the Lindemann-Hinshelwood formalism to describe pressure dependent rate constants. They expressed the rate constants as both functions of pressure and temperature through the use of Chebyshev polynomials. They compared their results to Troe's F-cent method19, the SRI method20 and method due to Gilbert and Poole23 for several thermal dissociation and chemically-activated elementary reaction rates and concluded that the Chebyshev approximants were able to provide more accuracy in the rate constants over wide temperature and pressure ranges. We have taken the Chebyshev formalism described by Venkatesh, et al. and applied it in this study, using quantum RRK theory (QRRK) to calculate k(E) and master equation27 or modified strong collision28 for falloff, in order to calculate k(p,T) for many unimolecular dissociation
7
reaction systems. This provides a single mechanism that incorporates rate constants over a wide range of temperature and pressure. The new detailed chemical kinetic mechanism contains 566 species and 2024 reactions. It contains pressure-dependent kinetics for JP-8 surrogate components n-decane and TMB, as well as for smaller hydrocarbons such as n-heptane and ethylene and other aromatics such as m- and o-xylene and toluene. The mechanism is fundamental, meaning that the rates of the elementary reaction steps come from quantum mechanical calculations and measurements from the literature. There are three components in this mechanism: 1. A sub-mechanism for C1, C2, and C3 hydrocarbon and oxy-hydrocarbon species. This sub-mechanism provides a consistent, pressure dependent reaction set to which the larger hydrocarbon species (C5 to C10) can react, decompose or be oxidized, into the molecules and radicals of this sub-mechanism for reaction to products CO2 and H2O. 2. A mechanism for the normal alkanes: pentane, heptane and decane. 3. A mechanism for methyl substituted aromatics, primarily for TMB. TMB decomposes via the benzyl oxidation path, stepwise into the xylenes and the xylenes decompose via this path to toluene and toluene decomposes to benzene. The mechanism, therefore includes all the same reactions for TMB, for the intermediates benzene, toluene, orthoand meta- xylene and their corresponding decomposition products. 3.2.1 Sub-mechanism for C1, C2, and C3 Hydrocarbon and Oxy-Hydrocarbon Species. This section describes creation of a detailed mechanism for C1 to C3 hydrocarbon and oxyhydrocarbon oxidation with pressure dependent chemical activation and unimolecular dissociation reactions using Chebyshev polynomials to express the reaction rate constant, k(T, P). A single mechanism with pressure dependent rate constants represented in the form of Chebyshev polynomials was developed for C1 to C3 hydrocarbon and oxygenated hydrocarbon oxidation. It is tested over a temperature and pressure ranges of 800 to 1500 K and 0.005 to 15 atm for methanol/methane experimental flow reactor data under both pyrolysis and oxidation conditions. Comparison between experimental data and the kinetic model shows good agreement, given the broad range of experimental conditions for a single mechanism to predict and model. The C1 to C3 mechanism consists of approximately 150 species and 450 elementary reaction steps, with over 200 elementary reactions being pressure-dependent chemical activation or unimolecular dissociation systems. The pressure-temperature dependence is obtained using quantum RRK analysis for k(E) and master equation or modified -collision for fall-off effects. The pressure and temperature dependent rate constants are expressed in the form of a 7 x 3 Chebyshev polynomial formalism over the pressure and temperature ranges of 0.001 to 100 atm and 300 to 1500 K. Despite the large range of conditions, these polynomials still cover the intermediate T and P ranges accurately. The C1, C2 and C3 species chemistry exhibits the largest pressure dependence (relative to pentane, heptane, decane and TMB) because the reactions and intermediates of these C1 to C3 species are smaller molecule systems (relative to parent fuels) with fewer vibrations into which
8
to distribute chemical activation and thermal energy. A large fraction of the pressure dependence occurs in this sub-mechanism. For the C1, C2, and C3 species mechanism we initially tested several hydrogen-oxygen submechanisms. Based on comparison of mechanism results with experimental data, we selected the mechanism of the Curran research group for the forward rates. Reverse reaction rate constants are determined from thermodynamics and thermochemical properties of the species in the reactions and have an advantage of being thermodynamically consistent. Thermochemical and kinetic details of this mechanism and comparisons with experimental data at different pressures are summarized below. The current mechanism we use consists of over 450 elementary reaction rates, with over 200 reactions being pressure dependent, which exhibit significant fall-off in the pressure and temperature ranges of these experiments. Their rate constants are represented in Chebyshev polynomial form over a pressure range from 0.001 - 100 atm and a temperature range of 300 through 1500 K. Pathways for formation and oxidation of higher molecular weight products, such as C2 hydrocarbons and methyl-ethers, which are observed in this study, are also included. 3.2.1.1 Computational Methods For Thermodynamic Properties Thermodynamic properties of species are from literature, theoretical and/or estimation techniques, such as group additivity29, hydrogen bond increments30 for radicals, and ab initio or density functional theory (DFT) calculations. For reactants, products and adducts that were calculated by ab initio or DFT methods; enthalpy of formation was determined by isodesmic working reactions with group balance and entropy and heat capacities are calculated from statistical mechanics with recommended scaling factors from Scott and Radom31. Pitzer and Gwinn’s32 general treatment of hindered internal rotational contributions is used to adjust for the entropy and heat capacity values. Example publications on estimation of thermochemical property data are from several sources28,33-38. 3.2.1.2 Rate Constants Abstraction reaction rate constants are not pressure dependent and are taken from evaluated literature when available. If estimation is required, a generic reaction is used as a model and adjusted for steric effects. Evans-Polanyi analysis is used on the reaction in the exothermic direction to estimate the energy of activation (Ea) for the rate constant. Dean and Bozzelli describe the approach that is used in the current study39. 3.2.1.3 High Pressure Limit Rate Constants for Input to QRRK Most association reaction rate constants in this study are taken from literature. Pressure dependent rate constants are from previously published studies by the kinetics community on chemical activation and unimolecular decomposition studies. In some cases, high-pressure rate constants have been taken from the literature and incorporated into our QRRK method for k(E) and either master equation or modified strong collision analysis for falloff. The specific reaction systems that are described later in this report follow the method described by Sheng, et al.28 and Chang, et al.27 for the master equation and modified strong collision analysis for fall-off, respectively.
9
3.2.1.4 Kinetic Analysis - Modified Strong Collision and Master Equation Pressure and temperature dependent rate constants are determined by a modified QRRK formalism for k(E). Two methods have been used to analyze the collisional deactivation of an energized adduct or the activation of a molecule in dissociation. These methods are master equation analysis28 and the modified strong collision model27. Chang, et al. described a modified QRRK analysis and showed that it results in good agreement with RRKM methods27,40. Both fall-off analysis methods provide a reasonable mechanism for calculation of rate constants versus pressure and temperature for use in standard mechanism integrators. We note a preference for the master equation approach; some of the data we accessed was calculated with the modified strong collision method. The current version of the QRRK computer code uses a reduced set of vibrational frequencies, which accurately reproduce the molecule's (adduct) heat capacity data. Molecular density-ofstate functions are constructed through direct convolution of single frequency density functions on a 10 cm-1 grid. The functions corresponding to each reduced frequency are explicitly convolved into a relative density-of-states, (E), which is normalized by the partition function, Q. The inclusion of states from one external rotation, corresponding to the symmetric top, is incorporated into the calculations by convolving the vibration density function with the proper rotational density function. Reduced sets of three vibration frequencies and their associated degeneracies are computed from fits to heat capacity data, as described by Ritter41 and Bozzelli, et al.42 Ritter has shown the reduced vibrational frequencies accurately reproduce molecular heat capacities, Cp(T). Bozzelli, et al.42 provided a detailed description of the comparisons of the (E)/Q ratios to the direct count (E)/Q ratios and has shown them to be in good agreement; yielding accurate ratios of density-of-states to partition coefficient, (E)/Q. Nonlinear Arrhenius effects resulting from changes in the thermodynamic properties of the respective transition state, relative to the adduct, with temperature are incorporated using a two parameter Arrhenius preexponential A-factor (A,n) in the form of ATn. The master equation analysis used for fall-off in this analysis was described by Sheng, et al.28 and follows Gilbert and Smith43. The method used to determine the density of state functions was described above. Chemical activation is treated by a steady state analysis; the reactant channel provides a continuous input while the product and stabilization channels provide steady outputs. Multiple isomerization channels for the activated adduct are treated by a modified method proposed by Carter and Tardy44 which treats the solution by solving a successions of 2 2 matrix equations that consists of sub-matrices. The collision model is based on an exponential down model that describes the collision probability. The frequency of collision between the adduct and bath gas is described by the standard Lennard-Jones model. Unfortunately, a timeindependent master equation solution for dissociation that allows for multiple isomerization is not included43; unimolecular dissociation reactions are treated as irreversible channels and solved separately. Reversibility of the isomers is taken into consideration by standard numerical integrator packages. 3.2.1.5 Pressure Dependent Chemical Kinetic Mechanism Both the modified strong collision and master equation codes incorporate a temperature and pressure dependent output formalism for the rate constants, in the form of an N M Chebyshev polynomial expression. The temperature-pressure dependent rate coefficients in Chebyshev format for the current system of interest are derived from application of the methodology 10
described by Venkatesh, et al.25,26 The current mechanism file is fitted over a temperature range of 300 – 2400 K and a pressure range of 0.001 – 100 atm with seven temperature functions and three pressure functions, i.e. a 7 3 Chebyshev polynomial expression. REI’s in-house chemical kinetics code REKS has been modified to accept the N x M Chebyshev polynomial formalism of rate constant. The use of a Chebyshev polynomial formalism for the temperature and pressure dependent rate expression, offers the advantage that only one mechanism file is needed to run multiple temperature/pressure conditions. The current modified mechanism format expresses the Chebyshev series45,46 in the inverse temperature and logarithm of pressure as the approximation of the logarithm of the rate coefficients. A d d Gauss-Chebyshev grid is taken to fit N M Chebyshev polynomials using the Levenberg-Marquardt regression algorithm for the reaction systems of interest, where N and M denote the respective temperature and pressure ith and jth term and are predefined for different orders of accuracy. The logarithm of the rate coefficient is thus approximated as, N
M
~ ~ ~ ~ log k (T , P ) aij i (T ) j ( P )
(1)
i 1 j 1
The user specifies the size of the Gauss-Chebyshev grid. The current mechanism uses a 50 50 Gauss-Chebyshev grid. A typical 7 3 Chebyshev expression of rate constant is given in the format shown below: HCO + O2 (+M) HCQ.*O (+M) 1.00E+00 .000 0. ! LOW / 1.0 0.0 0.0 / CHEB/ 7 3 1.0438E+01 2.1076E+00 -2.1625E-01 -1.5689E+00/ CHEB/ 3.9500E-01 2.0033E-01 -6.9226E-01 2.4277E-02 2.9829E-02/ CHEB/ -2.8569E-01 -1.9522E-02 -8.6222E-03 -1.0518E-01 -1.1326E-02/ CHEB/ -7.5687E-03 -3.2695E-02 -3.4330E-03 -2.8109E-03 -6.8658E-03/ CHEB/ -4.4532E-04 -5.6770E-04/
The first line provides the reaction information and a dummy rate constant expression in the Arrhenius form, followed by a comment after the “!” mark. The “dummy” rate constant is not used in determining the rate constant of the reaction, but is required to be non-zero. The second line denotes the keyword “LOW / 1.0 0.0 0.0 /”, which is used for fall-off parameters. The numerical values expressed here do not contribute to computation of the rate constant. Both the “pseudo” rate coefficient expressed in the first line and the second line is done to minimize modifications from the original standard format. The keyword “CHEB” denotes a rate coefficient expression in the Chebyshev polynomial format. The “7 x 3” are the “N” and “M” terms of the Chebyshev polynomials. The following coefficients (21 coefficients for a 7 x 3 Chebyshev expansion) correspond to the “aij” coefficients that represent the rate constant over a wide temperature and pressure range. We also illustrate an example of a 9 x 5 Chebyshev polynomial expansion, which is similar to the 7 x 3 form with exception to the N and M terms and having 45 coefficients; e.g.,
11
CH3 + OH (+M) CH3OH (+M) LOW / 1.0 0.0 0.0 / CHEB/ 9 5 1.1868E+01 9.6894E-01 CHEB/ -9.4097E-03 -1.5436E+00 1.0551E+00 CHEB/ 1.9945E-03 -7.6537E-01 3.1296E-01 CHEB/ -1.0681E-02 -4.2240E-01 4.1586E-02 CHEB/ -5.0537E-03 -2.0165E-01 -1.0945E-02 CHEB/ 3.5664E-03 -8.7762E-02 -6.9501E-03 CHEB/ 3.7986E-03 -3.6908E-02 6.2538E-04 CHEB/ 1.4527E-03 -1.6302E-02 2.6877E-03 CHEB/ 4.0546E-04 -7.9071E-03 1.7613E-03 CHEB/ 2.6857E-04/
1.00E+00
0.000
0. !
-2.3893E-01 -9.9403E-02 4.4376E-02 1.3287E-02 -1.3099E-02 -1.1930E-02 -4.2828E-03 -1.0535E-04 7.1493E-04
5.5919E-02/ -4.3511E-03/ 2.7880E-03/ 1.9800E-02/ 9.3865E-03/ -9.8448E-04/ -2.8118E-03/ -1.3425E-03/ -2.9880E-04/
Two types of modifications have been incorporated in this section: (a) complete study of reaction pathways for some 45% of the reactions in the C1 – C3 sub-mechanism; These use evaluated or calculated thermochemical data for reactants, intermediates (radicals) and TSTs. These thermochemical parameters are implemented into PE diagrams for the reaction paths, and QRRK/master equation analysis performed for k(p,T). (b) generation and incorporation of Pdependent kinetic reaction expressions in the model based on the thermochemistry and PE diagrams for the pathways using the CHEMMASTER/ CHEMDIS codes47 with their associated kinetic analysis. This sub-mechanism (represented by the letter “P” in the reference name of Master Mechanism) includes radical pool determining subsets and chemically activated reactions of OH, HO2, O•, O2 with the following carbon species: CO, HC•=O, CH2=O, C•H2OH, CH3O, CH3 plus a significant fraction of C2 species reactions with O2, OH, HO2. The mechanism also includes the corresponding dissociation reactions of important adducts that become stabilized. Pathways for formation and oxidation of higher molecular weight products such as C2-hydrocarbons are also included. A listing of chemical activation reactions is given in Table 1. The stabilized adducts formed by these addition and association reactions are also treated for pressure fall-off. Table 1 gives a summary of chemical activation and unimolecular dissociation reactions in the C1 to C3 submechanism.
12
Table 1. Reactions and Model Fits to Experimental Data in the C1 – C3 Submechanism Part of this Report CO + O2, HO2, OH adducts cis and trans rotamers of HOC•O and HOOC•O (vide infra) Unimolecular dissociation of HC•=O HC•=O + O, OH, HO2, O2, and unimolecular dissociation of adducts CH2=O unimolecular dissociation CH3 + H, O, O2, CO, OH, HO2, CH3, CH3O and unimolecular dissociation of adducts C•H2OH + O2 , CH3O, CH2O and unimolecular dissociation CH4, CH2O, CH3O, CH3OH unimolecular dissociation CH3OOH C2H2 + H, O2, OH, CH3 and isomerization to H2CC (vinylidene) C2H3 + H, O2, OH, C•H=C=O (ketenyl radical) + O2, + H CH2CO +H C2H4 + O, OH, HO2, CH3 CH3C•=O + H, OH, O2, adducts (CH3C(=O)OO• C•H2CHO + H, O2, adducts C(OO)H2CHO CH3C(=O)OOH CH3CH2 + H, OH, O, HO2, O2 adducts CH3CH2OO•, C•H2CH2OOH C•H2CH2OH dissociation, reaction with + O2, O2 - adduct dissociation CH3C•HOH dissociation, reaction with O2, O2 - adduct dissociation CH3CH2O• dissociation channels CH3CH2OH dissociation channels CH3CH2OOH dissociation CH3OCH2 +O2, OH, CH2O, CH3O
3.2.1.6 HO2 + CO Reaction The reaction of hydroperoxy radical with carbon monoxide is of special interest HO2 + CO OH + CO2 + 62.1 kcal mol-1 In spite of the high exothermicity of this reaction, the rate constants reported in literature are significantly lower than the analogous reaction of carbon monoxide with hydroxyl radicals, see Equation 2, which is less exothermic, on the contrary to the Evans-Polanyi rule OH + CO H + CO2 + 24.85 kcal mol-1
(2)
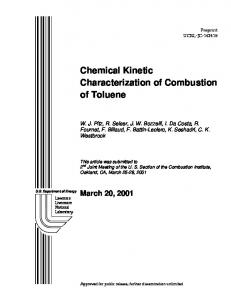
The reactions are supported energetically by the formation of more stable carbon dioxide. High-level computational chemistry is used here to determine the thermochemical parameters and kinetics for this reaction system under atmospheric, thermal and combustion condition sets. Potential energy hypersurface of HCO3 (HO2+CO) system has been evaluated using CBSAPNO, CBS-QB3 multilevel methods and CCSD(T)/6-311+G(d,p), MP2/6-311+G(d,p) and HF/6-311+G(d,p) single level calculations. Calculated thermodynamic properties for species are presented in Table 2. New kinetic parameters for this reaction were determined and shown to improve the modeling of ignition delay times.
13
Table 2. Thermodynamic Properties for Species in HO2 + CO System a Species
ΔH f°(298K) S°(298K) Cp(300) Cp(400) Cp(500)
Cp(600)
Cp(800)
Cp(1000) Cp(1500)
HOOCO TVR b -18.95 65.93 11.51 13.03 14.31 15.35 16.88 17.94 I.R.c 9.16 4.14 4.00 3.82 3.61 3.21 2.90 Total 75.09 15.65 13.43 18.13 18.96 20.09 20.84 TS1 TVR b -6.78 64.79 11.23 12.31 13.23 14.02 15.25 16.17 I.R. c 10.94 3.08 2.78 2.57 2.43 2.26 2.17 Total 75.73 14.31 15.09 15.8 16.45 17.51 18.34 TS2 TVR b -15.15 64.26 10.83 12.08 13.15 14.02 15.32 16.25 I.R. c 9.63 3.42 3.43 3.40 3.31 3.06 2.83 Total 73.89 14.25 15.51 16.55 17.42 18.38 19.08 a Entropies and Heat Capacities ( S and Cp(T) ) referred to a standard state of an ideal gas of at 1 atm.
19.53 2.48 22.01 17.63 2.07 19.70 17.68 2.46 20.14
Units Enthalpy kcal mol-1, S and Cp(T) cal mol-1 K-1 b
TVR represents translation, vibration and external rotation contributions, cIR, internal rotor contribution(s)
Rate determining step of this reaction (scheme in green, Figure 2) leading to OH+CO2 products obviously is barrier TS1-t (via trans HOOCO intermediate) with enthalpy of 16.7 kcal/mol higher than reagents at CBS-QB3 level of theory. 80
Enthalpy (298.15 K) Kcal/mol
H
TS3
TS8 77
O O C
O HOCOO
62
60
H+CO3
55
49 O+HOCO-cis
H+CO2+O
40
40.6
O O
20
0.00
H
O
O
TS1-c
C TS1-t
-20
-40
O H
-60
O C O
-65.5
HOCO2
H
TS2
O
O O
O
H
TS9 H
HOOCO 4.53 H O O C O
O
33
O
17.5
16.7
HO2+CO
TS10
C
O
H
41.1
22
10
TS11 38
33.7
TS7 O TS6
-0.2 Z- HC(=O)OO O O C O H
C
O C 25
C 8.33
HCO+O2
O
C
O
O
H -2.45 E- HC(=O)OO O O C O H
TS4
O
-44.5
O
17.6
TS5 -62
HOCO2
-65.5
OH+CO2 -62.1
Figure 2. Enthalpy Diagram for HCO3• System Calculated by Composite CBS-QB3 Method
14
Figure 2 illustrates Reaction (1) occurs via trans-HOOCO intermediate is highlighted in green. Reaction (1a) occurs via cis-orientation of TS (wavy banded pathway) in red. Oxygenation of HCO radical is in blue (right hand). Energies are in kcal/mol relative to HO2 + CO reagents. There are two paths with different rate constants. The temperature-dependent rate coefficients for chemical activation reaction (1) are expressed as k = 8.45 x10⁸ x T 1.21 exp (17267 cal /RT) cm3mol-1s-1 at 500-1500K. The rate of the bimolecular reaction (1a) is given by k = 7.14 x 10⁷ x T1.57 exp (17721 cal/RT) cm3mol-1s-1. 3.2.2 Kinetics of Normal Alkanes: Pentane, Heptane, Decane This section describes the methods used to develop the chemical kinetic mechanism for the larger normal alkanes. 3.2.2.1 Notation To simplify managing of similar blocks of different hydrocarbons in congested, large chemical kinetic scheme, a notation system is developed. For large species such as radicals C5H11-2, H3CH(OO•)CH2CH2CH3 and CH3CH(OOH)CH2CH•CH3, short notations PN-2J, PN-2QJ, PN2Q4J are used correspondingly, where Q stands for an OOH group and J is a radical center. Digits indicate the position of backbone atom, while the letters and symbols describe attached substituents or hybridization (viz., attached bond type, e.g., * - double, # - triple bonds) on respective atoms. In this notation system, only replacement of PN- prefix to BU-, HX-, HP-, DC- etc., is required for butane, hexane, heptanes, and decane, etc., derivatives, respectively. This notation system is used also in TMB sub-mechanism but not for smaller than butane systems. Butane derivatives are noted likewise. To simplify utilization of our mechanism, a short notation system is used. For main initial molecules we used a benzene-skeleton-based system. For example, B12M and B124M represent 1,2-xylene (1,2-dimethylbenzene) and 1,2,4 trimethylbenzene, respectively. B and M denote the benzene skeletal ring and the methyl substituent(s) respectively. H-abstraction radicals generated from these molecules carry in the respective position, the label "J", which indicates the radical and radical site; e.g., B12M4M, B124M6J, B12M4MQJ represent radical centers located correspondingly on 4th methyl group and 6th ring positions and on the 4th position peroxy group respectively of 124 trimethylbenzene. B12M4CJ*O, e.g. represents the benzene ring with two methyl substituents in the 1 and 2 position and the carbonyl radical in the 4th. C*O represents a carbonyl group, thus CC*O represents CCH*O, in CC*O the h is omitted and full valence is assumed. The Cj*O represents a radical site on the carbon, thus CCj*O is the radical form loss of a H atom in CCH*O Some notations use general chemical features of parent molecules e.g. PA2M4J and PA13M4J are built around the parent penta-2,4-dien-1-al. The CD-prefixed species are built around the cyclopentadiene parent. The naming of CD1J, CD2M, CD1J2M, CD1OJ235M follows a pattern based on this and the previously stated rules above.
15
More specific notations: OQM = Ortho-quinone methide with the Methylene and O double-bonded to the ring in the 1 & 6 position respectively; See the methyl phenyl PE diagram (Fig 6 below) for the OQM molecule formation path. OQM5J – Ortho-quinone Methide with the radical in the 5th position. OQM24M5J and OQM3M5J correspondingly follows the rules above. In systems started that we would normally name with a M as the first character in the string, e.g. MC*OC*CJ "M" we replace the ‘M’ by an "X" as XC*OC*CJ, XC*OC*CJM etc. to avoid confusion in standard kinetics codes with third body (M). 3.2.2.2 Calculation of Pressure-Dependent Kinetic Parameters Pressure- and temperature-dependent rate constants k(P,T) are calculated within the multi frequency formalism of Quantum Rice-Ramsperger-Kassel (QRRK) theory48. Two methods are employed to analyze the collision deactivation of the energized adducts (falloff region): master equation analysis and the modified strong collision model. A reduced set of vibration frequencies is used to reproduce accurately ratios of density of states to partition coefficient27 implemented in the THERM computer package.49 We used thermodynamic properties determined via the variety of high-level quantum chemical methods. The Complex Basis Set and Gaussian group of composite methods as well as variety of ab initio and density functional theory (DFT) individual methods such as B3LYP/6-31G(d,p) hybrid method were employed50. Entropies So298 and heat capacities, 300 T(K) 1500) are calculated using the rigid-rotorharmonic-oscillator approximation based on scaled vibrational frequencies, molecular mass, and moments of inertia of the optimized BLY3/6-31G(d,p) structures. Contributions from hindered rotors to S298 and Cp(T) were determined by the method of Pitzer and Gwinn32 and by direct integration over energy levels of the calculated intramolecular rotation potential energy curves for intermediate radicals and products. Potential barriers for internal rotations of intermediate adducts are calculated at the B3LYP/6-31G(d,p) and B3LYP/6-31G(d) levels for peroxy adducts and hydroperoxy peroxy adducts, respectively. The number of optical isomers and spin degeneracy of unpaired electrons were also incorporated for calculation of S298 and Cp(T). 3.2.2.3 High-Pressure Limit A Factor and Rate Constant Determination The rate coefficients for the initial formation of pentyl-peroxy and other peroxy radicals (viz., the barrierless association rate constants) were obtained from the generic reaction of C2H5+O2 calculated in the frame of variational transition state theory28. Rate constants for the reactions where thermodynamic properties of transition states are calculated by ab initio density functional, the ks are fit by three parameters A, n, and Ea over temperature range from 298 to 2000K: k = A(T) n exp(-Ea /RT). Entropy differences between reactant and TS are used to determine the Arrhenius preexponential factor, A, via canonical transition state theory (TST) for unimolecular and bimolecular reactions: A = (kbT/hp)exp(S/R) and A = (ekbT2/hp)exp(S/R), respectively. Where hp is Plank’s constant, kb is the Boltzmann constant.
16
3.2.3 Mechanism for TMB and Other Methyl-Substituted Aromatics TMB decomposes via the benzyl oxidation path, stepwise into the xylenes and the xylenes decompose via this path to toluene and toluene decomposes to benzene. The mechanism, therefore includes all same reactions for TMB, for the intermediates benzene, toluene, orthoand meta-xylene and their corresponding decomposition products. We did not have fundamental thermochemical data or a reaction mechanism for TMB to start with. The mechanism is based on thermochemistry developed in this research group and the kinetics described below. A significant fraction of the thermochemical properties and kinetics are developed as reported in the provided references. The following sections describes the kinetics that were developed, grouped by reaction class. 3.2.3.1 Abstraction Reactions Abstraction reactions of trimethylbenzene and smaller alkyl benzenes to generate the respective benzyl and phenyl radicals were included in the combustion mechanism for each parent molecule. The abstracting agents were O, OH, O2, HO2 and CH3 and the rates used for these reactions were taken from the work of Dean and Bozzelli39 with Ea obtained from the EvansPolanyi relationship, Ea = Eref – f (Href – Hrxn) The other parameters, A and m needed for complete description of the rate expression, K = ATm exp(-Ea/RT) are obtained from a reference reaction and the value of the A factors are presented in Table 3. The pre-exponential factor (A) has been scaled and corresponds to the A factor for each equivalent hydrogen atom that can be abstracted from the molecule in an equivalent position. As an example, the rate parameters are shown in the Table 3 for the abstraction of the hydrogen from the –CHO group in C2H3CHO by different abstracting agents. Table 3. Rate Parameters for the Abstraction of the Hydrogen from the –CHO group in C2H3CHO by Different Abstracting Agents
H O OH CH3 HO2
kcal/mol E_ref 7.41 5.81 0.91 10.61 18.91
f factor 0.65 0.75 0.5 0.65 0.6
kcal/mol H_ref -3.11 -1.10 -18.31 -3.70 12.69
Abstraction from C2H3CHO H_rxn -15.05 -13.19 -30.07 -15.66 4.02
kcal/mol Ea -0.35 -3.26 -4.97 2.84 13.70
cm3 mol-1 sA (per H) 2.40 E+08 1.70 E+08 1.20 E+06 8.10 E+05 1.40 E+04
m 1.5 1.5 2.0 1.87 2.69
As an example the rate expression for k = 1.4E+04 T2.69 exp(-13.7/RT) where there C2H3CHO + HO2 C2H3C•O + H2O2 is is one hydrogen atom available for the abstraction from the carbonyl site. For reactions shown in the table where the Evans-Polanyi relationship yields a negative Ea value, a small positive barrier (~1 kcal/mol) is used in the kinetic expression for the reaction to conform
17
with the chemical reality that barriers to abstraction reactions under combustion conditions are positive. The abstraction reaction of hydrogen atom from H2 by O2 (H2 + O2 = HO2 + H ) is not treated in the work cited above, the rate expression is: k = 5.0E+12 exp(-(Hrxn + 1.0)/RT) from evaluation of the NIST data base and from computational chemistry51. 3.2.3.2 Abstraction by RO2 In these reactions, R = benzyl (from toluene), methyl benzyl (from xylene) and dimethyl benzyl (from TMB). For the production of benzyl and radicals by RO2 abstraction, preliminary numbers were obtained from the results of Carstensen and Dean in their computational studies52 of abstraction of H atoms from alkanes by RO2 (R = benzyl and its polymethylated analogs). An example of such reactions and the rate used is C6H5CH3 + C6H5CH2OO C6H5CH2 + C6H5CH2OOH; k = 0.45 T3.81 exp(-9.1/RT) The A factor in this rate expression is for each equivalent hydrogen atom and the barrier, Ea = ∆Hrxn + 4.1 kcal mol-1 which yields, for the reaction in which a hydroperoxy bond is formed and a benzyl bond is broken, a Hrxn value of 5.0 kcal mol-1 and a barrier of 9.1 kcal/mol. In this methyl benzene molecule, there are three equivalent benzyl hydrogen atoms on the methyl group to abstract from and ΔHrxn(298) is + 4.5 kcal mol-1 The A factor above is for each hydrogen atom in the molecule in an equivalent position. This rate expression has been used for the benzyl radicals of trimethylbenzene and other methylbenzene molecules detailed in this report. 3.2.3.3 Elimination of Carbonyl (RC•=O) and Vinylic (•C=C-CC) Radical Intermediates These are unimolecular elimination reactions, where a new (double) л-bond is formed and a single, sigma bond is cleaved. The low energy of reaction and barrier come from use of the energy gained in the new л-bond that is formed to offset the energy of sigma bond cleavage. The low energy of reaction combined with its unimolecular nature, where the need for a collision with another reactant is eliminated, often makes these reactions the dominant path for nonresonantly stabilized or non-aromaticity stabilized radicals in high temperature combustion systems. For molecules with carbonyl radicals (e.g., HC•=O or RC•=O), the mechanism needs to include the low enthalpy of reaction, elimination (beta scission) forming CO molecule plus an alkyl or oxy-hydrocarbon radical which readily occurs (ΔHrxn here is typically only 10 - 16 kcal mol-1). The rate parameters for this class of reactions are taken from kinetic parameters obtained in the decomposition of intermediate products formed in the studies of Sebbar et al.33-35 that focus on the thermochemistry and kinetics of unsaturated oxy-hydrocarbon radicals. These unsaturated oxy–hydrocarbon radicals are known intermediates in the ring opening decomposition of benzene and aromatics but are not treated in any aromatic mechanisms in the literature that we are aware of. Vinylic radicals in the oxy- unsaturated hydrocarbons will also undergo elimination reactions to produce alkynes. As an example, the reaction scheme below shows the elimination reactions of trimethyl dioxo-hexadienyl radical to produce CO, CH3CO and propyne, C3H4.
18
CH3
CH3
- CO
H3C O
CH3
H3C O
H3C O
+ H3C
O
CH3
CH3
CH3-C=O + CC≡C
Figure 3: Production of CO and CC≡C via Elimination Reactions The rates parameters for these reactions are as follows: A = 5.00E+13 cm3 mol-1 s-1 and Ea = Hrxn + 6.0 kcal/mol for elimination of CO, and A = 1.00E+14 cm3 mol-1 s-1 and Ea = Hrxn + 4.5 kcal/mol for the elimination of a conjugated hydrocarbon. These rate constants are also in agreement with the kinetic survey published by Dean48. 3.2.3.4 Elimination Reaction of CH3 from Aromatic to Phenyl via Benzyl Route Apart from the abstraction reactions which produce a phenyl reaction with the same number of methyl group as the parent molecule, another path through which phenyl is formed is via a slow, many-step process. For this class of reactions benzyl, which is more favorably produced than phenyl in hydrogen abstraction reactions of aromatic due to the difference in bond energies, reacts with O2 to form a benzylperoxy radical which undergoes sequential reactions including elimination and abstraction to produce a phenyl radical with one less methyl group than the parent. A schematic of this process is shown below.
19
CH 2 OO
CH 2
CH 3 H 3C
+
H 3C
+R Abstraction
3
O2
H 3C
As soc ia tion CH 3
CH 3
CH 3
(a) + HO2 - OH
H 3C
H 3C
beta
H 3C
+R
beta
H 3C
scission of H
Abstraction
scission of CO CH 3
CH 2 O
CHO
CO
(a) +R
CH 3
CH 3
CH 3
beta scission of C H 2 O
Figure 4. Multi-Step, Sequential Process Leading to Formation of Phenyl from Benzyl (Scheme 1)
The phenyl radical produced at the end of the scheme above is highly reactive with O2 to a number of chain branching paths. However, in the presence of trimethylbenzene, this fast reaction will compete with and be dominated by the abstraction of hydrogen by phenyl from the parent methylbenzene to form the benzyl radical, CH3
CH2
H3C
H3C
H3C
H3C
+
+ CH3
CH3
CH3
CH3
And the xylene in the reaction above goes through the cycle shown in scheme 1 to produce a methylphenyl radical,
as per scheme 1
H 3C
H 3C
CH3
which then repeats the reaction with the parent methylbenzene, capping the active radical site and forming toluene and the benzyl radical of the parent. The competition continues until the methyl benzenes are depleted.
20
3.2.3.5 Chemical Activation Reactions There are a number of reactions in combustion systems that form a chemically activated intermediate by either the association reaction of two radical species or from the addition of a radical to a л-bond (reverse of beta scission – elimination reaction), where all the energy of the new bond formed, is in the new intermediate (adduct) formed. Figures 5 and 6 illustrate this reaction process in the association of a radical R•) with the ground state O2 (ground state of O2 is 3π O2 radical) . This chemically activated intermediate often has unimolecular reaction channels available to it that are lower in energy than the excess energy it has when initially formed. These chemically activated intermediates can then react to new products before they are stabilized via reactions with the bath gas, react back to the reactants or be stabilized to thermal conditions of the bath. Reactions of the chemically activated species (adducts) to the lower energy (and lower barrier) new products are often rapid, they are often highly pressure dependent (due to the effect of pressure on stabilization) and they need to be included in combustion models that may wish to include pressure effects. This mechanism is the first, to our knowledge, to include these reactions throughout both the n-alkane and the aromatic molecules. The dissociation reactions of the stabilized adducts also need to be treated for fall-off (pressure effects) in their further dissociation. TS 2 R + O2
[ROO ]* TS 3
TS 1 Isomer
Stabilization
Product Set 1
well depth
Product Set 2
ROO
Figure 5. Generic Chemical Activation Reaction System (Scheme 2)
Phenyl radicals are the active radicals in this alkyl-substituted aromatic system that once formed, react with molecular oxygen to chain branching and to highly exothermic, ring opening reactions that provide serious energy to the combustion system. There are two primary paths to formation of phenyl radicals: 1. Direct abstraction of a hydrogen from an aromatic ring carbon by active radicals such as OH. This path is inhibited by relatively high barriers for the abstraction reactions by the radical pool species relative to abstraction of the methyl (benzyl) hydrogen atoms because of the 23 kcal mol-1 difference in C—H bond energies: the phenyl C—H is 113.5, while the Benzyl C—H is only 90 kcal mol-1. 2. A slow reaction process of the benzyl methyl group, as illustrated in scheme 1 above to eventually form a carbonyl plus a phenyl radical. This last step in this process is driven by formation of the strong л-bond in the carbonyl. 21
The chemical activation reaction of O2 association with phenyl radicals produce a chemicallyactivated phenyl peroxy intermediate (adduct) with near 50 kcal mol-1 energy are illustrated in Figure 4. This adduct can react through several new, lower energy (below the energy of the reactants) paths, dissociate back to reactants or be stabilized through collisions with the bath gas. A potential energy diagram for the reaction of methyl phenyl radical is illustrated in the generic scheme 2 and in the detailed potential energy diagram of Figure 453. This methyl phenyl radical is generated from abstraction of a C—H on the aromatic ring of toluene by the radical pool, or by decomposition of one of the methyl (benzyl) groups on a xylene isomer, as illustrated above. The activated phenyl-peroxy radical in Figure 4 has a well depth of ~50 kcal/mol and can form a stabilized adduct which can isomerize, react further to new products or undergo the reverse reaction back to the reactants. Major products for this methyl phenyl radical plus O2 chemical activation reaction and for the dissociation reaction of the stabilized methyl phenyl-peroxy radical are: 1.
Formation of a methyl phenoxy radical + O atom
2. Ring opening and then unimolecular decomposition of the unsaturated oxyhydrocarbon carbonyl and vinyl radicals 3. Formation of ortho quinine methide (this path occurs for the ortho methyl phenyl radical only). Equilibrium geometries and frequencies of the reactants, products and transition states were calculated using the G3 and G3B3 composite methods and the enthalpy of formation values were then obtained from isodesmic work reactions. High-pressure limit rate parameters (A’, n, Ea) and the barrier heights obtained from the thermochemical properties of the reactants and transition states are then used to calculate temperature and pressure dependent rate constants for the chemically-activated specie of the previous paragraph. This calculation is carried out using the CHEMASTER6 computer code, an implementation of the QRRK theory for calculation of k(E) with master equation analysis for falloff. The quantum computational chemistry study of the thermochemical and reaction kinetic parameters on the methylphenyl radical plus O2 system were used for the high pressure limit reactions (input kinetic data for the higher alkyl benzenes i.e., o- and m-xylenes and 1 2 4 trimethylbenzene), these are illustrated in Figure 6. The thermochemistry from this study and that of Sebbar et al.33-35 was used to develop group additivity, THERM, parameters for use in the other methyl substituted benzene species of this study (benzene, o- and m- xylene, and TMB). The chemical activation reactions of phenyl, methylphenyl, di- and tri-methylphenyl radicals with O2 were investigated. Similar studies were carried out for the reaction of benzyl + O2 as well as for higher methyl-benzyl molecules using high pressure limit parameters determined from DFT and higher-level calculations on the benzyl + O2 system and chemical activation analysis.. Enthalpies of formation are obtained from G3 and G3B3 calculations. Species are further identified in Table 4. Reaction kinetic parameters for the methyl phenyl system are listed in Table 5.
22
TS6 CH 3 +O 2 TS1 74.5
O
TS3
O
O O
CH 3
CH 3 O O
TS8
OOH
TS5 63.5
63.3
TS9 CH 3
CH 3 TS7
+O
TS2
CH 3 O
TS10
CH 3
63.3
60.3 TS4
54.2
O CH 2
O CH 3 OO
OOH TS11 CH 2
37.7
O 31.4
25.8
21.6 TS12 CH 3
CH 3 O O
TS13
22.1
CH 3 O
O
+H
TS14
O
O -0.2
-2.1 O
H3 C O
O
O CH 3
-25.4
-22.8 CH 3 O OH -47.9
Figure 6. Potential Energy Diagram for Methylphenyl + O2 Reaction
23
+ OH
Table 4. Structures and Names for Species Studied on the 2-Methylphenyl Radical + O2 Potential Energy Surface Note: Species IDs as used in modeling are shown in bold. Structure
Name
CH3
Structure O
(1) 2-methylphenyl
O
B1J2M CH3
CH 3
CH 2
(2) 2-methylphenylperoxy
OO
Name
OOH
B1QJ2M CH3
CH 2
OQM
O O
B1OJ2M CH3
(5) 3-methyl-2-hydroperoxyphenyl
OOH
(12) 4-methyl-5,6-dioxetane -2,4-cyclohexadienyl
CH3
(4) 2-methylphenoxy
O
O
H3 C
O
PHJMEOOH CH3
(7) 3-methyl-1,2-benzoquinone
O
O
2-methylperoxyphenyl
(15) 6-methyl-1,6-dioxo -2,4-hexadienyl
O O
MYC6DEDIO
O
CH 3 (14)
PHQME CH 3
CH3
H3 C
O O
PHMEOJOH
OH
MEPHYQ_1 (13) 6-methyl-5,6-dioxetane -2,4-cyclohexadienyl MEPHYQ_2
(6) 2-hydroxy-6-methyl-phenoxy
O
(10) 2-phenylhydroperoxy -1-methylene
(11) ortho-quinone methide
O
MEC6JYOO CH3
MEOC6JDO_C
PHQCH2J
(3) 4-dioxirane-5-methyl -2,5-cyclohexadienyl radical
O O
(9) 7-methyloxepinoxy
HDO1J6M CH 3
(8) 3-methyloxepinoxy O
CLD6M4J (Please see Dean48 for additional information)
24
O
(16) 2-methyl-1,6-dioxo -2,4-hexadienyl
O
ROP3
Table 5. Elementary Rate Parameters (Ea, A, n) for Reactions on the 2-Methylphenyl Radical + O2 Potential Energy Surface Obtained from Ab Initio/DFT calculations and Transition State Theory. A' Ea n Reactiona 3.72×10¹³ -0.217 2-methylphenyl + O2 → 2-methylphenylperoxy [TS1] -0.71 6.36×10¹⁹ -1.372 2-methylphenylperoxy → 2-methylphenyl + O2 [TS1] 48.74 5.89×10¹¹ 2-methylphenylperoxy → 4-dioxirane-5-methyl-2,5-cyclohexadienyl [TS2] 21.1 0.193 5.04×10¹³ -0.284 2-methylphenylperoxy → 3-methyl-2-hydroperoxyphenyl [TS3] 44.8 1.58×10¹¹ 2-methylphenylperoxy → 2-phenylhydroperoxy-1-methylene [TS4] 26.5 0.352 1.27×10¹⁵ -0.246 2-methylphenylperoxy → 2-methylphenoxy + O [TS5] 38.54 9 2.82×10 2-methylphenylperoxy → 2-methylperoxyphenyl [TS6] 83.9 0.933 0.122 2-methylphenylperoxy → 4-methyl-5,6-dioxetane-2,4-cyclohexadienyl [TS7] 40.7 5.33×10¹¹ 1.71×10¹¹ 0.201 2-methylphenylperoxy → 6-methyl-5,6-dioxetane-2,4-cyclohexadienyl [TS8] 40.1 4.99×10¹² 4-dioxirane-5-methyl-2,5-cyclohexadienyl → 2-methylphenylperoxy [TS2] 9.2 0.031 3.03×10¹² 0.141 4-dioxirane-5-methyl-2,5-cyclohexadienyl → 3-methyloxepinoxy [TS9] 14.2 3.03×10¹² 4-dioxirane-5-methyl-2,5-cyclohexadienyl → 7-methyloxepinoxy [TS9] 14.2 0.141 3.14×10¹¹ 0.074 3-methyl-2-hydroperoxyphenyl → 2-methylphenylperoxy [TS3] 16.3 9 1.04×10 3-methyl-2-hydroperoxyphenyl → 2-hydroxy-6-methylphenoxy [TS10] 23.5 1.029 1.73×10¹² -0.134 2-phenylhydroperoxy-1-methylene → 2-methylphenylperoxy [TS4] 20.9 6.47×10¹² 2-phenylhydroperoxy-1-methylene → ortho-quinone methide + OH [TS11] 7.6 0.232 1.54×10⁷ 1.249 2-methylperoxyphenyl → 2-methylphenylperoxy [TS6] 46.3 1.16×10¹² 4-methyl-5,6-dioxetane-2,4-cyclohexadienyl → 2-methylphenylperoxy [TS7] 3.2 0.075 1.81×10¹² 0.031 6-methyl-5,6-dioxetane-2,4-cyclohexadienyl → 2-methylphenylperoxy [TS8] 5.6 1.40×10¹² 2-hydroxy-6-methylphenoxy → 3-methyl-2-hydroperoxyphenyl [TS10] 125.7 0.616 3.45×10¹¹ 2-hydroxy-6-methylphenoxy → 3-methyl-1,2-benzoquinone + H [TS12] 69.5 1.078 2.55×10¹¹ 0.416 3-methyloxepinoxy → 4-dioxirane-5-methyl-2,5-cyclohexadienyl [TS9] 77.3 1.55×10¹² 3-methyloxepinoxy → 6-methyl-1,6-dioxo-2,4-hexadienyl [TS13] 25.6 0.655 2.64×10¹¹ 0.437 7-methyloxepinoxy → 4-dioxirane-5-methyl-2,5-cyclohexadienyl [TS9] 74.7 12 6.69×10 7-methyloxepinoxy → 2-methyl-1,6-dioxo-2,4-hexadienyl [TS14] 29.0 0.574 a High-pressure-limit rate parameters. Ea in kcal mol-1, A' in cm3 mol-1 s-1 for bimolecular rxn and s-1 for unimolecular reactions. k = A'Tnexp(-Ea/RT). Calculated for T = 300 to 2000 K. (Please see A. M. Dean48 for additional information) Table 6. Input Rate Parameters (Ea, A', n) for Use in Kinetic Modeling of the 2-Methylphenyl Radical + O2 Reaction at P = 1 atma A' n Ea 132 2-methylphenyl + O2 → 2-methylphenylperoxy 3.21×10 -38.08 33.96 2-methylphenyl + O2 → 2-methylphenoxy + O 9.18×10²⁰ -2.30 7.37 3.70×10¹² -0.18 -1.52 2-methylphenyl + O2 → ortho-quinone methide 2-methylphenyl + O2 → 2-methyl-1,6-dioxo-2,4-hexadienyl 5.59×10¹² -0.28 -1.94 12 5.59×10 -0.28 -1.94 2-methylphenyl + O2 → 6-methyl-1,6-dioxo-2,4-hexadienyl 2-methylphenylperoxy → 2-methylphenyl + O2 1.52×1034 -6.56 48.79 -7.61 43.66 2-methylphenylperoxy → 2-methylphenoxy + O 3.05×1037 2-methylphenylperoxy → ortho-quinone methide 2.03×1045 -10.17 40.22 -10.96 41.37 2-methylphenylperoxy → 2-methyl-1,6-dioxo-2,4-hexadienyl 9.46×1047 47 2-methylphenylperoxy → 6-methyl-1,6-dioxo-2,4-hexadienyl 9.65×10 -10.96 41.38 a Ea in kcal mol-1, A' in cm3 mol-1 s-1 (bimolecular) and s-1 (unimolecular). k = A'Tnexp(-Ea/RT). Valid for T = 800 to 2400 K. (Please see Dean48 for additional information)
25
3.2.3.6 Cross Reactions The chemical kinetic mechanism generated during this project is constructed to contain a mixture of two fuels with one being n-decane and the other being TMB. It is important, but uncommon, for a mechanism to have cross reactions between the two fuel parent molecules and the important initial fuel radicals and other possible higher concentration intermediates, which may consist of both radical and stable species. A list of cross reactions is given in the Appendix.
26
3.3 Opposed Flow Extinction Experiments 3.3.1. Burner and Associated Equipment Extinction experiments were performed in a variable-pressure opposed-jet diffusion flame burner. The burner consisted of two coaxial open tubes, one carrying fuel and the other carrying oxidizer, housed in a vacuum chamber. The configuration of the burner and the operating conditions changed somewhat over the course of the project. Figure 7 shows the opposed jet burner as configured for the most recent experiments (configuration C), while Table 7 specifies the four different configurations used over the course of the entire project. As seen in Table 7, the tube IDs, gap size, orientation of fuel vs. air, tube material, thermocouple orientation and size, and temperature control varied from experiment to experiment. Most of the final data set was acquired with configuration C.
tube orientation assembly
to vacuum pump
N2 burner tube
sheath
laser sheet liquid fuel
Nd: YAG laser
K10 nebulizer carrier gas
N2 fuel N2
burner tube N2
sheath
stagnation plane
HEN flame oxidizer
oxidizer
olive oil (seed for PIV)
N2 oxidizer N2
carrier gas
driven by syringe pump
The opposing fuel and oxidizer jets, of nearly equal momentum flux, collided in the gap between the burner tubes resulting in the formation of a stagnation plane, near which a diffusion flame burned. In order to prevent the formation of secondary flames, nitrogen gas flowed through the annuli between the burner tubes and outer sheath tubes on the fuel and oxidizer sides. The products of combustion were drawn out of the vacuum chamber by a vacuum pump. For a given set of reactant and sheath nitrogen flowrates, the pressure in the chamber could be adjusted using a flow metering valve on the vacuum chamber exhaust line. The pressure in the chamber was measured with a capacitance manometer. Downstream of the vacuum pump, the exhaust stream was diluted with nitrogen to a non-combustible concentration. This safety measure was required because the exhaust stream contained large quantities of unburned fuel.
Indicates heating use
Figure 7 Schematic of Opposed-Jet Diffusion Flame Burner Apparatus
27
Table 7: Burner Configuration. Configuration Tube ID (cm) Gap size (cm) Orientation
A 1.23(U):1.28(L) 0.87 Fuel from lower tube Quartz Axial, sheathed
Tube material Thermocouple configuration Temperature control No U = Upper burner tube; L = Lower burner tube
A’ 1.23(U):1.28(L) 0.87 Fuel from lower tube Quartz Axial, sheathed Yes
B 1.00 1.00 Fuel from upper tube Steel Axial, sheathed Yes
C 1.00 1.00 Fuel from upper tube Steel Along chord, bare Yes
Gaseous reactants were metered with mass flow controllers, or with mass flow meters and manual metering valves. Liquid fuels were vaporized into a stream of nitrogen or methane carrier gas. Liquid fuels were delivered by a syringe pump at a specified flowrate. The liquid flowed into a concentric glass nebulizer manufactured by Meinhard, which produced a fine mist of droplets of nominal diameter between 3.5 and 25 microns, depending on the fuel flowrate. These droplets, injected into a vaporization chamber, were allowed to vaporize into a stream of co-flowing, pre-heated nitrogen or methane. The pressure in the vaporization chamber was controlled by a downstream metering valve. The fuel vapor and carrier gas constituted the fuel mixture. Air and different O2/N2 mixtures were used as oxidants; see below. The oxidant mixtures were purchased from a supplier, not created from separately metered O2 and N2 flows. For a given flowrate of liquid at the syringe pump, the flowrate of the carrier gas was adjusted to give the desired fuel-side composition, and the flowrate of oxidizer was then adjusted to produce a jet of the same momentum flux as the fuel jet, within 15%. In some of the experiments, the oxidizer-side velocity field was measured using particle image velocimetry (PIV). Olive oil droplets of nominal size, 3.5 microns, formed with a Meinhard high-efficiency nebuliser (HEN), were used as seeding particles; the heating value of the olive oil seed particles in the oxidizer stream was negligible compared to that of the fuel in the fuel stream. A pair of Nd:YAG lasers with maximum pulse energy of 120 mJ/pulse, operating at 5 Hz, were used to illuminate the particles. A CCD camera with 1360 x 1036 pixel resolution acquired image pairs, which were then processed with a cross-correlation scheme to obtain velocity vectors using the freely available MatPIV 54 software. A temperature profile was acquired with the thermocouple shown in Figure 8. The thermocouple was type S (platinum vs. platinum/rhodium alloy). The thermocouple was designed to minimize conduction losses and disturbances to the flame. The part of the thermocouple that was in the flame was fine (3 mil) wire, butt welded to form a slightly larger (4.5 mil) junction, as determined with a microscope. Larger wires connected the fine wires to the voltmeter, and also provided support for the fine wires. The straight section of fine wire near the junction was aligned parallel to the flame, and the entire thermocouple assembly was pivoted vertically to move the thermocouple junction to different positions relative to the flame. The flame position was determined by measuring photographs taken during data acquisition, with the gap size used as a length scale.
28
Figure 8. Schematic of Thermocouple Used for Flame Temperature Measurements Note: Dimensions are given in inches.
Before use, the thermocouple was coated with silicon dioxide, following the procedure described by Fristrom55. The purpose of the silicon dioxide coating was to reduce the catalytic effect of the platinum surface. Thermocouple voltages correspond to the temperature of the junction, which differs from that of the gas because of radiative losses. Junction temperatures were used to calculate a gas temperature through a simple radiation/convection energy balance, as described by Eckert and Goldstein56. The heat transfer correlation of Collis and Williams57 was used, along with two different high-temperature emissivity correlations for pure platinum58,59. 3.3.2 Temperature Control For the majority of the experiments, the temperatures of the fuel and oxidizer jets were measured near the burner tube exit and controlled via heating tapes. In all liquid fuel experiments, the fuel vaporization chamber and all the tubing downstream was heated via electrical heating tapes, to avoid recondensation of vaporized fuel. Thermocouple geometry differed in different burner configurations. In configurations A, A’, and B, a sheathed K-type thermocouple 1.6-mm-OD was mounted axially, with its tip 5 cm upstream of the tube exit. For the more recent experiments (configuration C), a bare K-type thermocouple of diameter 0.076 mm was mounted along a chord. Specifically, it was positioned in the plane perpendicular to the reactant flow, approximately 2.5 cm below the lip of each reactant tube, off axis by 2 mm. The effect of thermocouple geometry on the flow field is shown in Figures 9 and 10 below, obtained with PIV. For each thermocouple configuration, radial profiles of axial velocity were obtained with PIV 0.2 mm downstream of one burner tube exit, with no flow through the other tube. For each thermocouple geometry, ten independent velocity profiles were obtained at the same cold-flow operating conditions. Comparison of the two figures shows that repeatability is much improved through the use of the bare, fine-wire thermocouples (configuration C). Extinction experiments performed with configurations B and C indicated that the choice of thermocouple geometry had a negligible effect on the extinction conditions. 29
250
axial velocity, cm/s
200
150
100
50
0 0
0.2
0.4
0.6
0.8
1
radial position (cm) Figure 9. Cold Flow Jet Exit Velocity Profiles Obtained with PIV for Configuration B .Note: In these cases, sheathed thermocouples were installed axially, yielding unacceptable variability in the velocity field under nominally identical flow conditions.
250
axial velocity, cm/s
200
150
100
50
0 0
0.2
0.4
0.6
0.8
1
radial position (cm) Figure 10. Cold Flow Jet Exit Velocity Profiles Obtained with PIV for Configuration C. Note: In these cases, bare wire thermocouples were installed in an offset radial position, yielding less variable velocities under nominally identical flow conditions.
30
3.3.3 Velocity Profiles PIV velocity measurements are valuable for characterizing the velocity field to which the flame is subjected. Here we present two sets of jet exit velocity data: 1) cold flow measurements with a single jet, intended to verify PIV performance, and 2) near-extinction flame measurements. Figures 11 and 12 show radial profiles of axial velocity, 0.2 mm downstream of the oxidizer tube exit (See Table 7.) with and without the thermocouple present. The conditions are: roomtemperature nitrogen flow at 1 atm, with the flowrates as noted on the figures. There is no flow through the second jet. The symbols represent the PIV data; the line is a parabolic fit to the PIV data. A parabolic profile is expected for fully developed laminar flow, which should be achieved given the burner tube length and the flow conditions. Note the good quality of the parabolic fit. When the fitted velocity profile is integrated over the surface area of the jet, to yield the volumetric flowrate, the flowrate value agrees within 3.5 percent with that obtained when the mass flow controller reading is adjusted for the pressure and temperature. This figure validates the PIV measurement technique as well as the achievement of fully developed laminar flow in the tube, in the absence of a second jet. Figure 12 demonstrates that the thermocouple has little influence on the flowfield.
Figure 11. Exit, Axial Velocity Profile with No Thermocouple in Place Note: Configuration C with fine wire thermocouple removed; nitrogen flowrate: 5.44 slpm
31
Figure 12. Exit, Axial Velocity Profile with Fine Wire Thermocouple Present Note: Configuration C; nitrogen flowrate: 5.69 slpm
Figure 13 a and b shows radial profiles of axial velocity 0.2 mm downstream of the burner exit for two different, representative, near-extinction flame conditions. Symbols represent PIV data, averaged over ten realizations. In this case, the line is not a curvefit; instead it is the parabolic profile predicted from the mass flow controller reading. These profiles were obtained during burner operation with a flame, near extinction. As expected, the profiles are affected by the presence of the second jet and the flame. They no longer are well represented by a parabola passing through zero at the burner edges. Instead, they are somewhat flattened, with a central region of roughly 2 mm diameter that has a fairly uniform velocity. The volumetric flowrate obtained by integrating the PIV data agrees reasonably well with the value predicted from the mass flow controller reading. The discrepancy between the flowrates calculated with these two approaches ranges between 2% and 14% over the eight flame data sets for which PIV measurements are available.
32
400
a 350 MEASURED PARABOLIC
AXIAL VELOCITY (cm/s)
300
250
200
150
100
50
0 -0.5
-0.4
-0.3
-0.2
-0.1
0
0.1
0.2
0.3
0.4
0.5
RADIAL POSITION (cm)
350
b 300
MEASURED PARABOLIC
axial velocity (cm/s)
250
200
150
100
50
0 -0.5
-0.4
-0.3
-0.2
-0.1
0
0.1
0.2
0.3
0.4
0.5
radial position (cm)
Figure 13. Radial Profiles of Axial Velocity at 0.2 mm Downstream of Oxidizer Tube Exit Note: During combustion; operating conditions: 80-20 blend of n-decane and TMB vs 50-50 blend of O2 and N2, near extinction. a) 334 torr; average oxidizer velocity 1.72 m/s, b) 234 torr, average oxidizer velocity 1.47 m/s. Symbols: PIV measurements; line: parabolic profile with the flowrate determined from mass flow controller readings.
3.3.4 Method of Approaching Extinction For a given set of fuel and oxidizer flowrates, the jets were heated to the desired exit temperatures. Once a diffusion flame was established in the gap between the burner tubes, it was progressively strained by reducing the chamber pressure manually. Pressure was reduced by gradually opening the flow metering valve between the vacuum chamber and the vacuum pump, while maintaining the reactant mass flowrates constant. Because extinction needed to be
33
approached quasi-steadily, the decrease in pressure was brought about very gradually as extinction is approached. The entire process typically took approximately 30 minutes for each data point. The pressure in the chamber just prior to extinction is reported here as extinction pressure. For some of the runs, PIV measurements were taken about 10 torr above the anticipated extinction pressure. 3.3.5 Characterizing Extinction Conditions For a given set of reactant flowrates, the global strain rate is given by Seshadri and Williams.60
a global
2V0 L
VF 1 V 0
F 0
(3)
where VF and VO are the volume average fuel and oxidizer jet exit velocities, L is the gap size, and F and O are the jet exit densities of the fuel and oxidizer respectively. The global strain rate is quantified using globally measured quantities such as reactant flowrates and burner geometry. When these quantities are evaluated at the extinction conditions, a global extinction strain rate, aq,global, is obtained. Global extinction strain rate has been found to depend on the tube exit velocity boundary conditions. For example, plug flow and parabolic flow boundary conditions have been investigated computationally and have been shown to give different extinction strain rates61. Recent studies by Pellett have also raised questions about the role of gap size L in extinction measurements 62. With these limitations, global extinction strain rate measurements are valuable mainly when comparing extinction conditions obtained with the same burner geometry. In the current report, experimental data are presented as global extinction strain rates except when they are compared to computational results. An alternative way to characterize extinction conditions is to use the local extinction strain rate aq,local. The local strain rate can be defined as the maximum absolute value of the axial gradient of axial velocity, on the air side of the flame. This maximum occurs near the upstream edge of the flame. In calculated flame solutions near extinction, this quantity can be evaluated by numerically differentiating the axial velocity profile and finding the maximum value. To compare experimental values to this quantity, we convert global strain rates to local strain rates using an empirical correlation developed by Zegers et al.63 The Zegers correlation is based on laser Doppler velocimetry velocity profiles obtained with a burner almost identical to the one used in the current study, and thus should be applicable to the conditions reported here. To obtain local strain rates, Zegers et al.63 recommend multiplying global strain rates by a factor of 1.57. For comparison with computational results, we convert measured global extinction strain rates to local extinction strain rates using this factor. 3.3.6 Materials and Fuel Stability Tests Tables 8 and 9 list the chemicals used in the experiments reported here.
34
Table 8. Chemicals Used in Fuel Stream Note: Specifications are provided by the source of the chemicals, with the exception of Jet A. Specifications Lot number Source Chemical Jet A As described in Holley et al.64: Identifier: AFRL: Tim Edwards 4658 Jet A blend 04P0SF4658 Methane Chemically pure: 99.9% 050707 Air Gas minimum Ethylene 99.5 % pure 051805-2 Air Gas Grade 2.5 n-decane Assay(GC) min 98% 45287547 EMD Chemicals (Merck) (used in pure n-decane experiments, condition D1; See _Table 10) n-decane 99.9% (lot analysis) 073745 Fisher Scientific (used in n-decane/TMB blends, conditions B1 and B2, see Table 10) n-heptane Assay(n-heptane) 99.44% 46336 EMD Chemicals (Merck) Assay(saturated C7 hydrocarbon) > 99.99% Water 0.0019% 1,2,4-Trimethylbenzene 98% (GC) GL01 Tokyo Kasei Kogyo Co. Ltd Compressed N2 Industrial grade; Sept 23, 2007 Air Gas >99.998% typical purity
Chemical O2/N2 50/50 mixture, used for conditions E2, M2, D1, T1, B1, B2, and J1. (See Table 10.) O2/N2 50/50 mixture used for condition J2. (See 10.) Air
O2/ N2 40/60 mixure
Compressed N2 Liquid N2
Table 9. Chemicals used in Oxidant Stream and Sheath Flows Note: Specifications are provided by the source of the chemicals. Specifications Lot number Manufacturer Primary Standard: X02N150P30065E5 Air Gas Oxygen mole fraction (part number) 0.50 ; Nitrogen 82-12410841 balance; Analytical (reference number) uncertainty: +/- 0.01 Commercial grade Air Gas
Breathing quality, grade D Mole fraction oxygen typically 0.195-0.235 Certified Standard: Oxygen mole fraction: 0.4069 Nitrogen balance; Analytical uncertainty: ± 0.02 Industrial grade; >99.998% typical purity Industrial grade; >99.998% typical purity
Date Sept. 26 2007 (analysis date)
GP00U214A
Air Gas
X02NI60C2001931 (part number) 44-116334915-1 (reference number)
Air Gas
Aug. 07 2007 (analysis date)
Air Gas
July 23 2007
Air Gas
Many dewars
35
We have completed a qualitative analysis of liquid and vaporized jet fuel composition to determine whether decomposition occurs in the vaporization or fuel delivery system used in our combustion experiments. We found no evidence of jet fuel decomposition. We used gas chromatography/mass spectrometry (GC/MS) to analyze the composition of liquid and vaporized jet fuel samples and compared them to each other. Because the different physical form of the sample necessitated different GC/MS methods, a quantitative comparison of species mole fractions was not meaningful. However, the chromatograms and mass spectra from the two samples showed the same species present in the two samples. Thus there was no evidence of jet fuel decomposition to form new compounds, not present in the original fuel. Details of the sampling and analysis method are provided below. Liquid fuel sampling: A 3 ml sample of liquid jet fuel was obtained via a syringe. This sample was mixed with 37 ml of methylene chloride, also obtained via a syringe. Ten l of the resulting mixture was injected into the GC/MS. Vaporized fuel sampling: Jet fuel was fed into the nebulizer via syringe pump at a liquid flowrate of 0.5 ml/min, as is done during a combustion experiment. The nebulizing gas was nitrogen, and additional nitrogen flowed into the vaporization chamber to produce a total nitrogen flowrate of 1.3 slpm, or a jet fuel mass fraction of 0.2. The vaporization chamber was maintained at 150 °C. Downstream of the vaporization chamber, the vaporized fuel/N2 mixture passed through heated stainless steel tubing maintained at 100 °C, and into the burner tube. 500l samples of this gas mixture were withdrawn via a syringe passing through a septum, just upstream of the vacuum housing. GC/MS method: Both samples were injected into a Thermo Fisher Ultra trace GC equipped with a DSQII MS detector. The column used for the analysis was a DB5 30 m x 0.25 mm from J&W Scientific. For the liquid fuel sample, 10 l was injected at a split ratio of 100, while for the gas sample, 500 l was injected, also at a split ratio of 100. The oven temperature started at 50C, held for 15 min, increased to 310 C with a rate of 5.0 C/min, and then held for 10 min. The MS started scanning 9 min later than the temperature program started. The mass scan range was from 33 to 300. Figures 14 and 15 compare the chromatograms obtained for the liquid and vaporized jet fuel samples, both for the entire time period of the analysis and for representative time ranges in the chromatogram. Note that in Figure 15 each chromatogram is normalized by the magnitude of the largest peak in the time range shown. Each major peak was identified through comparison with reference spectra from the NIST mass spectral library (NIST/EPA/NIH Mass spectral library, version 2.0d (2005) ). The agreement between literature and experimental spectra was 85% or better, as determined by the library searching software. Aside from the peaks labeled in Fig. 14, the following major peaks were identified: undecane (22.56 minutes), tridecane (29.65 minutes), and tetradecane (32.42 minutes).
36
Figure 14 Chromatograms (total ion count) for Liquid and Vaporized Jet Fuel Samples Note: Numbers indicate peak elution times, as determined by GC/MS software.
37
Figure 15 Representative Closeup Chromatograms of Shorter Time Ranges Note: Near the beginning, middle, and end of the jet fuel elution time. Numbers indicate peak elution times, as determined by GC/MS software.
38
3.3.7 Operating Conditions
Table 10 lists the operating conditions of the experiments. Table 10. Test Conditions for Opposed Jet Diffusion Flame Experiments Note: Fuel and oxidant stream flowrates are chosen to provide equal momentum fluxes. Fuel Stream (See Table 8 for source and specifications of chemicals.)
Identifier
Methane M1 Methane M2 Methane M3 Ethylene E1 Ethylene E2 Ethylene in N2 E3 Mass fraction ethylene: 0.50 Strain rate: 358 s-1 n-heptane in methane H1 mass fraction n-heptane : 0.69 n-heptane in N2 H2 mass fraction n-heptane: 0.50 n-decane in N2 D1 mass fraction n-decane: 0.22 n-decane/TMB mixture B1 in N2. Component proportions in fuel mixture: 80/20 by volume mass fraction ndecane+TMB: 0.22 n-decane/TMB mixture B2 in N2. Component proportions in fuel mixture: 60/40 by volume mass fraction ndecane+TMB: 0.22 Jet A in N2 J1 mass fraction Jet A: 0.22 Jet A in N2 J2 mass fraction Jet A: 0.17 T2 Trimethyl Benzene in N2 mass fraction TMB: 0.22 UH : unheated (no temperature control)
UH/UH 150/100 100/UH UH/UH 150/100 150/100
Oxidant Stream (See Table 9 for source and specifications of chemicals.) Air O2/N2 50/50 mixture Air Air O2/N2 50/50 mixture Air
Experiment al configurati on (See Table 7) A C A’ A C C: T profile
238-636 79–209 251-725 132- 419 89-156 452
100/UH
Air
A’
361-655
100/100
O2/ N2 40/60 mixture
B
212-440
150/100
O2/N2 50/50 mixture
C
187-518
150/100
O2/N2 50/50 mixture
C
227-416
150/100
O2/N2 50/50 mixture
C
239-429
150/100
O2/N2 50/50 mixture
C
218-450
150/100
O2/N2 50/50 mixture
C
364-457
150/100
O2/N2 50/50 mixture
C
448-651
Temp (C) Fuel / Oxidant
39
Pressure range (torr)
In the case of the liquid fuels, the degree of dilution must be selected as well as the fuel composition. Flames with different fuel:N2 proportions and/or different oxidant compositions will have significantly different temperatures and flame positions relative to the stagnation plane, both of which significantly affect extinction conditions 65. To facilitate comparisons among ndecane, trimethyl benzene, n-decane/trimethyl benzene blends, and Jet A, we chose to perform tests in which we matched the mass fraction of the fuel in the fuel stream among the different tests performed. Table 11 lists the experimental operating conditions for these tests, along with two simple measures of flame temperature and position: 1) the adiabatic flame temperature for a stoichiometric mixture of the fuel stream and oxidant stream, at one atmosphere, and 2) the stoichiometric mixture fraction, or mass fraction of material from the fuel stream that is found at the stoichiometric contour. The similar values among the liquid fuels tested here indicate that the fuels are being tested under comparable conditions. Note that other results reported here have significantly different values of these parameters. For example, the methane and ethylene flames with identifiers M2 and E2 have adiabatic flame temperatures of 2828 K and 2941, respectively, and have stoichiometric mixture fractions of 0.12 and 0.13, respectively. Table 11. Flame Characteristics for Experiments with N-Decane, TMB, Blends, and Jet Fuels Note: In all cases, the fuel mass fraction in the fuel stream was 0.22, and the oxidant was a 50-50 molar mixture of O2 and N2. Fuel Stream
Stoichiometric Mixture Fraction 0.42
Identifier
n-decane in N2
Adiabatic Flame Temperature (K) 2627
n-decane/TMB 80/20 mixture in N2.
2629
0.42
B1
n-decane/TMB 60/40 mixture in N2.
2631
0.42
B2
Jet A in N2
2609
0.45
J1
Trimethyl Benzene in N2
2636
0.44
T1
D1
3.4 Mechanism Reduction
This section describes the mechanism reduction techniques used during this project. 3.4.1 Skeletal Mechanism Development A skeletal mechanism is a smaller version of a detailed chemical kinetic mechanism with unimportant species and reactions deleted. For fuels requiring very large mechanisms, creation of a good skeletal mechanism is an important step in creating the QSS reduced mechanism. This significantly improves the performance of the reduced mechanism because fewer elementary rates must be evaluated and fewer QSS equations solved for each source term evaluation. The Directed Relation Graph (DRG) method66 for doing this has been implemented into the CARMPSE software and used in this project. DRG is useful for a first cut at reducing a mechanism, but often does not remove all the species that can be removed without significant error. To achieve near-optimal skeletal reduction sensitivity analysis is necessary. We have found that calculating the relative ignition delay error caused by removal of a species to be a good indicator of its importance in the overall combustion process. Skeletal mechanisms created using a combination of DRG and sensitivity analysis were tested for accuracy in predicting ignition delay and species
40
and temperature time histories before proceeding to the development of the QSS reduced mechanism which is to be used in CFD simulations. 3.4.2 Mechanism Reduction using QSS Assumptions One successful method of reducing large chemical kinetic mechanisms is by approximating some species through a QSS assumption. The QSS assumption sets the rates of creation and destruction of a species to be equal. This replaces a partial differential equation for the species concentration with an algebraic equation. The QSS assumption gives very accurate results for many minor and intermediate species over a wide range of combustion conditions. This type of approximation allows much more information from the detailed or skeletal mechanism to be kept in the reduced model than by simply removing species and curve-fitting rates.
Chen8 has automated the QSS mechanism reduction process into a computer code entitled CARM (Computer Assisted Reduction Method) which REI has combined with software for comparing detailed and reduced kinetics and a genetic optimization algorithm into a Problem Solving Environment designated CARM-PSE12. CARM-PSE produces source code for calculation of chemical source terms defined by the reduced mechanism that can be linked easily to a combustion simulation code. The output from CARM-PSE is a source code file, generally several thousand lines long that iteratively solves the nonlinear QSS equations for the necessary species concentrations and returns the source terms for the non-QSS species. Routines in Fortran 77, Fortran 90, or C can be created. Use of the genetic optimization algorithm to select the QSS species greatly increases the accuracy and reduces the stiffness of the reduced mechanism. REI’s in-house kinetic solver, REKS, which is used in the optimization software was modified to enable it to run with the Chebychev polynomial reaction rate format used by Prof. Bozzelli. The necessary modifications to CARM have also been completed and tested. The optimization software (CARM-PSE) has been modified to work with the latest version of CARM, which includes new QSS solution techniques aimed at improving efficiency and reducing stiffness67. The full optimization software suite (CARM, CARM-PSE, and REKS) was used to optimize reduced mechanisms based on the detailed mechanisms created by Prof. Bozzelli as well as mechanisms from the literature. 3.5 Chemical Source Term Tabulation Using ISAT
ISAT is a storage/retrieval algorithm for the efficient implementation of combustion chemistry in CFD simulations. The objective of ISAT is to avoid performing expensive chemistry calculations multiple times by storing the information from many fewer calculations, and when possible with sufficient accuracy, retrieving the information from the stored table. Detailed descriptions of the ISAT algorithm can be found in Pope11. Some of the important features of the ISAT algorithm used in this project are outlined in the following: The chemical source term table is built up in situ (as the combustion calculation is performed) rather than as a pre-processing stage. In this way, only the region of the composition space that is accessed in the calculation is tabulated. Interpolation in the table is performed via a linear approximation using a numerical Jacobian matrix. This Jacobian matrix is returned to the CFD code upon successful table look-up for use in implicit solution algorithms. The interpolation error, ε, is controlled relative to a specified tolerance εtol. If a table entry is found such that ε is less than εtol, a linear interpolation from the table (“retrieve”) is performed. 41
Otherwise, the source term is calculated directly. If the directly calculated source term differs from the table entry by less than the error tolerance then the ellipsoid of accuracy (estimated from sensitivity information) is increased in size (“grow”). If not, a new table entry is created (“add”). During Phase I of this project several upgrades were made to REI’s ISAT software including tree trimming, and secondary growth and retrieval68. This version of ISAT, to which we refer as ISAT 2.0, showed speedups of about a factor of two over ISAT 1.0 in 2D supersonic jet flame simulations. 3.5.1 Multiprocessor ISAT Strategies 3.5.1.1 Local ISAT Tables In parallel CFD simulations of turbulent combustion using domain decomposition, each processor is assigned the computational work for one or more subdomains. Initially, a purely local ISAT tabulation strategy was used, in which each processor has its own ISAT table, as illustrated in Figure 16. This approach has several drawbacks including inefficient use of memory due to overlap among the various tables, boundary discontinuities due to interpolation from different tables, and poor load balancing due to different retrieval rates among tables. The boundary discontinuity problem can be alleviated using tighter tolerances at the cost of a lower retrieval rate. Each processor contains a local ISAT table CFD Code Main Program
Sub-Domain 1 Processor 1
Sub-Domain 2 Processor 2
Sub-Domain 3 Processor 3
Local ISAT Processor 1
Local ISAT Processor 2
Local ISAT Processor 3
Solve Reactive Flow
Evaluate Reaction Rates & Jacobian
Figure 16. Diagram of Local ISAT Strategy Note: Each domain/processor contains an ISAT table local to that domain/processor.
3.5.1.2 Message Passing Interface ISAT Strategy A parallel ISAT strategy using Message-Passing-Interface (MPI), called Uniform Random (URan)
Distribution Algorithm, has been implemented into the CFD code VULCAN. The URan parallel ISAT implementation randomly distributes new table entries to the ISAT table housed on each processor, as illustrated in Figure 17. The search algorithm treats the table on each processor as an individual tree in the overall ISAT scheme. The URan algorithm decouples the local ISAT table from the sub-domain associated with the host processor, and has the potential of overcoming many of the drawbacks identified for the purely local implementation. The URan version of ISAT is dubbed ISAT 3.0 and includes all the single-processor improvements included in ISAT 2.0.
42
Figure 17. Diagram of the URan (Uniform Random Distribution) ISAT Strategy
ISAT versions 2.0 and 3.0 have been implemented and tested in VULCAN. ISAT 2.0 has been implemented and tested in CFD++. Results from these codes are given in Sections 4.5 and 4.6. 3.6 CFD Demonstration
The two CFD codes used to demonstrate the combination of QSS reduced mechanisms and ISAT are CFD++ and VULCAN. These codes are described in the following sections. Results from these codes are given in Section 4.6. 3.6.1 The CFD++ CFD Code CFD++ (http://www.metacomptech.com) is a commercially licensed, general purpose CFD software suite created and marketed by Metacomp Technologies, Inc. CFD++ can provide steady and unsteady solutions of the Navier-Stokes equations with various forms of turbulence modeling, including specialized treatment of low speed and incompressible flows via preconditioning. CFD++ uses a compressible flow formulation with perfect or real gases as well as reacting and non-reacting flows. The CFD++ unified framework for handling structured curvilinear and unstructured grids, including hybrids and the unified treatment of various cell shapes including hexahedral, tetrahedral, pyramid and triangular prism cells (3D), quadrilateral and triangular cells (2D), and linear elements (1D). Treatment of multiblock patched aligned (nodally connected), patched-nonaligned and overset grids is supported. CFD++ uses TotalVariation-Diminishing (TVD) discretization based on a novel multidimensional interpolation framework. Realizable approximate Riemann solvers are used to determine interface fluxes. One-, two-, and three-equation linear and nonlinear turbulence models that do not require knowledge of the distance to the walls are included. Reynolds stress models are under preparation. Various time-stepping options including explicit and implicit schemes, relaxation methods and multigrid convergence acceleration techniques are available. A dual time-stepping methodology is used for time-accurate simulations. The implementation on parallel computers is based on the distributed-memory message-passing model. MPI-based parallel versions are available for a variety of parallel architecture computers including those available from DEC (Compaq), IBM, SGI, SUN, HP, and PC clusters.
43
3.6.2 The VULCAN CFD Code VULCAN (http://vulcan-cfd.larc.nasa.gov/) is a Navier-Stokes flow solver that is currently maintained and distributed (restricted to the U.S.) by the Hypersonic Airbreathing Propulsion Branch of NASA Langley Research Center. VULCAN is a multigrid, multiblock, structured, finite-volume code, developed for solving the spatially elliptic and parabolized forms of the equations governing 3-D, turbulent, calorically perfect and nonequilibrium chemically reacting flows. Space marching algorithms developed to improve convergence and/or reduce computational cost have been implemented as well as elliptic methods for solving flows with large regions of subsonic flow. A full approximate storage, full multigrid scheme is also available to accelerate convergence of either the elliptic or space marching schemes. Compressibility corrected forms of the k- and k- two-equation turbulence models suitable for high-speed flows are used. In addition, a compressible, pressure-gradient-corrected turbulent law-of-the-wall matching function has been implemented that decreases wall grid spacing sensitivity. Turbulence-chemistry interaction models have also been implemented using the assumed Probability Density Function (PDF) and Eddy Dissipation Concept (EDC) methods. VULCAN is advantageous for algorithm development and testing purposes because source code is available.
44
4. Results and Discussion
This section describes the results obtained using the techniques described in Section 3. 4.1 Chemical Kinetics Improvements
This section shows results of comparisons of the detailed chemical kinetic mechanism developed during this project to experiments from the literature and from this project. 4.1.1 Small Molecule Validation: Methanol
The choice of the initial system to test our methodology needed to fulfill several criteria. One criterion is the system should contain a sizable number of elementary reaction rates to demonstrate the feasibility of this method. A second criterion is the system of choice had to have sufficient experimental data to verify the model. Finally, the experimental data should also vary over a wide pressure range, e.g., 1 to 10 atm. One system that fulfills all three criteria is methane/methanol, which was the system we chose. The oxidation and pyrolysis of gas phase methanol has been reported in a number of studies over the past half century by experimental methods which range from diffusion flames, shock-tube, static and flow reactors69-86. Norton and Dryer performed methanol detailed oxidation experiments using a turbulent flow reactor at equivalence ratios in the range from 0.6 to 1.6 and initial temperatures from 1025 to 1090 K at atmospheric pressure85. They also presented a kinetic mechanism for methanol pyrolysis which matched multiple sets of experimental data from static, flow, and shock tube reactors, covering temperatures of 973 to 1993 K and pressures of 0.3 to 1 atm.69,80 They indicated that the fuel decomposition reaction CH3OH C●H2OH + H, previously included only in mechanisms for high temperature conditions, has a significant effect at low temperatures through the reverse radical recombination. They also reported that the reaction CH3O● + CO CH3● + CO2 rather than CH3OH + H CH3● + H2O, was the major source of CH3 at low temperatures and the reverse of CH3● + OH C●H2OH + H was important to CH3● production at high temperatures. Held and Dryer extended their methanol oxidation mechanism comparing results on static and flow reactors, a shock tube and laminar flames for temperatures from 633 to 2050 K over a pressure range of 0.26 to 20 atm.86 Their mechanism was constructed from the kinetics of Yetter, et al.82, Hochgreb and Dryer83, Norton and Dryer85 plus modifications. Held and Dryer use sensitivity analysis to report that methanol oxidation is very sensitive to kinetics of hydroperoxy radical. While the pressure and temperature range is large, the mechanism only includes fall-off analysis for four reactions. The C●H2OH radical is an important first product from abstraction reactions (by species in the radical pool) on methanol. Important elementary reactions of C●H2OH with molecular and atomic oxygen in the methanol oxidation system were studied by Grotheer, et al.81 using a direct discharge flow reactor over temperature range from 298 to 673 K at pressures around 1 mbar. Radical profiles were monitored by a low-energy electron impact ionization mass spectrometer. The rate coefficient was measured for the C●H2OH + O reaction. A strong non-Arrhenius behavior for C●H2OH + O2 reaction was reported. Methane oxidation has been extensively studied and modeled, as methane is a major component of natural gas, and is used for a wide range of energy and power sources. The application range is extensive, covering a wide range of pressure in compression engines and gas turbines. In
45
addition, synthesis of select methane coupling products at high temperatures and varied pressures is important; having a model that is capable of predicting the behavior of these processes with a large component of pressure dependence in the rate constants are desirable. We cannot discuss all experimental and modeling studies of methane oxidation. We note that there are many mechanisms for modeling methane oxidation, with a very well established one, the GRI series87, well tested over temperature and pressure. The GRI Mech 3.0, for example, only incorporates Troe parameters for 26 reactions. In addition to experimental data obtained from literature sources, we have also taken several experimental data sets from the methane/methanol system. The description of the experimental setup, the various controlled experimental conditions and the acquired data were discussed by Ing et al.88 4.1.1.1 Methanol Dissociation
Methanol decomposition is initiated by thermal dissociation, with six decomposition channels. The methods used in determining the energetics of this system are detailed in Ing et al.88 There are three pathways that do not exhibit saddle point transition states. The two H atom bond cleavage and the CH3–OH cleavage reactions do not have a saddle point and the rate constants are calculated by variational transition state theory (VTST). The transition state to form the 1 CH2 + H2O product is at a lower energy level than the products. The high-pressure limit rate constant for this dissociation channel is calculated from canonical transition state theory (CTST), but based on an excited state of the transition state that has the same enthalpy as the 1CH2 + H2O product set. Entropy of the transition state is also determined at the same energy level as the excited transition state. The barriers of the reverse reactions for 1HCOH + H2 and CH2O + H2 are calculated as –4.0 and 0.2 kcal mol-1 with respect to the energy level of CH3● + OH channel. The high-pressure limit rate constants for these two product sets are also determined by CTST. The unimolecular dissociation shows that CH3● + OH channel is dominant at moderate temperature (ca 1000 K) and 1HCOH + H2 channel becomes important when temperature increases. After the initial decomposition of methanol, two H atom abstraction reactions are found to be the most significant to form C●H2OH and CH3O● radicals, viz: CH3OH + H C●H2OH + H2 CH3OH + H CH3O● + H2 There are no well-accepted rate coefficients for the CH3OH + H abstraction reactions available (it is difficult for experiments to determine the product sets ratio) and Warnatz’s data89 are adopted in this study. The ratio for forming C●H2OH to CH3O● is 4:1 and is temperature sensitive. The C●H2OH and CH3O● radicals decompose, via -scission, to form formaldehyde: C●H2OH + M CH2O + H + M CH3O● + M CH2O + H + M Both these unimolecular decomposition reactions are pressure dependent and are analyzed by QRRK analysis with master equation for fall-off. Formaldehyde, an important intermediate, decays primarily by a H abstraction reaction: CH2O + H HC●O + H2. The decomposition
46
reaction of HC●O + M CO + H + M is found to be one of the dominant channels to form carbon monoxide, the final product undergoing pyrolysis90. 4.1.1.2 Methanol Oxidation
The initiation reactions for methanol occur via dissociation pathways described above. Under oxidation conditions at intermediate temperatures of ca 1000K, the following abstraction reactions become the important channels for methanol decay, after the initiation reactions. CH3OH + OH
C●H2OH / CH3O●+ H2O
CH3OH + HO2
C●H2OH / CH3O● + H2O
CH3OH + H
C●H2OH / CH3O● + H2
The primary reaction responsible for decay of methanol under oxidation conditions is the CH3OH + OH abstraction reaction. An important source of hydroxyl radical comes from the hydroperoxy radical plus hydrogen atom to form two hydroxyl radicals. The most important reaction for the formation of formaldehyde is through the O2 addition to the C●H2OH radical, which forms an energized adduct. C●H2OH + O2
[●OOCH2OH]* ●OCH2OH + O [HOOC●HOH] ‡ HCO2H + OH [CH2O...HOO●]* CH2O + HO2 [HOOCH2O●]‡ CH2O + HO2 C●H2OH + O2 (Reverse - Null Reaction) ●OOCH2OH (Stabilization)
This system has two pathways to CH2O + HO2. One pathway (low importance) is through a 5member ring H atom shift (isomerization) to an unstable CH2(OOH)O● radical, which scissions to form CH2O + HO2. In the second pathway (dominant), the O2 migrates (isomerization) to the hydroxyl hydrogen [CH2O...HOO●]*, a hydrogen-bonded complex, which then dissociates to CH2O + HO2. The rate constant for the H atom isomerization pathway is about two orders of magnitude slower than the pathway via hydrogen-bonded complex because of the lower barrier. The dominance of HO2 elimination is verified by experimental kinetic data91. The formation of CH2O + HO2 via [CH2O...HOO●]* is the dominant channel for pressures < 1 atm and temperature < 2000 K. Stabilization of the ●OOCH2OH adduct is important for pressures > 3 atm at 298 K and for pressures > 25 atm at 900 K, but this adduct rapidly reacts (low energy isomerization then dissociation) to HO2 + CH2O. Formaldehyde then decays by the reaction of CH2O + OH HC●O + H2O. The decomposition reaction of HC●O + M CO + H + M is found to be a dominant channel to form carbon monoxide and CO reacts with OH to form CO2 + H, producing carbon dioxide. 4.1.1.3 Methanol/Methane Oxidation Reactions
The comparison of methane and methanol oxidation can be described in three stages: initiation, propagation and oxidation. During initiation, formation of key radicals is determined by the 47
most favorable thermochemical kinetics (usually lowest barrier reactions). Several channels of CH3OH unimolecular decomposition have lower barriers than CH4 dissociations and are, therefore, faster than CH4 decomposition. CH3OH
CH4
CH3● + OH
Hrxn = 92 kcal mol-1
C●H2OH + H
Hrxn = 97 kcal mol-1
1
HCOH + H2
Ea = 78 kcal mol-1
1
CH2 + H2O
Hrxn = 92 kcal mol-1
CH2O + H2
Ea = 86 kcal mol-1
CH3● + H
Hrxn = 103 kcal mol-1
1
Hrxn ≈ 148 kcal mol-1
CH2 + H2
In propagation reactions, abstraction of H atom radicals from HCH2OH has a lower bond energy (97 kcal mol-1) than HCH3 (103 kcal mol-1). C●H2OH is also formed with a lower abstraction barrier than CH3● from CH4. The secondary reaction of the C●H2OH intermediate is also much faster relative to CH3●, where the low energy to the formation of the strong carbonyl double bond, which cannot be formed in the methyl system. CH3●
1
Hrxn = 108 kcal mol-1
C●H2OH
CH2=O + H
CH2 + H
Ea = 38 kcal mol-1
Methyl oxidation, CH3● + O2 new products is also much slower than C●H2OH + O2, because as noted above, the C●H2OH + O2 reaction has a low energy exit channel to CH2O + HO2 - the barrier is approximately 20 kcal mol-1 below the energy level of reacting C●H2OH + O2 species. The comparative reaction in CH3● + O2 rapidly forms the [CH3OO●]* complex, which has no low energy barriers other than back to the reactants CH3● + O2. The [CH3OO●]* can undergo four reactions: stabilization to [CH3OO●], formation of CH3O● + O, isomerization to [C●H2OOH]* and the reverse reaction. The [C●H2OOH]* isomer is unstable92,93 and rapidly dissociates to form the products CH2O + OH. CH3OO● can also react with CH3● to form two methoxy radicals. The lowest barrier to new products is the CH2O + OH channel; but this is 13 kcal mol-1 above the reverse dissociation to CH3● + O2. 4.1.2 Kinetics of Other Small Molecules 4.1.2.1 Kinetics for CH3● + O2
The high-pressure limit input parameters for the CH3● + O2 addition reaction to form the [CH3OO●]* complex are taken from experimental data of Cobos, et al.94 The kinetic parameters for dissociation of the adduct back to reactants are from thermodynamics and microscopic reversibility. Parameters for the CH3O● + O product channel are obtained from an estimate of 5.0 1013 cm3 mol-1 s-1 for the high-pressure association rate constant (O + CH3O● CH3OO●) and microscopic reversibility. There is no saddle point transition state barrier and the activation energy required is based on the difference between the products and adduct calculated at the CBS-APNO level of theory. The transition state for the isomerization reaction to CH2O + OH is through a four-member ring forming a radical on the ipso-carbon. This radical specie is expected to immediately -scission
48
without barrier to form the more stable carbonyl + OH products. This reaction can be written in one step, i.e. CH3OO● CH2O + OH, and with the rate constant through the four-member ring transition state. The activation energy barrier we used is from Yu, et al.95 They report a barrier of 46.2 kcal mol-1, 16 kcal mol-1 higher than that of reverse reaction (back to CH3● + O2, Ea = 30 kcal mol-1). The Arrhenius pre-exponential factor is calculated from transition state theory and published data of Walch96. The major reaction path for CH3● + O2 is formation of the adduct and the reverse reaction. The isomerization pathway is 12 kcal mol-1 higher and the pre-exponential factor is about an order of magnitude slower than the reverse reaction. The dissociation to CH3O● + O is 30 kcal mol-1 endothermic, but the pre-exponential factor is competitive with that of dissociation. The CH3O● + O and CH2O + OH are both slow, relative to dissociation with the methoxy channel, but becomes important at temperatures above 1500 K due to its high A factor. At temperatures below 1200 K, the stabilized adduct will exist in equilibrium. Reactions of CH3OO● with alkyl radicals are also important and needs to be in the reaction mechanism: CH3OO● + CH3● [CH3OOCH3]* CH3O● + CH3O●
Hrxn = -29 kcal mol-1
4.1.2.2 Kinetics for HCO● + O2
The mechanism for the oxidation of formyl radical with oxygen is based on the quantum calculations performed by Hsu, et al.97 The optimized geometry and frequencies for the reactants, adducts, transition states and products were calculated at the hybrid density functional B3LYP/6311G(d,p) level of theory. Thermodynamic properties were determined by statistical mechanics. The addition rate constant was obtained directly from Hsu, et al.’s VTST calculations. The reverse rate constant was calculated based on a fixed activation barrier equal to the well depth and the pre-exponential A-factor is determined from the principles of least square analysis that satisfies the microscopic reversibility criteria. The high-pressure limit rate constants for the isomerization, molecular elimination, dissociation and -scission reaction channels were determined by canonical transition state theory. The addition of oxygen to formyl radical forms an activated adduct that undergo the reverse reaction, stabilization, isomerization through a four-member ring transition state or molecular elimination through a four-member ring transition state. The molecular elimination channel is the lowest exit channel in this system. The barrier through the isomerization channel is higher than the entrance channel. Hsu, et al.’s single point G2M calculations report the molecular elimination channel being more than 12 kcal mol-1 lower than the entrance channel and the isomerization channel being about 6 kcal mol-1 above the entrance channel. The isomerization channel forms a hydroperoxide-carbonyl radical, HOOC●=O, which can dissociate to form CO + HO2 or -scission to form CO2 + OH. Both pathway barriers are below the entrance channel and Hsu, et al. reports the formation of CO2 + OH being about 9 kcal mol-1 lower than the dissociation pathway. It is interesting to note here that Sebbar et al.35 have shown a class of radicals where the radical site on the ipso-carbon bonded to a hydroperoxide will immediately form a carbonyl + OH without a barrier, which in this system will be CO2 + OH. The investigation of the -scission barrier transition state reported by Hsu et al. is outside the scope of this current investigation. The presence of this saddle point transition state, relative to our current oxidation mechanism, is also moot since the hydrogen shift barrier is about 20 kcal mol-1 higher than through the molecular elimination channel. 49
4.1.3 Formation of C2 Species 4.1.3.1 CH3● + CH3●
The mechanism also includes the kinetics of several C2 species. The formation of C2 species is from the combination of two methyl radicals to form ethane98. This association reaction forms an activated ethane molecule (CH3CH3*) with no barrier. This is an important reaction because, as noted above the methyl radical reactions proceeds to CH3OO●. This methyl peroxy radical primarily dissociates back to CH3● + O2 because there is no low energy forward reaction channel. Thus the methyl radicals build up in the reactions system, and when the concentration is high enough this bimolecular reaction to CH3CH3* is important. The ethane molecule can be stabilized, undergo simple dissociation (reverse reaction) or undergo two other reaction pathways; one is CH3CH2—H dissociation to form the ethyl radical plus hydrogen atom and the other is formation of H2 + C2H4. Both of these reaction paths are higher in energy than reverse reaction to two methyl radicals, so formation of ethane is important. 4.1.3.2 CH3-O-CH2● + O2
The dimethyl-ether oxidation reaction used in this study is taken from the study by Yamada et al.99,100 This oxidation system consists of two wells. The addition of oxygen molecule to dimethyl-ether forms an activated dimethyl-ether peroxy radical which can stabilize, undergo dissociation (reverse reaction) or isomerize to form ●CH2-O-CH2-OOH radical through a 6member ring transition state. The ●CH2-O-CH2-OOH adduct can also undergo a reverse isomerization back to CH3-O-CH2-OO● radical or undergo a complex dissociation pathway to yield two formaldehyde molecule plus OH. Yamada, et al. also provides pathway to form the 1,3 dioxtene + OH products, but due to the tight transition state and higher barrier, this pathway is not important. We include this pathway in our analysis for completeness. 4.1.3.3 C2H5● + O2
Abstraction of hydrogen from ethane by radicals from the radical pool forms ethyl radicals. The ethyl oxidation system used in the current mechanism is from Sheng, et al.28, where the dominant products are the peroxy radical and C2H4 + HO2. The direct HO2 elimination channel is the only pathway in the ethyl + O2 system with a barrier below the entrance channel. As a result, formation of the stabilized C2H5O2 adduct is important at low to moderate temperatures and its subsequent reactions needs to be included in the kinetic mechanism. Addition of the oxygen to ethyl radical forms an energized ethyl-peroxy adduct. There are six possible reactions for this activated adduct: 1) reverse reaction back to reactants, 2) stabilization, 3) direct molecular elimination to C2H4 + HO2, 4) hydrogen shift isomerization to 2 hydroperoxide-ethyl adduct, 5) dissociation to O atom to form an ethoxy radical plus oxygen atom, and 6) H-shift from ipso-carbon to form acetaldehyde plus hydroxyl radical. The O atom channel become s competitive above 1500 K, because of its loose transition state structure and results in chain branching. Channels (1), (2) and (3) that are itemized above for the activated adduct are important reactions at low temperature hydrocarbon oxidation. The hydrogen shift isomerization channel to form the 2 hydroperoxide-ethyl radical is not competitive with the HO2 molecular elimination channel. Besides the hydrogen shift isomerization pathway, another possible pathway to form the 2 hydroperoxide-ethyl adduct would be the addition of HO2 to ethylene (the reverse -scission channel) which is readily formed via the low barrier molecular elimination channel. The 50
products ethoxy + O are estimated to have an endothermicity of over 25 kcal mol-1 above the reactants and the rate constants at low temperatures would not be significant compared to the other channels, but becomes more important at higher temperatures. A sixth channel for the ethyl-peroxy adduct is the formation of an aldehyde. The activated ethyl-peroxy adduct undergoes a 4-member ring transition state, which then undergoes OH elimination to form acetaldehyde. The barrier required is 6.4 kcal mol-1 above the reactants. This system has a second well, formation of the 2 hydroperoxide-ethyl radical from the hydrogen shift of the ethyl-peroxy adduct. The energized 2 hydroperoxide-ethyl adduct can undergo four different reactions: reverse reaction back to ethyl-peroxy radical, stabilization, -scission to C2H4 + HO2 products or react through a three-member ring transition state to form oxirane + hydroxyl. The reverse reaction to ethyl-peroxy radical has a barrier of about 18.5 kcal/mol. The transition state to form C2H4 + HO2 is about 0.5 kcal/mol higher than that to form oxirane + OH. Both the C2H4 + HO2 and the oxirane + OH channels have energy barriers that are below the reactants. It is important to illustrate the reactions of the 2 hydroperoxide-ethyl radical because it is the reactions of these hydroperoxide alkyl radicals (with a second O 2) that lead to important chain branching at moderate temperature hydrocarbon oxidation. According to the Walker and Morley scheme101, the 2 hydroperoxide-ethyl radical is an important chain branching intermediate needed to explain low temperature ignition kinetics, especially for the negative temperature coefficient regime. The hydrogen shift to form a hydroperoxide alkyl radical for further reaction with O2 is the most important reaction leading to chain branching in all larger systems. Walker and Morley’s chain branching scheme initiates with the addition of oxygen to an alkyl radical forming an alkyl-peroxy radical. This radical will then undergo either an abstraction reaction to form a hydroperoxide-alkane or a hydrogen shift isomerization to form a hydroperoxide-alkyl radical. The stable hydroperoxide-alkane will then cleave the O-O bond to form an alkoxy + hydroxyl radical. The hydroperoxide-alkyl radical can undergo a second O2 addition, which will lead to a hydroperoxide-alkylperoxy radical. The hydroperoxide-alkylperoxy radical can lead to several possible chain branching reactions. The detailed summary of the 2 hydroperoxide-ethyl + O2 system is described later in this work. 4.1.3.4 ●CH2CH2OOH + O2
The importance of chain branching implications for this system is explained in detail by Bozzelli and Sheng93 is summarized here. Two possible formation pathways for the 2 hydroperoxy-ethyl radical are provided in previous section. The addition of O2 to the 2 hydroperoxide-ethyl radical forms an activated hydroperoxideethylperoxy adduct that can undergo a number of reactions: 1) reverse reaction back to reactants, 2) collisional stabilization, 3) a hydrogen shift via a five- member ring transition state (TS1), 4) direct molecular (HO2) elimination (TS2), 5) a hydrogen shift through a four-member ring transition state (TS3), and 6) dissociation to a diradical + OH channel. The overall reaction process is complex, involving several reactions of the energized and stabilized adduct all at competitive reaction rates. Both TS1 and TS2 will be fast reactions to products with barriers below the entrance channel. The well depth for stabilization is 35 kcal mol-1. The 1,4 hydrogen shift (five-member ring) channel forms an unstable HOOCH2C●HOOH, which immediately undergo -scission to HOOCH2CH(=O) + OH92,98,102. The HOOCH2CH(=O) formed is chemically activated and can further dissociate to OH + formyl-methoxy radical,
51
before stabilization. The “net” reaction for this channel would be HOOCH2CH2OO● ●OCH2CH(=O) + 2 OH. This channel is chain branching. The hydroperoxy-ethylperoxy adduct can also undergo unimolecular HO2 elimination leading to a vinyl hydroperoxide + HO2. The O—O bond in the vinyl hydroperoxide is weak, with a bond energy about 22.5 kcal/mol92,98,102. The vinyl hydroperoxide rapidly dissociates by breaking the O—O bond to form formyl-methyl plus OH radicals. This is a low energy chain branching pathway. The third transition state (denoted as TS3) is a 4-member ring H-shift from the ipso-carbon to the peroxy oxygen. An unstable dihydroperoxy-ethyl radical structure (HOOCH2C●HOOH) is formed, which will immediately eliminate an OH and form the strong carbonyl bond in hydroperoxy-acetaldehyde + OH. The unstable HOOCH2C●HOOH is the same species as the 5member ring isomerization channel discussed earlier and this channel can proceed in the same fashion. Since this channel will form the same unstable species discussed earlier, this channel would also be chain branching. The sixth possible pathway for the activated adduct is the hydroperoxide O—O bond cleavage which would result in a diradical + hydroxyl radical, (●OCH2CH2OO● + OH). This is about 9 kcal mol-1 above the entrance channel, but has a loose transition state structure. Bozzelli and Sheng93 have reported that this reaction becomes more important with increase in temperature and pressure. This second O2 addition to the original hydrocarbon (ethyl) system shows all four product channels lead to subsequent radical formation products resulting in chain branching. These subsequent chain branching reactions are all at lower energies than at its current products, which will also help accelerate the overall reaction by “shifting” the 2 hydroperoxide-ethyl radical out of the ethyl + O2 system. The molecular elimination and the 5-member ring hydrogen shift channel are the fastest product channels leading to chain branching. The formation of the diradical has secondary importance from the perspective of rate constants and this system, with its chain branching reactions, are included in our current overall kinetic mechanism. 4.1.3.5 C2H3● + O2
Vinyl radicals can be formed from hydrogen abstraction reactions on ethylene molecule. The vinyl oxidation system is obtained from Chang et al.27 It includes five possible stabilized adducts with multiple exit channels. Also included is the formation of the three-member ring dioxiranyl radical, which has been recognized to be an important channel103,104. This is a complex system with multiple wells leading to different product sets. The O2 addition to the vinyl radical forms an activated adduct that can undergo six different pathways, one of which is the reverse back to reactant. There are two pathways that have barriers below the entrance channel. The lowest exit barrier is through the three-member ring dioxiranyl radical which further reacts to form formaldehyde + formyl radical. Another product set that has barrier below the entrance channel is to the product set of ●CH2CHO + O, which would also be competitive. The other three channels for the activated peroxy adduct all have barriers that are nearly that of the reverse reaction. 4.1.3.6 CH3C●O + O2 and ●CH2CHO + O2
These two subsystems are obtained from Lee et al.105 where thermochemical and kinetic properties are calculated at the CBS-Q level of theory. Both reaction systems initiate by the 52
addition of oxygen onto the radical site forming a peroxy radical. One product set resulting from both systems is the formation of CH2CO + HO2. In both oxidation systems, the CH2CO + HO2 products can be formed through two channels; direct molecular elimination from the activated peroxy radical or via -scission of the hydroperoxy radical formed from isomerization. The activated peroxy radical species can stabilize or undergo direct molecular elimination or isomerize to a hydroperoxy radical. The hydroperoxy radical can then -scission to the CH2CO + HO2 product set. The other channel the hydroperoxy radical, resulting from the CH3C●O + O2 subsystem, can undergo is ring closure to form a carbonyl-oxirane species plus OH. In the C●H2CHO + O2 subsystem, the hydroperoxy ethyl-aldehyde radical can also undergo a fast reaction, albeit complex, to form the product set consisting of OH + CO + CH2O. 4.1.3.7 Pentyl Radicals
Reactions of n-pentyl radicals C5H11-1, C5H11-2 and C5H11-3 (denoted for short as PN-1J, PN-2J, and PN-3J with J being the radical site, vide supra) at carbon numbers 1,2 and 3. This nomenclature can be considered more relevant for hydrocarbons surrogates with an extended linear carbon backbone for the diverse oxygenation processes in the larger, fuel component hydrocarbons such as heptane and decane. For example, the n-pentan-2 peroxy radical generated by a H-abstraction from a secondary carbon site, can undergo several intramolecular isomerization (H atom transfer) reactions to the peroxy radical site through six and sevenmember cyclic structures with low ring strain, leading to different product channels. Association of alkyl radicals with ground state oxygen molecule generates chemically activated peroxy intermediates, which can isomerize or further react to form new products before stabilization. The lowest energy reaction for alkyl peroxy in the C3 and larger n-hydrocarbons is an isomerization (intramolecular H atom transfer) that forms a hydroperoxide alkyl radical on a secondary carbon site; but a second competing path slightly higher in energy barrier leads HO2 plus an olefin. The low energy product, hydroperoxide-alkyl radical isomer, can undergo further chemical activation via association with second oxygen (O2), where three of the dominant reactions paths result in chain branching. The processes result in a competition at temperatures below 1000 K, between the HO2 + olefin, which is a termination path from the first O2 association and the chain branching from the second chemical activation step. Highest possible/reasonable computational level is used for this border sized hydrocarbon system. A comprehensive potential energy diagram developed from multilevel CBS-QB3, G3B3, CBS-APNO and single level ab initio and density functional theory methods, is used for analysis of the secondary n-pentan-2yl and hydroperoxide-pentan-4yl radical associations with O2. The thermochemistry and kinetics of the chemical activation and stabilized adduct reactions important to chain branching and termination are determined and discussed. The results show that the barriers to the chain branching reactions are lower and that there is slightly less competition from the termination (HO2 + olefin) path in this larger radical than has been observed in ethyl and propyl radical plus O2 reactions. The rate constants for the addition of O2 molecule to pentyl and hydroperoxyl pentyl radicals were obtained from the generic reaction of C2H5+O2 calculated with VTST. The reaction coordinate along the C-O bond length is calculated to determine the total energy. Rate constants are calculated on the basis of the most favorable dissociation pathway along the reaction surface calculated at the B3LYP/6-31G(d) level.
53
The rate constants for the dissociation and isomerization reactions are calculated by canonical transition state theory, with thermochemical properties determined at the CBS-QB3 level of theory. The potential energy surface of formed peroxy radical (PN-2QJ in this case) involves several, low energy intramolecular transformation channels, elementary reactions included in the master mechanism (Figure 18):
CH3CH.CH2CH2CH3 + O2 OH O | C-C----C-C-C OH
PN-2J+O2
+1.2
O
0.0
CBS-QB3 level
O
C-C-C-C-C
TS-1f-1 O O H | C-C-C-C-C
-6.3
14.5
-7.7
O
O H
H C-C-C-C-C
TS-1f-2
O OH TS-2f-0
TS-2f
-7.4
O
C-C-C-C-C
TS-2f-1 -8.1
C-C-C-C-C
-13.7 TS-2f-2 CCJQ...C3H6
TS-1f
C5H10-2+HO2
-13.3
16.1
-17.8
-16.1
9.1
37.5
10.4
PN-2Q4J
14.8
-22.8 PN-2Q3J
19.7
OH O | C-C-C-C-C
13.8
OH O | C-C-C-C-C
O C-C
C-C +OH C
O O | C-C-C-C-C
30.1
31.3
-23.7
14.8
-37.8 -41.4
-37.5 CH3CHO+C3H6+OH
PN-2QJ +R.
-44.4
RH+CH3C O+ C3H6
+R.
O C-C--C-C-C + OH
RH+CH3CHO +C3H5
Figure 18. PE Diagram of First O2 Addition to Secondary N-Pentyl-2 Radical (PN-2J) Note: Calculated at CBS-QB3 Level.
a) Transfer of C(4) β-hydrogen atom to the peroxy radical (intramolecular H-abstraction) via a 6 member ring transition state TS-1f. The resulting PN-2Q4J radical can undergo dissociative ring closure to sym-dimethyl-oxetane structure through TS-1f-1and eliminate OH, or undergo higher barrier decomposition reaction to acetaldehyde, propene and OH-radical via TS-1f-2. Q represents the –OOH group and Qj represents the peroxy R-OO•. (well depth = 37.5 kcal mol-1)
PN-2J + O2 = [PN-2QJ]* [PN-2QJ]* = PN-2Q4J channel)
(barrier 19.7 kcal mol-1, 17.8 kcal mol-1 below the entrance
PN-2Q4J = 2,4-dimethyl-Oxetane + OH
(two steps, overall barrier 29.8 kcal mol-1)
PN-2Q4J = CH3CHO + C3H6 + OH
(two steps, overall barrier 38.7 kcal mol-1)
b) Similar intramolecular H atom transfers can occur at the primary α- and γ-sites (via 5 and 7 member ring TS, correspondingly). The barrier for an extended TS is close to that of the six member ring (reaction PN-2QJ = PN-2Q4J, see da Silva et al.106), while H-abstraction at the C(3) α-position has a higher barrier viz., 31.3 kcal mol-1(TS-2f). c) Abstraction of C(3) α-hydrogen atom via TS-2f leads to the formation of a PN-2Q3J intermediate radical, where reverse reaction has a substantial (17.5 kcal mol-1) barrier height.
54
This H-transfer barrier is now lower than in isopropyl-peroxy and approaching the competing HO2 molecular elimination barrier. PN-2QJ = PN-2Q3J There are two paths for decomposition of the PN-2Q3J intermediate: (i) formation of 3membered ring structure (2-methyl-3-ethyl-oxirane) plus OH radical (Dissociative Ring Closure via TS-2f-2) and (ii) Beta Scission to HO2 and pentene-2 (TS-2f-1). PN-2Q3J = 2-Methyl-3-Ethyl-Oxirane + OH PN-2Q3J = HO2 + PN-2* d) Concerted elimination of HO2 to form an olefin from either the adjacent primary or the C(3) sites, where barriers are ca 30 kcal mol-1 relative to the stabilized adduct (TS-2f-0). PN-2QJ = 2 C5H10 + HO2
(barrier 30.1 kcal mol-1)
These olefin + HO2 molecular elimination reactions are chain termination at low temperatures as the HO2 can react with another HO2 to form H2O2 + O2 (H2O2 is important at higher temperatures governing second ignition stage). PN-2QJ = HO2+ PN-2* The H-atom transfer process from a primary α-site has a similar barrier to TS-2f of the Potential energy surface (PES); and it is not included in PE diagram for clarity. The H-atom transfer via formation of a seven-member transition state, has a lower effect on overall reaction kinetics due to the lower pre-exponential factor stipulated by the entropic effects (Zhu et al.107 and unpublished data). The lowest barrier in this reaction system corresponds to reaction through TS-1f (19.7 kcal mol-1) with formation of hydroperoxide radical PN-2Q4J, but further reaction has to overcome higher product formation barriers. While H-transfer reaction has a low barrier, the reverse isomerization has an even lower barrier ca. 5.9 kcal mol-1 (and a lower pre-exponential factor) and hence it is fast. The low forward and reverse barriers can result in a near equilibrium for this PN-2Q4J hydroperoxide alkyl radical under certain combustion conditions. As a result, PN-2Q4J can undergo association with a second O2 molecule (second oxygenation step) forming an activated hydroperoxide-pentyl peroxy radical PN-2Q4QJ. A number of reaction pathways exist for this hydroperoxide – peroxy radical intermediate. Potential energy diagrams for the second oxygenation step, viz., the association of this PN-2Q4J intermediate with a second oxygen molecule is shown in Figure 19 and more complete surface in Figure 20, where the activation energy (well depth) is 36.9 kcal mol-1.
55
CH3CH(OOH)CH2CH.CH3 +O2
PN-2OJ4QJ + OH Biradical
HO
O O H O CH3-CH-CH-CH-CH3
PN-2Q4J+O2
TS-2s
0.00
-5.0
HO
TS2s-0 TS2s-1 -6.3 -8.5
HO O O H O CH3-C-CH2-CH-CH3
36.9
O O O | | C-C-C-C-C + OH
Triplet O
H O
8.2
O CH3-CH-CH-CH-CH3
-0.7 (0.3)
TS-2s-2 -10.4
HO2+ PN-2Q3*
13.2
-21.2 TS1s
15.5
-15.2
Singlet
36.2
PN-2*O4OJ
11.3
-18.0 +OH+ OH
32.0 OH -21.7 PN-2Q3J4Q O O 15.2 CH3-CH-CH-CH-CH3 OH
15.7
47.9 O -36.9 O CH3-CH-CH2-CH-CH3 HO O
PN-2Q4QJ
HO
HO O
O
O-OH
CH3-C-CH2-CH-CH3
-65.9
O
+ OH
CH3-CH-CH-CH-CH3
Keto-Q
29.0
-39.7.
PN-2*O4Q + OH
vdw {PN-2*O4Q...OH}
6.1
-72.0
Figure 19.Fragment of the PE diagram of Oxygenation of 2-Hydroperoxide-N-Pent-4-yl Radical (PN-2Q4J + O2) Note: Calculated at CBS-QB3 level illustrating chemical activation pathways.
There are several low energy chain branching and termination pathways and a number of higher energy paths with very intriguing intermediates on this energetic hyper-surface. The lowest energy reaction barrier revealed is intramolecular H atom transfer from the carbon with the peroxide group to the peroxy radical, TS-1s, where the barrier is some 21.2 kcal mol-1 below the entrance channel. This path forms an alkyl radical on the hydroperoxide group where the intermediate is not stable; it dissociates to form a strong carbonyl double bond (keto-Q) gaining 80 kcal mol-1, which is sufficient to immediately cleave the weak RO—OH bond (45 kcal mol-1) in the hydroperoxide. Relative to the stabilized adduct this reaction to (keto-Q+OH), product set is 65.9 kcal mol-1 below the entrance channel, with the TS-1s is 21 below the entrance channel and only 15.7 kcal mol-1 above the stabilized peroxy adduct.
56
CH3CH(OOH)CH2CH.CH3 +O2 OH
O O H O CH3-C-CH2-CH-CH3
O +OH O O Perdioxetane C-C-C-C-C
15.9
HO
O O H O CH3-CH-CH-CH-CH3
PN-2Q4J+O2
-5.0 TS-2s
0.00
TS-2s-1
PN-2OJ4QJ + OH Biradical O O O TS4 | | C-C-C-C-C + OH 0.7 TS3 -0.7 OH+
(0.3)
-6.3
36.92
OH O O + OH C-C-C - - C-C O O
TS O-insertion
O
O H H3 C
37.6
15.5 -15.2
C
TS4iso
16.8
H 3C
PN-2Q4QJ O HO O
HO O
-65.9
H 3C
Keto-Q O OH
OH + OH
C
+ OH CH C CH3 H2
60.8
O O H
O
PN-2*O4OJ
-28.9
PN-2Q3J4Q
C-C-C-C-C
-18.0
+ OH
32.0
OH
CH2
O
-29.8
O O CH3-CH-CH2-CH-CH3
CH CH3
TS5-1 -20.1
15.7
-36.92
-5.1
O
-11.2
HO2+ PN-2Q3*
-21.7
TS5
C-C-C-C-C
HO O O H O CH3-C-CH2-CH-CH3
-21.2 TS1s
17.8
CBS-QB3 level
C O
C CH3 CHH2 + OH
47.9
Criegee vdw
Keto-zQ
29.00
PN-2*O4Q+OH
vdw {PN-2*O4Q...OH}
6.1
-72.0
O
OH
C-C-C-O-C-C
+OH
-115.3
Figure 20. Detailed PE Diagram for Oxygenation of 2-Hydroperoxy-4-N-Pentyl (PN-2Q4J +O2) Note: Calculated at CBS-QB3 level. For clarity, some channels are not included.
The reaction forms a chemically activated ketone - hydroperoxide, with 44.7 kcal mol-1 of energy relative to the intramolecular H-transfer TST barrier. This activated ketone - hydroperoxide can cleave the remaining weak RO--OH (47.9 kcal mol-1) forming a second OH radical plus an alkoxy radical. The overall H-transfer process forming two OH and one peroxy radical is chain branching. PN-2Q4J + O2 = PN-2Q4QJ
(well depth = 36.9 kcal mol-1)
PN-2Q3J4Q = PN-2*O4Q +OH
(TS-1s , Ea =15.7 kcal mol-1)
PN-2*O4Q = PN-2*O4OJ + OH
(bond energy (BDE) = 47.9 kcal mol-1)
We have also calculated the formation of a singlet biradical (and its van der Waals complex with the leaving OH group, Fig. 20). Importantly, this product set barrier is on the level of entrance channel and this new pathway can be considered as a relevant low energy one. A second chain branching step is a cleavage of hydroperoxy bond RO--OH of the hydroperoxide RO—OH bond in the peroxy radical formed by the chemical activated association. The product (a triplet biradical) is localized at 8.17 kcal mol-1 above the entrance channel; however, the reaction occurs to significant extent at temperatures above 1100 K due to the high preexponential factor of the simple dissociation. PN-2Q4QJ = PN-2OJ4QJ +OH (BDE-triplet= 45.1 kcal mol-1; BDE-singlet = 36.2 kcal mol-1) PN-2OJ4QJ = CH3CHO+ CH2JC(OOJ)CH3 (vide infra) 57
Summary of Chain Branching Reaction Schemes: (i) The main chain-branching channel in this series of two O2 association (chemical activation) reactions is: (Well depth = 36.9 kcal mol-1)
PN-2Q4J + O2 = PN-2Q4QJ PN-2Q3J4Q = PN-2*O4Q +OH
(TS-1s ; Ea =15.7 kcal mol-1, ΔHrxn= -66 kcal mol-1)
PN-2*O4Q (+OH) = PN-2*O4OJ + OH (+ OH)
(BDE = 47.9 kcal mol-1)
(ii.) A second possible chain branching path is via the formation of a singlet propyl peroxy biradical. PN-2Q4QJ = PN-2OJ4QJ + OH (BDE = 36.2 kcal mol-1 including vdW stabilization) PN-2OJ4QJ (+OH) = CH3CHO + CH2JC(OOJ)CH3 (+OH) The fate of precursor biradical PN-2OJ4QJ is not apparent. This triplet biradical can decompose through a number of paths (i.) to triplet oxygen, acetaldehyde and propene or (ii.) to 2 CH3CHO + CH2O (as the first CH3CHO is leaving the peroxy oxygen bonds to the new radical forming a dioxetane with sufficient energy to cleave the peroxide bond); this is not chain branching, but highly energetic. (iii) Detachment of CH3 with formation of CHO-CH2-CH(OOJ)CH3 radical becomes feasible with a 22 kcal/mol activation energy depending on the conformation of formed propyl peroxy biradical. This overall channel could be also considered chain branching. The more energetically preferred (by ca 8 kcal/mol) singlet state (Fig. 18) can generate reactive singlet 1∆g (O2). (Kinetic) QRRK-Master Equation Analysis. Chemical activation and unimolecular dissociation kinetic analysis is performed on the reaction systems illustrated in the PE diagrams (Figs. 18 and 20), which are scaled to the ∆Hfo298 of PN-2J+O2 and PN-2Q4J+O2 reactants set to zero. The association potential curve was analyzed with B3LYP, BMK and TPSSLYP1W density functional methods, each with 6-31G(d,p) and
6-311+G(2d,p) basis sets.
58
Chemical Activation of PN-2J+O2 13
12
11
Log(k/atm)
10
9
PN-2QJ 8
PN-2J+O2 HO2+C5H10-2
7
PN-2Q4J
6
C(CYOCC)C+OH 5
4 0.5
1
1.5
2
2.5
3
1000K/T
Figure 21. Rate Constants of First Chemical Activation Reactions (PN-2J+O2) Note: Data is at 1 atm pressure. Squares represent dissociation of the adduct back to reactants.
Reaction kinetic parameters are determined for the energized peroxy and hydroperoxide alkylperoxy adducts and their reactions to stabilization, new products and to reverse channels were determined using multi-frequency QRRK analysis for k(E) [1,7] with the steady-state assumption on the energized adduct(s) and Master Equation analysis for fall-off. A (ΔE)odown of 830 cal mol-1 was used in the ME analysis with N2 as a third body . The results of this kinetic analysis for the primary channels, viz., the chemical activation rate constants and branching ratios as function of 1000/T at 1 atm pressure, are illustrated in Fig. 21 and Fig. 22 for PN-2J plus O2 chemical activation and for the stabilized PN-2QJ peroxy radical dissociation reactions.
59
Dissociation of PN-2QJ Adduct 10
5
Log(k/atm)
0 0.5
-5
1
1.5
2
2.5
3
PN-2J+O2 HO2+C5H10-2
-10
PN-2Q4J C(CYOCC)C+OH
-15
1000K/T
Figure 22. Temperature Dependence of Dissociation Rate Constants for PN-2QJ Adduct (P=1atm)
PN-2QJ + O2 Chemical Activation Reaction. The chemical activation reaction of the PN-2J + O2, (Fig. 21) shows that stabilization of the peroxy radical PN-2QJ is dominant up to near 1000K where the stabilized hydroperoxide alkyl PN-2Q4J adduct increases steadily and at 1000K is formed with at similar rates to the peroxy radical, which is now in the fall-off. The PN-2Q4J reaction shows the chain branching. The oxirane and OH and the chain termination step, 2 pentene plus HO2, are approximately one and two orders of magnitude below the PN2Q4J formation to well above 1000K. PN-2Q4J Dissociation Reactions. Dissociation of the stabilized PN-2QJ shows the same trend as seen in the chemical activation steps. The PN-2Q4J isomer dominates the oxirane plus hydroxyl and HO2 molecular elimination channels to temperatures above 1000K. PN-2Q4J+O2 Chemical Activation Reactions (Second O2 Association Step). Fig. 23 illustrates the rate constants for the chemical activation reaction of the PN-2Q4J+ O2 reaction system at 1 atm. pressure versus 1000/K. The stabilized hydroperoxide–peroxy radical PN-2Q4QJ is the primary product up to 900 K where the ketohydroperoxide plus OH (PN-2*O4Q + OH) and the chain branching 2-pentanone-4oxy radical + 2OH reactions become competitive at 600 and 900 K respectively. The biradical (PN-2OJ4OJ)+OH channel mirrors the 2-pentanone+2OH reaction path. The stabilized hydroperoxy radical, the biradical, and the two chain branching reactions are the dominant reaction processes in this reaction system. Dissociation of PN-2*O4Q* versus stabilization is calculated using the fraction of energy from the H-transfer barrier remaining in this carbonyl intermediate based on its reduced number of vibrations after loss of OH. The energy from the TST barrier to the products of PN-2*O4Q* + OH is some 35 kcal mol-1 higher than the RCO—OH bond energy in the carbonyl product, clearly sufficient at combustion conditions to scission the remaining peroxide bond. 60
Chemical Activation of PN-2Q4J+O2
12
LOg(k/atm)
10
8
PN-2Q4QJ PN-2Q4J + O2
6
HO2+PN-2Q4* PN-2OJ4QJ+OH 4
PN-2*O4Q+OH PN-2*O4OJ+2OH
2 0.5
1
1.5
2
2.5
3
1000K/T
Figure 23. Rate Constants of Second Chemical Activation Reactions (PN-2Q4J + O2) at 1 atm Pressure
Dissociation of PN-2Q4QJ Adduct
7
LOg(k/atm)
3
-1
PN-2Q4J + O2 HO2+PN-2Q4*
-5
PN-2OJ4QJ+OH PN-2*O4Q+OH
-9
PN-2*O4OJ+2OH -13 0.5
1
1.5
2
2.5
3
1000K/T
Figure 24. Temperature Dependence of Dissociation Rate Constants for PN-2Q4QJ Adduct, at 1 atm Pressure
61
Dissociation Reactions of the Stabilized PN-2Q4QJ Adduct. Fig. 24 illustrates the rate constants for dissociation of the PN-2Q4QJ (2 hydroperoxide–4 peroxy pentane radical) versus 1000/T at 1 atm. The dominant path at low temperatures is the ketohydroperoxide plus OH (PN-2*O4Q + OH) reaction path. At 850 K and above the two chain branching paths 2-pentanone-4oxy + 2OH and biradical PN-2OJ4OJ + OH are similar and the dominant reaction paths along with the reaction back to reagents. 4.1.3.8 Mechanism for Low Temperature Oxidation of n-Heptane and n-Decane
As mentioned above, the PES for the second oxygen association (double activation reaction system) is studied in detail at the n-pentane level. The smaller size of n-pentane relative to nheptane, n-decane or larger hydrocarbons allows higher level calculations to be performed for increased accuracy in determining the thermochemistry and kinetics. In this version of Master Mechanism HP-P-DC-TMB, pentane part includes additionally comprehensive initiation and dissociation block. The revealed mechanism and adopted energetic parameters were used for analogous radicals of n-butane, n-hexane, n-heptane and n-decane to evaluate corresponding reaction rate parameters using QRRK/master equation analysis method. DC-2Q4J+O2 Activation 12.5
12
11.5
log k (s-1)
11
10.5 DC-2Q4QJ 10
DC-2Q4J + O2 HO2 + DC-2Q4 DC-2OJ4QJ+OH
9.5
DC-2*O4Q+O DC-2*O4OJ+2O 9
8.5 0.6
0.7
0.8
0.9
1
1.1
1.2
1.3
1.4
1.5
1000K/T
Figure 25. Rate Constants of Second Chemical Activation Reactions (DC-2Q4J + O2) at 1 atm Pressure
While reactions of BU-nJ and HX-nJ radicals are presented only with their activation blocks, nheptane and n-decane subsystems are extended to include all possible decomposition, isomerization and recombination elementary reactions. Kinetic parameters for these reactions were taken from literature where available or estimated and calculated.
62
General kinetic trends are similar to those in n-pentane oxidation system. For illustration, in Figure 25 we present temperature dependence of the rate constants for the chemical activation reaction of the n-decane hydroperoxy radical, viz., reaction system DC-2Q4J+ O2, at 1 atm. The stabilized hydroperoxide–peroxy radical DC-2Q4QJ is the primary product up to 1000 K where the ketohydroperoxide plus OH (DC-2*O4Q + OH) and the chain branching 2-pentanone4oxy radical + 2OH reactions become competitive at 600 and 900 K respectively. The last one is a prevailing one at T>1000K. The biradical (DC-2OJ4OJ)+OH channel mirrors the 2decanone+2OH reaction path. The stabilized hydroperoxy radical, the biradical, and the two chain branching reactions are the dominant reaction processes in this reaction system as well. Dissociation of DC-2*O4Q* versus stabilization is calculated using the fraction of energy from the H-transfer barrier remaining in this carbonyl intermediate based on its reduced number of vibrations after loss of OH. As indicated above, the energy from the TST barrier to the products like DC-2*O4Q* + OH is some 35 kcal mol-1 higher than the RCO—OH bond energy in the carbonyl product, clearly sufficient at combustion conditions to scission the remaining peroxide bond. Some illustrative kinetic parameters are presented below for activation reactions of n-decane radicals. 4.1.4 Comparisons of Mechanism to Experimental Results
Only one pressure dependent mechanism file is used to model all the experimental data that are presented in this current study. All the model comparison results presented are done without any model parameter adjustments. The experimental data that are used in comparison to the current model covers a wide range of reaction environment. The temperature ranges from less than 800 K to 1500 K, and pressure ranges from 0.05 to 15 atm. The experimental environment for the observed data consists of methanol pyrolysis, methanol oxidation and mixtures of methanol and methane oxidation conditions. The combustion conditions for the experimental conditions also varied from fuel lean to stoichiometric to fuel rich conditions. Comparisons of the model with experimental results for methanol pyrolysis at 1 and 3 atm are illustrated in Figures 26 and 27. These comparison results are identical to the results we presented previously in Ing et al.88 Good agreement for reactant decay and major product formation at 1 atm is observed. At 3 atm, the model prediction is faster than experimental data by about 0.5 seconds. Methane formation is under predicted at both conditions. At 1 atm, the model under predicts methane formation by about one order of magnitude and the prediction improves slightly at 3 atm.
63
Figure 26 Comparison of Model and Experimental Data for Methanol Pyrolysis at 1073 K, 1 atm and Initial Methanol Mole Fraction of 3.95%.
64
Figure 27 Comparison of Model and Experimental Data for Methanol Pyrolysis at 1073 k, 3 atm and Initial Methanol Mole Fraction of 1.317%.
65
Figures 28–31 show comparisons of two modeling results to the experimental data. “Model I” represent the modeling results from Ing et al.88, and “Model II” data are the current results using our pressure dependent mechanism expressed in Chebyshev formalism. Figure 28 shows the comparison of the model to the experimental data for methanol oxidation at 873 K and 5 atm under stoichiometric condition ( = 1). Both modeling results show reasonable agreement for reactant decay and major products formation. The largest deviation between the model results and experimental data for major products is CO, where the model under predicts the CO mole fraction by about 0.001. Both modeling results are able to capture and predict the trend in formaldehyde formation. A slight difference between the two modeling results is seen in the prediction of CH4, where Model II predicts a slightly lower concentration of CH4 – closer to the observed data. Both models match the experimental results for CH4 reasonably and with half a second delay in the model. A comparison of methanol oxidation at 923K and 3 atm is shown in Figure 29. The differences between Model I and Model II for the major species are negligible. The one noticeable difference between Model I and II is a lower methane formation, consistent with previous results shown in Figure 28. Both sets of results show a 0.15 second lag relative to the experimental data. The models are able to predict the trends in concentration profiles of both the major and minor products. In general, there is a longer time delay in the models compared with experimental data at lower pressures. Comparison between the two models to various methane/methanol mixture ratios were performed and shown in Figures 30 and 31. The experimental conditions for both plots are at 873 K, 5 atm and equimolar concentrations of methane and methanol, with a fuel equivalence ratio of unity. The initial methane concentration in Figure 29 is 0.78% and in Figure 30 it is 0.39%. A significant difference between Model I and II is observed in Figures 30. Comparisons of trends between the two sets modeling results are similar. Model II provides a better match to experimental results for the major species than Model I. Methanol consumption is similar between both modeling results. Model II provides a higher CO formation and a higher methane consumption than Model I, providing a better match to the observed data. A higher CO2 concentration is also observed in Model II. Both models predict similar formaldehyde concentrations. Model II predicts less formation of C2H6 and C2H4 than Model I – with the observed data between the two modeling results. Both models predict a faster system than observed experimentally by about 0.5 seconds. Experimental conditions shown in Figure 31 are similar to Figure 30, with an initial methane concentration of 0.39%. Both Model I and II predict the same methanol consumption rate. Model II is better able to match the experimental CO concentrations, with Model I predicting slight lower concentration than observed. Methane concentration is also well predicted by both modeling results. Formations of minor species are shown in the bottom half of Figure 31. Both models are able to capture the trends, especially the inflection point observed in formaldehyde. Model I and II predicts similar formaldehyde and CO2 concentrations. Model II predicts a lower ethane and ethylene concentration than Model I, with the experimental data bound between the two modeling results.
66
Figure 28 Comparison of Model and Experimental Data for Methanol Oxidation at 873 k, 5 atm, = 1.0 and Initial Methanol Mole Fraction of 0.78%.
67
Figure 29. Comparison of Model and Experimental Data for Methanol Oxidation at 923 K, 3 atm, = 1.0 and Initial Methanol Mole Fraction of 0.78%.
68
Figure 30 Comparison of Model and Experimental Data for Methane/Methanol Mixture Oxidation at 873 K, 5 atm, = 1.0 and X0(CH4) = 0.78%, X0(CH3OH) = 0.78%.
69
Figure 31. Comparison of Model and Experimental Data for Methane/Methanol Mixture Oxidation at 873 K, 5 atm, = 1.0 and X0(CH4) = 0.39%, X0(CH3OH) = 0.39%
Comparison of our current model with experimental data from Aronowitz, et al.76 are shown in Figure 32. The observed data were performed at atmospheric pressure under non-isothermal conditions with an initial temperature of 998 K and a final temperature of 1043 K at an
70
equivalence ratio of 1.70. The model results shown in Figure 32 are calculated at the initial temperature of 998 K. The comparison shows a spatial offset compared to the observed data. The spatial position for the modeling results are determined by multiplying the residence time by 975 cm sec-1, the initial velocity provided by Aronowitz, et al. In doing so, we had assumed that the flow velocity was constant throughout the system. The model predicts methanol consumption is slightly faster than observed, while CO is slightly slower than experiment. H2 formation is well characterized by the model. Comparison of the minor species to the modeling results show an over prediction in formaldehyde, and an under prediction in methane and CO2. The model does capture the trends in CO2 and formaldehyde formation. The difficulties in accurate measurements of the minor species is also indicated by Aronowitz, et al. in explaining the fluctuations in their total carbon balance.
71
Figure 32. Comparison of Model Results to Experiments of Aronowitz et al.76
72
Comparison of the current Chebyshev model with experimental data on methanol oxidation from Held and Dryer’s86 flow reactor are shown in Figures 33–38. The uniqueness of Held and Dryer’s data is that the oxidation data are provided at higher pressures, e.g. at 15 atm. This provides an opportunity to test this single pressure dependent mechanism with available experimental data over large pressure differences. Held and Dryer claimed the data they provided has an uncertainty in the absolute “zero time” and a temporal shift is necessary for them to model the data. Held and Dryer’s flow reactor was also not performed under isothermal conditions, in some cases a rise in temperature of 50K is observed. The results from the current model are presented under isothermal conditions at the initial temperature provided by Held and Dryer. Comparison of experimental data with the current model at 1043 K with a pressure of 1 atm and at = 0.86, the results are shown in Figure 33. The model predictions do not match Held and Dryer’s observed data over the 0.2 second window. In order for us to determine if our model is able to capture the trends correctly, we expanded our time scale. Figure 34 shows the model data over a wider time scale, overlapping the actual 0.2 seconds of Held and Dryer’s data. We observe that over this longer time scale, our predictions do capture the complex trends almost identically compared to those observed experimentally. It is particularly interesting to note that the experimental data for formation of water and consumption of water do not follow a simple bimodal function, but rather a double bimodal function. The model, over the longer time range, is able to capture the two different formation rates observed for water and also the two different consumption rates observed in the oxygen data set. The minimum and maximum concentrations observed for the major species are also well characterized by our model, albeit on a different time scale. The model is also able to capture the trend in formaldehyde formation. The model over predicts both formaldehyde and formic acid. Comparison of experimental data at a slightly higher pressure of 2.5 atm and 949 K is illustrated in Figure 35. The model is able to predict the rapid changes in concentration for all the major species CH3OH, O2, H2O, H2, CO and CO2 and is in agreement with the experimental data over the same time scale. Both formaldehyde and formic acid are over-predicted.
73
Figure 33. Comparison of Model and Experimental Data from Held & Dryer86 at 1043 K, 2.1 atm, = 0.86 and X0(CH3OH) = 0.00344
74
Figure 34. Comparison of Model and Experimental Data from Held & Dryer86 at 1043 K, 2.1 atm, = 0.86 and X0(CH3OH) = 0.00344 Note: Time scales do not match, but model fits change in species concentration with bimodal shape.
75
Figure 35. Comparison of Model and Experimental Data from Held & Dryer86 at 949 K, 2.5 atm, = 0.83 and X0(CH3OH) = 0.00333
76
The higher pressure data are presented in Figures 36-38. Data presented in Figure 36 are performed at 10 atm, 810 K and a fuel equivalence ratio of 0.42. The overall formation and consumption of the major species reported are well characterized by the current model, capturing the changes in the formation and consumption of the major species. The model under predicts the formation of H2O and CO2 at longer time. Figure 37 illustrates the comparison between the modeling results to the experimental data at 15 atm, 783 K, and an initial methanol concentration of 0.00415 with a fuel equivalence ratio of 1.04. The model is able to capture and match the observed data. At longer times, the model under predicts the formation of H2O, but matches the CO2 and O2 observed data very well. The major difference between the experimental conditions shown in Figures 37 and 38 is the fuel equivalence ratio. Figure 37 shows the comparison between the model results to experimental data at 15 atm, 781 K and an initial methanol concentration of 0.00415 with a fuel equivalence ratio of 2.59. The modeling results agree well with the experimental data. The model matches the H2O formation, as well as the rapid changes in methanol, O2, CO and H2. At longer times, the model under predicts CO and O2 and over predicts H2.
77
Figure 36. Comparison of Model and Experimental Data from Held & Dryer86 at 810 K, 10.0 atm, = 0.42 and X0(CH3OH) = 0.00415
78
Figure 37. Comparison of Model and Experimental Data from Held & Dryer86 at 783 K, 15.0 atm, =1.04 and X0(CH3OH) = 0.00415
79
Figure 38. Comparison of Model and Experimental Data from Held & Dryer86 at 781 K, 15.0 atm, =2.59 and X0(CH3OH) = 0.00415
80
The comparisons of the “minor” products in this system, i.e. formaldehyde and formic acid, for the conditions performed by Held and Dryer did not match. The model is able to capture the trends in the formaldehyde formation, but improvement in modeling fit to formic acid is needed. Several reasons can attribute to the mismatch between the model and experimental data. Experimentally, quantification of formaldehyde and formic acid by experimental techniques are difficult. In our current model, the reaction pathways for these two species were not treated rigorously and further studies on these reactions pathways, such as through high level ab initio/DFT methods coupled with kinetic theory are suggested. Similarly to Held and Dryer, the uniqueness in the experimental data of Vandooren and van Tiggelen79 is the low pressure system where they performed their measurements. Vandooren and van Tiggelen performed their experiments at 40 Torr. We present model comparisons to two different flame data Vandooren and van Tiggelen measured: Flame I CH3OH = 19.9%, O2 = 33.7 and Ar = 46.4% with a fuel equivalence ratio of 0.89; Flame II CH3OH 19.4% and O2 = 80.6% with a fuel equivalence ratio of 0.36. Both flames exhibited a temperature gradient; the temperature range for Flame I ranged from less than 1500 K to over 2000 K and Flame II ranged from less than 1000 K to over 1850 K. The height of the flames measured was about 1.5 cm for both flame conditions. The input parameters for our modeling calculations come directly from the initial experimental conditions, with exception that our model assumed an isothermal system, this was helpful to achieve conversion. The isothermal temperature used in the model calculations for Flame I is 1500 K and for Flame II it is 1000 K. The modeling results for Flame I comparison are shown in Figure 39. The predicted results show a spatial displacement compared to the observed data. The distance corresponding to the observed data are shown on the bottom axis, and the distance corresponding to the predictions are shown on the top of Figure 39. The trends for the major products are well captured by the model predictions. The model slightly over predicts the formation of H2; the data presented for the experimental data is rescaled by a factor of 2 and the model prediction by 1.5. The shapes of the minor product profiles are also well characterized by the modeling results. The model over predicts the formation of CH2O by about 4 times, under predicts methyl radicals by factor of 2 and hydrogen atom is over predicted by about a factor of 4. Although the hydrogen atom is over predicted, at about 1.5 cm the concentration does match the observed data.
81
Figure 39. Comparison of Modeling Results to Vandooren and van Tigglen’s Flame I Data Set22 Note: Experimental T = 1500 – 2000 K; Modeling T = 1500K at 40 Torr. CH3OH = 19.9%, O2 = 33.7 and Ar = 46.4%; = 0.89.
82
The experimental data also indicates that the greatest change in concentration profiles (both major and minor) occurs within a short distance, from approximately 0 to 0.4 cm. The modeling results also show similar results occurring from 0.4 to 0.8 cm. One major difference between the observed and predicted results in this regime is the H2 and H2O mole fractions. The model predicts the H2 mole fraction to “dip” and rise back up before proceeding with its decay, while the H2O has a small sharp “peak” at around 0.5 cm. To help determine the cause of this “dip” in H2 and sharp “peak” in H2O, several additional model runs were performed. The additional runs were performed using the same input parameters except for changes in the pressure. At lower pressures, we do not observe an increase in the “dip”, although it is still present. As we increase pressure, both the “decrease” and “peak” in H2 and H2O, respectively, start to become less apparent. At 1 atm a small “decrease” and “peak” are still present, and above 1 atm this behavior is not observed. Comparison to Vandooren and van Tiggelen’s Flame II data are shown in Figure 40. The model is able to capture all the trends that are observed experimentally for both the stable and radical species. For the major species, the model does match the experimental results for CH3OH, H2O and O2. CO is slightly over predicted and CO2 has a longer induction time required compared to the observed data. For the minor species, formaldehyde and hydrogen atom are both over predicted compared to experimental data.
83
Figure 40. Comparison of Modeling Results to Vandooren and van Tigglen’s Flame II Data Set79 Note: Experimental T = 1000 – 1850 K; Modeling T = 1000K at 40 Torr. CH3OH 19.4% and O2 = 80.6%; = 0.36
84
Similar to the modeling results for Flame I, Flame II also shows a “dip” in the H2 mole fraction. The “dip” is more apparent and most likely due to Flame II being at a lower temperature, lower fuel equivalence ratio and without Ar buffer gas. The comparison of results with our experimental data, that of Held and Dryer’s, Aronowitz, et al.’s and Vandooren and van Tiggelen’s experimental data, although do not show exact matches for all the cases presented, isencouraging. The current mechanism was able to predict and match all the consumption and formation trends of the major species over a wide pressure difference of about three orders of magnitude. The results from the comparison with experimental data over large pressure differences provides positive reinforcement the validity of the current method adopted to represent both temperature and pressure dependent rate coefficients in a single detailed kinetic mechanism. Comparison of the mechanism predictions with experimental data from the reaction of ethyl radical with molecular oxygen are illustrated in Figures 41 through 43. Comparisons of the ethylene + HO2 product data of Kaiser108 versus temperature at one atmosphere pressure, and versus pressure at 298 K are illustrated in Figure 41 and 42 respectively. The agreement is excellent. Fig. 43 illustrates the agreement of the model HO2 radical production versus temperature in HO2 measurements in thermal reactor experiments at 0.06 atm of Clifford et. al.109. At low temperatures there is only a small quantity of HO2 product resulting from the small degree of chemical activation relative to stabilization. As the temperature is increased both the component from chemical activation and the component of HO2 from reaction (dissociation) of the ethyl–peroxy radical are contributing to the very significant rise in the hydroperoxy radical.
Percent C2H4 Yield
100 Temp(K) vs master %c2h4 Temp(K) vs MSC %C2H4 1000/T vs C2H4 % yield
10
1
0.1 1.5
2.0
2.5
3.0
3.5
4.0
1000/T(K)
Figure 41. C2H5 + O2 Reaction System - Comparison of Kaiser data108 at a Constant Molecular Density of 4.8 x 10¹⁸ molecule/cc with MEA and MSC Models Note: Circle = Kaiser; Black Line = Modified Strong Collision Model (MSC); Red Line = Master Equation Analysis (MEA)
85
10
298 K 385 K 473 K
% Ethylene yield
750 K 1 850 K
T = 298 K
0.1
1
10
100
1000
P (torr)
Figure 42. Comparison of % C2H4 Yield From Kaiser Data108 and NJIT Model Note: Red is for the MEA and Green is the MSC analysis method.
86
100 Clifford et al's "total" HO2 yield "total" HO2 yield MSC "total" HO2 yield ME
HO2 yield (%)
80
60
40
20
0 300
400
500
600
700
800
Temperature (K)
Figure 43. Comparison of Master Equation and Modified Strong Collision Model Predictions with Data for Total HO2 Formation Note: Filled circle = Clifford et al.'s data109; Dashed line with inverted triangles = ME ; Solid line with circles = MSC.
The updated rates for the CO-H2 system at a pressure of 0.066 atm have been tested against rapid compression machine ignition data110. Figure 44 shows results of these comparisons for three different pressures and various CO/H2 ratios. It can be seen that the new pressuredependent rates now allow the trend with increasing CO to be predicted correctly, while previously existing mechanisms87,111 do not fit the data.
87
3.0E-02 Experiment
PC = 15 bar
New P-dependent mech.
2.5E-02 Ignition Delay (s)
Wang 1999 GRI 3.0
2.0E-02 1.5E-02 1.0E-02 5.0E-03 0.0E+00 0
0.2
0.4
0.6
0.8
1
CO/H2 1.6E-02
4.0E-02 3.5E-02
Wang 1999
3.0E-02
PC = 50 bar
Experiment
1.4E-02
New P-dependent mech.
Ignition Delay (s)
Ignition Delay (s)
PC = 30 bar
Experiment
GRI 3.0
2.5E-02 2.0E-02 1.5E-02 1.0E-02
New P-dependent mech. Wang 1999
1.2E-02
GRI 3.0
1.0E-02 8.0E-03 6.0E-03 4.0E-03 2.0E-03
5.0E-03
0.0E+00
0.0E+00 0
0.2
0.4
0.6
0.8
1
CO/H2
0
0.2
0.4
0.6
0.8
1
CO/H2
Figure 44. Comparisons of Various Chemical Kinetic Mechanisms to Rapid Compression Machine Ignition Data110 at Various Pressures Note: The gas mixture is (by moles) 18.125% N2, 63.125% Ar, 6.25% O2, with the balance a mixture of H2 and CO in the ratio given on the horizontal axes.
Figure 45 compares n-heptane laminar flame speed calculated with the new mechanism against three experimental datasets112-114 for the n-heptane/air system. The pressure for all the experiments is1 atm. The fuel equivalence ratios range from 0.6 to 1.6. The agreement between the model and the experiments is excellent.
88
p
( _
)
45
40
Bozelli_Heptane Sung et al., (2004) Davis and LAw, 1998 Kwon et al., (2000)
35
Flame Speed in cm/s
30
25
20
15
10
5
0 0.6
0.8
1
1.2
1.4
1.6
Equivalence Ratio
Fig. 45. Comparison of NJIT Mechanism Predictions for Laminar Flame Speed Data for N-Heptane/Air Mixtures to Experiments112-114
89
1.8
Figure 46 compares model ignition delay predictions to the experiments at = 0.7 to 1.39 of Dean et al.115. The agreement is reasonable.
Figure 46. Comparison of Predicted and Experimental115 Values for Shock Tube Ignition Delay of N-Heptane
Figure 47 compares calculated ignition delay results of the NJIT mechanism to the published results of Ciezki & Adomeit116, and Minetti et al.117. Both sets of experiments are for stoichiometric mixtures of n-heptane and an oxidizer consisting of 20 molar percent oxygen and 80 molar percent nitrogen. 1.E+00
Ignition Delay (s)
1.E-01 New Mechanism, 3 bar
1.E-02
New Mechanism 13.6 bar New Mechanism, 40 bar Ciezki & Adomeit 3.2 bar
1.E-03
Ciezki & Adomeit 6.5 bar Ciezki & Adomeit 13.5 bar
1.E-04
Ciezki & Adomeit 19.3 bar Ciezki & Adomeit 30 bar Ciezki and Adomeit 42 bar
1.E-05
Minetti et al 2.7 bar Minetti et al 4.5 bar
1.E-06 0.6
0.8
1
1.2
1.4
1.6
1000/T (1/K)
Figure 47. Comparison of Calculated Ignition Delays Using the NJIT Mechanism to the Experimental Results of Ciezki & Adomeit116, and Minetti et al.117
90
Figure 48 compares ignition delays for n-decane calculated with the current NJIT mechanism with experimental results from Pfahl & Adomeit118 ( = 1, oxidizer = 80% N2, 20% O2) and Hornung et al.119 ( = 1, mixture is 0.2% n-decane, 3.1% O2, remainder Ar). The agreement is good for both data sets. 1.E-03
1.E-01 P0 = 1.24 atm.
Hornung NJIT Mechanism
1.E-04 0.64
Ignition Delay (s)
Ignition Delay (s)
P0 = 13 atm. 1.E-02 1.E-03 Pfahl & Adomeit
1.E-04
NJIT Mechanism
1.E-05 0.66
0.68
0.7
0.72
0.74
1000/T (1/K)
0.7 0.8 0.9
1
1.1 1.2 1.3 1.4 1.5
1000/T (1/K)
Figure 48. Comparison of the NJIT N-Decane/TMB Mechanism to the N-Decane Ignition Delay Measurements of Pfahl & Adomeit118 and Hornung et al.119
The only published ignition delay results for TMB of which we are aware are those of Roubaud et al.120 Frustratingly, the paper does not include sufficient information about the initial compositions to allow the data to be modeled. Attempts to contact the authors of the paper for further details have been unsuccessful. The detailed mechanism contains submechanisms for m- and o-xylene, which are breakdown products of TMB. Figures 49 and 50 compare the ignition delay times measured by BattinLeclerc et al.121 to those of the most recent detailed mechanism from NJIT for o- and m-xylene. In both cases the mechanism is predicting ignition delay that is much too slow.
91
1.E-02
Ignition Delay (s)
o-xylene = 1, P 0 = 8 atm. 1.E-03
1.E-04
1.E-05
Experiment NJIT mech
1.E-06 0.55
0.6
0.65
0.7
0.75
1000/T (1/K)
Figure 49. Comparison of the NJIT N-Decane/TMB Mechanism to the O-Xylene Ignition Delay Measurements of Battin-Leclerc et al.121 1.E-02
Ignition Delay (s)
m-xylene = 1.0, P 0 = 8 atm.
1.E-03
1.E-04 Experiment NJIT mech. 1.E-05 0.55
0.60
0.65
0.70
0.75
1000/T (1/K)
Figure 50. Comparison of the NJIT N-Decane/TMB Mechanism to the M-Xylene Ignition Delay Measurements of Battin-Leclerc et al.121
Comparisons of calculated ignition delays for m- and o-xylene to the measurements of BattinLeclerc et al. for = 0.5 and = 2.0 show similar results. Figures 51 and 52 compare ignition delay data for “kerosene”122,123 and Jet-A124 to predictions using the detailed Violi et al.1 mechanism (216 species), a skeletal mechanism based on it (71 species), and the NJIT mechanism created during this project using pure n-decane as the fuel. 92
The Violi mechanism calculations were made using a JP-8 surrogate125 composed of 88% ndodecane and 12% m-xylene by moles. Both the Violi and NJIT mechanisms incorrectly predict a negative coefficient of temperature at 22 atm for T < 1000 K. Otherwise the Violi detailed and skeletal mechanisms give reasonable agreement to the available ignition delay data. Although the NJIT mechanism performed well compared to n-decane ignition data, it predicts ignition times that are about a factor of two high compared to the kerosene/Jet-A data. The expectation was that n-decane would ignite faster than jet fuel, and that a methyl-substituted aromatic such as TMB or a xylene could be used as a slow igniting component to create a two-component mixture, as was done to formulate the two-species surrogate for the Violi mechanism. This result and the lack of agreement to the xylene ignition data shown in Figures 49 and 50 suggest that additional development is needed on the aromatic part of NJIT mechanism before it becomes the basis of engineering tools.
Ignition Delay (s)
1
0.1 Freeman & Lefebvre (1984) Mullins (1955) Violi detailed Violi skeletal
P 0=1 atm, =0.5
0.01 0.97
0.99
NJIT n-decane
1.01
1.03
1.05
1.07
1000/T (K-1) Figure 51. Comparison of Detailed and Skeletal Mechanisms to Ignition Delay Measurements122,123
93
Ignition Delay (s)
1.E-02
1.E-03
1.E-04 Vasu et al. 2007 Jet-A Violi detailed Violi skeletal NJIT n-decane
P 0=22 atm, =1
1.E-05 0.8
0.9
1
1.1
1.2
-1
1000/T(K ) Figure 52. Comparison of Detailed and Skeletal Mechanisms to Ignition Delay Measurements124
4.2 Opposed Flow Extinction Experiments
The following subsections report extinction strain rates for the test conditions listed in Table 10. In all cases, global extinction strain rate is plotted as a function of pressure. All results show an upward trend, with approximately linear dependence of extinction strain rate on pressure. The upward trend in extinction strain rate with pressure reflects the influence of the increased molecular collision rate on the overall reaction rate in the flame. Error analysis has been performed for many of the liquid fuel conditions. For conditions D1, B1, B2, J1, and T2, the measurement uncertainty in the extinction strain rate is below 4.5% for all conditions. This uncertainty includes contributions from uncertainties in flowmeter, pressure gauge, and thermocouple readings as well as uncertainties in the measurements of tube diameter and gap size. Error due to differences in how individual experimenters approach the extinction condition is not included in this analysis, but appears to contribute an uncertainty of approximately 30 torr to the pressure at which extinction is observed. 4.2.1 Methane and Ethylene Figure 53 shows extinction strain rates for methane vs. air, as a function of pressure. The two data sets in the figure were taken with different temperature control schemes. For the circles, neither the fuel stream nor the air stream had temperature control. For the squares, the air stream temperature was not controlled, but the fuel stream temperature was maintained at 100 ºC by electrical heating. As seen in the figure, the fuel side heating has minimal impact on extinction conditions. This finding is expected because the stoichiometric mass fraction for methane/air flames has a very low value: 0.055. This value means that, at the approximate flame location (i.e. at the stoichiometric contour), only 5.5% of the material originated in the fuel stream (on a
94
mass basis). Thus the impact on the kinetics of this increase in the thermal enthalpy of the fuel stream is negligible.
Figure 53. Extinction Strain Rates for Methane vs. Air as a Function of Pressure: Effect of Heating the Fuel Stream Note: Conditions M1 and M3.
Figure 54 compares extinction strain rates for methane and ethylene vs. air. The methane data set in this figure is repeated from Figure 53, and neither data set has temperature control of either reactant stream. The extinction strain rates of ethylene are consistently higher than those of methane, by factors of two to three. Figure 55 shows methane and ethylene extinction data for a different oxidant: a 50/50 molar mixture of O2 and N2, The burner geometry and temperature control are also different from Fig. 54 (configuration C vs. A; Table 7). Qualitatively, the plot is similar to the previous one. Results cannot be compared directly because of the differences in the burner geometry, but the higher values of extinction strain rate seen in Figure 55 are reasonable because the oxidant choice in data sets M2 and E2 leads to significantly higher adiabatic flame temperatures than in data sets M1 and E1.
95
Figure 54. Extinction Strain Rates for Ethylene (red circles) and Methane (blue squares) as Functions of Pressure. Note: Conditions E1 and M1.
Figure 55. Extinction Strain Rates for Ethylene and Methane as Functions of Pressure. Filled and Open Symbols Represent Data Sets Acquired on Different Days Note: Conditions E2 and M2.
96
4.2.1.1 N-heptane in Methane and in Nitrogen
N-heptane flame extinction measurements were performed with two different carrier gases: CH4 and N2. The two sets of results are presented in Figure 56, but a direct comparison is not meaningful because of different burner geometry (configuration B vs. A’).
Figure 56. Extinction Strain Rates for N-Heptane in N2 vs Enriched Air (red circles), and N-Heptane in Methane vs. Air (blue squares), as Functions of Pressure Note: Conditions H2 and H1- burner geometry and temperature control differ for these data sets.
To investigate the effect on extinction strain rate of adding n-heptane to methane, aq data for heated methane and heated n-heptane-methane can be compared. See Figure 57, in which both data sets are repeated from previous figures.
Figure 57. Extinction Strain Rates for N-Heptane in Methane vs. Air (blue squares) Compared to Pure Methane vs. Air (red circles), as Functions of Pressure Note: Conditions H1 and M3.
97
4.2.1.1 Heavier Liquid Fuels in Nitrogen
Experiments with heavier liquid fuels in nitrogen were designed to allow a meaningful comparison among the fuels. With nearly matched adiabatic flame temperature and stoichiometric mixture fraction for these fuels, differences in extinction strain rate represent differences in overall reaction rate at a given temperature. The liquid fuels examined under these conditions are: decane, trimethyl benzene (TMB), two different blends of decane and TMB, and Jet A, under conditions D1, T1, B1, B2, and J1. Decane and TMB extinction strain rates as functions of pressure are compared in Figure 58, which shows that global extinction strain rates for TMB are roughly half of those for decane. In addition, aq,global for TMB is a weak function of pressure compared to the pressure dependency for decane. Note among all the fuels reported on here, TMB produced by far the sootiest flames. Soot generated in the TMB flames quickly coated the exhaust system, affecting the flowrate to the vacuum pump, and thus the chamber pressure. These changes in chamber pressure made it necessary to speed up the approach to extinction, making the TMB extinction data less reliable than other data sets. The extinction of the highly luminous, sooty, TMB flames may also have been influenced by radiative heat loss. Extinction strain rates for Jet-A are shown in Figure 59. A comparison of Figures 58 and 59 shows that the aq,global versus pressure behavior of Jet A falls between that of decane and TMB, suggesting that Jet A extinction behavior can be matched by a surrogate composed of these two fuels.
Figure 58. Extinction Strain Rates for Decane (red circles) and TMB (blue squares) as Functions of Pressure Note: The fuels are diluted in nitrogen to mass fraction 0.22, while the oxidizer is a 50/50 (molar) mixture of O2 and N2. Filled and open symbols represent data sets acquired on different days. Conditions D1 and T2.
98
Figure 59. Extinction Strain Rates for Jet-A as a Function of Pressure Note: The fuel is diluted in nitrogen to mass fraction 0.22, while the oxidizer is a 50/50 (molar) mixture of O2 and N2. Filled and open symbols represent data sets acquired on different days. Condition J1.
Extinction strain rates for two blends of decane and TMB (60/40 and 80/20 by liquid volume) are compared to Jet A extinction strain rates in Figures 60 and 61. While both blends have extinction behaviors very similar to those of Jet A, the 60/40 blend behavior more closely simulates that of Jet A than the 80/20 blend does. In addition, the extinction behavior of both blends is much closer to that of decane than to that of TMB.
Figure 60. Extinction Strain Rates for Jet-A (red circles) and a 60/40 (by liquid volume) Blend of Decane and Trimethyl Benzene (blue squares), as Functions of Pressure Note: The fuels are diluted in nitrogen to mass fraction 0.22, while the oxidizer is a 50/50 (molar) mixture of O2 and N2. Filled and open symbols represent data sets acquired on different days. Conditions J1 and B2.
99
Figure 61. Extinction Strain Rates for Jet-A and a 80/20 (by liquid volume) Blend of Decane and TMB, as Functions of Pressure Note: The fuels are diluted in nitrogen to mass fraction 0.22, while the oxidizer is a 50/50 (molar) mixture of O2 and N2. Filled and open symbols represent data sets acquired on different days. Conditions J1 and B1.
4.2.2 Temperature Profile Figure 62 shows temperatures measured in a flame consisting of ethylene in nitrogen vs. air (Condition E3). Temperature data is sparse because thermocouples did not survive long in the flame. Lower-temperature flames would have allowed longer thermocouple life and thus more abundant data, but those flames tended to fluctuate significantly in the axial direction, or to be extinguished when the thermocouple was introduced. The flame conditions selected were stable, but the thermocouple was destroyed quickly. Despite several attempts with different thermocouples, only one temperature profile was obtained.
Figure 62 shows the experimental data processed in three different ways. The open circles are the raw temperature readings obtained from the thermocouple voltage, and thus represent the temperature of the thermocouple junction itself. The two filled symbols adjust the junction temperature for radiative heat transfer to obtain the gas temperature. The two different corrected temperatures use different correlations for the emissivity of platinum58,59. As can be seen in the figure, radiative heat loss becomes significant only for the hottest measured temperature, and adjusts the temperature by about 130 °C under those conditions. The measured temperatures are plotted along with the results of an OPPDIF126 simulation of the flame using the chemical kinetic mechanism of Wang et al.127. The measured and calculated profiles show good agreement between for the width and height of the temperature peak, to the extent that these quantities can be deduced from the sparse experimental data set. The position of the peak in the experimental data is shifted significantly (roughly 0.2 cm) towards the oxidizer nozzle, relative to the predictions.
100
Figure 62 Near-Centerline Temperature Profile Measured in a Flame Consisting of Ethylene in Nitrogen vs. Air Note: Condition E3. Open circles are raw thermocouple readings; filled red squares58 and blue triangles59 are corrected for radiation losses using two different correlations for the emissivity of platinum. The line results from an OPPDIF126 calculation using the USC kinetic mechanism127.
4.3 Modeling of Counterflow Extinction Experiments
The counterflow extinction experiments were modeled using the OPPDIF code126. This code uses a change of variables to transform the axisymmetric problem with assumed flat velocity profiles for the fuel and oxidizer to a one-dimensional problem solved along the centerline of the fuel and oxidizer streams. Thus, only a single velocity can be specified for each stream. No allowance can be made for nonuniform velocity profiles in the fuel and oxidizer jets. The extinction strain rate is calculated using a binary search algorithm. The algorithm is based on the observation that for low strain rates OPPDIF will converge to a burning solution characterized by consumption of fuel and oxidizer with associated heat release and high temperatures. For higher strain rates OPPDIF will converge to a nonburning, mixing-only solution. The dividing point between these two types of solutions is taken as the extinction strain rate. The algorithm begins by finding a converged burning solution for a low strain rate. The strain rate is then increased, keeping the fuel/oxidizer velocity ratio fixed, until a nonburning solution is reached. From that point, a binary search algorithm is used to successively narrow the difference between the highest strain burning case and the lowest strain nonburning case. Each calculation is restarted from the highest strain burning solution found to that point. The reported extinction strain rate is the average of the strain rates for the burning and nonburning solutions closest to the extinction point. The algorithm continues until the strain rate difference between the burning and nonburning cases reaches a tolerance, generally a relative difference of 0.1%. The figures in this section compare calculations to the experimental measurements described previously. Not all fuels and conditions could be modeled. This type of calculation, especially for heavier fuels and near extinction is prone to stiffness. Here we present the best available results from a variety of chemical kinetic mechanisms. Figure 63 compares calculated and measured extinction strain rates for methane (data set M2). The mechanisms used to model this set of experiments were GRI 3.087, and the detailed and 101
skeletal (35 species) versions of the Wang et al. mechanism127. For the lowest pressure (0.1 atm) a solution could only be obtained for the Wang skeletal mechanism, which did not agree well at this low pressure. For 0.17 atm < P < 0.3 atm, GRI 3.0 gives reasonable agreement. The Wang skeletal and detailed mechanisms give reasonable agreement for P = 0.25-0.3 atm, but predict extinction strain rates that are too low for lower pressures.
4000
-1
Extinction Strain Rate (s )
4500
3500 3000 2500 2000 Experiment
1500
GRI 3.0
1000
Wang Skeletal
500 0 0.05
Wang Detailed
0.10
0.15
0.20
0.25
0.30
0.35
Pressure (atm)
Figure 63. Comparison of Models87,127 and Experiments for the Methane Opposed Flow Flames
Figure 64 compares calculated and measured extinction strain rates for ethylene (data set E2). The mechanisms used to model this set of experiments were the detailed and skeletal (35 species) versions of the Wang mechanism127 and the NJIT mechanism. The detailed and skeletal Wang mechanisms give reasonable agreement to the data, if not perfect agreement with each other. The NJIT mechanism consistently predicts extinction strain rates that are about 30% low.
Extinction Strain Rate (s-1)
6000 5000 4000 3000 Experiment
2000
NJIT Wang Skeletal
1000
Wang Detailed
0 0.08
0.1
0.12
0.14
0.16
0.18
0.2
0.22
Pressure (atm)
Figure 64. Comparison of Models87,127 and Experiments for the Ethylene Opposed Flow Flames
102
Figure 65 compares calculated and measured extinction strain rates for ethylene (data set H2). The mechanisms used to model this set of experiments were the Lawrence Livermore National Laboratories (LLNL) reduced mechanism128 (which is a shortened version of the full LLNL nheptane mechanism containing 161 species and 1540 reactions) and the NJIT mechanism. The LLNL mechanism comes close to the experimental data for the lowest pressures (~ 0.3 atm) but deviates increasingly as the pressure increases. The NJIT mechanism is consistently low by about a factor of two. This again demonstrates that opposed flow extinction is a more difficult target to model for several reasons. First, it is much more difficult to obtain sensitivity data on extinction strain rate than on ignition delay because ignition delay is a shorter and simpler calculation. Second, the reactions that govern the rates of ignition and extinction are not all the same. The NJIT mechanism has not been tuned to match ignition delay data, but ignition delay data has been primarily used to determine under what conditions reaction rates needed to be refined or reactions added.
Extinction Strain Rate (1/s)
4000 Experiment
3500
NJIT
3000
LLNL reduced
2500 2000 1500 1000 500 0 0.2
0.3
0.4
0.5
0.6
Pressure (atm) Figure 65. Comparison of Models and Experiments for the N-Heptane Opposed Flow Flames
Figure 66 compares calculated and measured extinction strain rates for n-decane (data set D1). The only mechanism for which we were able to calculate extinction strain rates was the Zhang3,4 mechanism. Solutions were only obtained for P = 0.5 and P = 0.6 atm. The predictions of the Zhang mechanism are over a factor of two too high.
103
Extinction Strain Rate (s-1)
3500 3000 2500 2000 1500 1000 Experiment
500
Zhang
0 0.3
0.4
0.5 Pressure (atm)
0.6
0.7
Figure 66. Comparison of Models3,4 and Experiments for the N-Decane Opposed Flow Flames
Figure 67 compares calculated and measured extinction strain rates for Jet-A (data set J1). Again, the only mechanism for which we were able to calculate extinction strain rates was the Zhang mechanism. These calculations used the surrogate blend recommended by Zhang, which contained (by moles) 20% n-dodecane, 40% iso-octane, 27% cyclohexane, 12% toluene and 1% benzene. Solutions were only obtained for P = 0.5 and P = 0.6 atm. The extinction strain rate. predictions of the Zhang mechanism are over a factor of two too high.
Extinction Strain Rate (s-1)
1600 1400 1200 1000 800 600 400
Experiment
200
Zhang
0 0.45
0.5
0.55
0.6
0.65
Pressure (atm) Figure 67. Comparison of Models and Experiments for the Jet-A Opposed Flow Flames
Clearly, considerable work remains to develop chemical kinetic and reacting flow models that are able to accurately reproduce the data sets generated during this project.
104
4.4 Mechanism Reduction
This section compares skeletal and reduced mechanisms created during this project to the detailed mechanisms on which they were based. Ignition delay calculations, species and temperature time histories from autoignition calculations, and in a few cases, opposed-flow diffusion flame calculations are used to compare detailed, skeletal and reduced chemistry. Reduced mechanisms were created based on the NJIT mechanism developed during this project as well as the mechanisms of Wang127 and of Violi et al.1. Table 12 summarizes the skeletal and reduced mechanisms created during this project. Table 12. Skeletal and Reduced Mechanisms Created During This Project Detailed Mechanism
Fuel
Detailed Species
Detailed Reactions
Skeletal Species
Skeletal Reactions
Reduced Species
Wang et al.127
ethylene
111
784
29
144
19, 21
Violi et al.1
JP-8 surrogate
216
4828
66
360
30
NJIT (this project)
n-decane
577
2043
75
392
25, 40
Figure 68 compares calculated ignition delay times for detailed, skeletal, and reduced mechanisms for ethylene combustion over a range of temperatures, pressures, and equivalence ratios. Despite some deviation at very rich conditions and higher pressures (~10 atm) than those expected for scramjet operation, overall, the agreement is very good for both the 19- and 21species reduced mechanisms. Figure 69 compared temperature and major species time histories for constant-volume ethyleneair autoignition with initial conditions P = 1 atm, T = 1000 K, and = 1.0 as calculated using detailed, skeletal, and reduced mechanisms. Except for a slight difference in ignition delay, the skeletal and reduced mechanisms maintain the behavior of the detailed model quite well. Time histories for other species (not shown) show a similar degree of agreement.
105
1.E+00
= 1, P = 1 atm.
Ignition Delay (s)
1.E-01
1.E-02
1.E-03 Detailed (111 species) Skeletal (29 species) Reduced (21 species) Reduced (19 species)
1.E-04
1.E-05 0.6
0.8
1
1.E-01
Ignition Delay (s)
Detailed (111 species) Skeletal (29 species) Reduced (21 species) Reduced (19 species) Ignition Delay
1.2
1000/T (1/K) 1.E-01
1.E-02
Detailed (111 Species) Skeletal (29 species) Reduced (21 species) Reduced (19 species)
1.E-02
T 0 = 1000 K, = 1.0
T 0 = 1000 K, P 0 = 1 atm. 1.E-03
1.E-03 0.1
1
10
0.1
Equivalence Ratio
1
10
Initial Pressure (atm)
Figure 68. Comparison of Calculated Ignition Delay for Ethylene/Air Mixtures for Detailed127, Skeletal and Reduced Mechanisms
106
=1, T0=1000 K, P0=1 atm.
7.E-02
2000 Detailed (111 species) Skeletal (29 species)
1500
Reduced (21 species) Reduced (19 species)
1000 0.0E+00
5.E-02 4.E-02 3.E-02 2.E-02 1.E-02
1.0E-02
2.0E-02
Detailed (111 species) Reduced (21 species) Reduced (19 species) Skeletal (29 species)
0.E+00 0.0E+00
3.0E-02
Time (s) 7.E-02
1, T0=1000 K, P0=1 atm.
6.E-02
2500 C2H4 mole fraction
Temperature (K)
3000
=1, T0=1000 K, P0=1 atm.
1.0E-02 2.0E-02 Time (s)
2.5E-02
3.0E-02
=1, T0=1000 K, P0=1 atm.
2.0E-02 5.E-02
OH mole fraction
CO mole fraction
6.E-02
4.E-02 3.E-02 2.E-02 1.E-02
Detailed (111 species) Skeletal (29 species) Reduced (21 species) Reduced (19 species)
1.5E-02 1.0E-02 Detailed (111 species)
5.0E-03
Reduced (21 species) Reduced (19 species) Skeletal (29 species)
0.E+00 0.0E+00
1.0E-02
2.0E-02
3.0E-02
Time (s)
0.0E+00 0.0E+00
1.0E-02
2.0E-02
3.0E-02
Time (s)
Figure 69. Comparison Calculated Species and Temperature Time Histories for Ethylene/Air ConstantVolume Autoignition Using the Most Recent Detailed127, Skeletal and Reduced Mechanisms
Figure 70 compares detailed and skeletal versions of the Violi et al. mechanism to experimental measurements of kerosene122,123 or Jet-A124 and air. Both sets of calculations were made using a two-species fuel surrogate125 containing (by moles) 88% n-dodecane and 12% m-xylene. Both the detailed and skeletal mechanisms give reasonable agreement to the data except at temperatures below about 900 K. This detailed mechanism appears to be the best available on which to base a JP-8 reduced mechanism.
107
1
1.E-02
Freeman & Lefebvre
P 0 = 22 atm.
Mullins Detailed (216 species) Ignition Delay (s)
Ignition Delay (s)
Skeletal (66 species)
0.1
1.E-03
1.E-04
Vasu et al. 2007 Jet-A Detailed (216 species) Skeletal (66 species)
0.01 0.96
1.E-05
0.98
1
1.02
1.04
1.06
1.08
1.1
0.8
0.85
0.9
0.95
1
1.05
1.1
1.15
1.2
1000/T(1/K)
1000/T (1/K)
Figure 70. Comparison of Detailed1 and Skeletal Mechanisms to Experiments for Kerosene122,123 and Jet-A124 Fuels
Figure 71 compares calculated ignition delay times for detailed1, skeletal, and reduced mechanisms for JP-8 surrogate combustion over a range of temperatures, pressures, and equivalence ratios. Overall, the agreement is excellent for both the skeletal and reduced mechanisms. 1.E+00
P0=1 (atm), =1
Ignition Delay (s)
1.E-01 1.E-02 1.E-03 Detailed (216 species) Skeletal (66 species)
1.E-04
Reduced (30 species) 1.E-05 0.7 1.E-02
0.8
0.9 1 -1 1000/T (K )
T0=1100 (K), P0=1 (atm)
1.1
1.2
=1, T0 = 1100 (K)
1.E-01
Ignition Delay (s)
Ignition Delay (s)
9.E-03 8.E-03 7.E-03 6.E-03 Detailed (216 species)
5.E-03
1.E-02
Detailed (216 species)
1.E-03
Skeletal (66 species)
Skeletal (66 species)
Reduced (30 species)
Reduced (30 species) 4.E-03
1.E-04 0.1
1 Equivalence Ratio
10
0.1
1 P0 (atm)
Figure 71. Comparison of Calculated Ignition Delay for JP-8/Air Mixtures for Detailed1, Skeletal and Reduced Mechanisms
108
10
Figure 72 compared temperature and major species time histories for constant-volume JP-8-air autoignition with initial conditions P = 1 atm, T = 1100 K, and = 1.0 as calculated using detailed, skeletal, and reduced mechanisms. Again the agreement is uniformly excellent. Time histories for other species (not shown) show a similar level of agreement.
1.2E-02
2500
Detailed (216 species) Skeletal (66 species) Reduced (30 species)
2000 =1, T0=1100 K, P0=1 atm.
1500
1000 0.0E+00
4.0E-03
8.0E-03
n-dodecane mole fraction
Temperature (K)
3000
8.0E-03 6.0E-03 4.0E-03
Time (s)
1.0E-03
0.0E+00 0.0E+00
Detailed (216 species) Skeletal (66 species) Reduced (30 species)
4.0E-03
8.0E-03
Time (s)
1.2E-02
CO2 mole fraction
m-xylene mole fraction
8.E-02 =1, T0=1100 K, P0=1 atm.
5.0E-04
4.0E-03
8.0E-03
1.2E-02
Time (s)
2.0E-03
1.5E-03
Detailed (216 species) Skeletal (66 species) Reduced (30 species)
2.0E-03 0.0E+00 0.0E+00
1.2E-02
=1, T0=1100 K, P0=1 atm.
1.0E-02
=1, T0=1100 K, P0=1 atm.
6.E-02
4.E-02
Detailed (216 species) Skeletal (66 species) Reduced (30 species)
2.E-02
0.E+00 0.0E+00
4.0E-03
8.0E-03
1.2E-02
Time (s)
Figure 72. Comparison of Calculated Species and Temperature Time Histories for JP-8/Air ConstantVolume Autoignition Using Detailed1, Skeletal and Reduced Mechanisms
109
Figure 73 compares calculated ignition delay times for detailed, skeletal, and reduced mechanisms based on the NJIT mechanism created during this project, for n-decane combustion over a range of temperatures, pressures, and equivalence ratios. The skeletal and reduced mechanisms are based on an earlier version of the NJI n-decane-TMB mechanism. Overall, the agreement is good for both the skeletal and reduced mechanisms.
Ignition Delay (s)
1.E+00
= 1, P 0 = 1 atm.
1.E-01 1.E-02
Detailed (448 species) Skeletal (75 species)
1.E-03
Reduced 40 Reduced 30
1.E-04
Reduced 25
1.E-05 0.6
0.7
0.8 0.9 -1 1000/T (K )
1
2.E-02
1.E-01
1.2
Detailed (448 species)
= 1, T 0 = 1100 K
Skeletal (75 species) Reduced 40
1.E-02 Detailed (448 species) Skeletal (75 species) Reduced 40
Ignition Delay (s)
Ignition Delay (s)
1.1
Reduced 25
1.E-02
Reduced 30 Reduced 25
1.E-03 1.E-01
T 0 = 1100 K, P 0 = 1 atm.
1.E+00
1.E+01
0.E+00
P 0 (atm.)
0.1
1 Equivalence Ratio ( )
10
Figure 73. Comparison Calculated Species and Temperature Time Histories for Ethylene/Air ConstantVolume Autoignition Using Detailed, Skeletal and Reduced Mechanisms Based on the NJIT Mechanism Developed During this Project
110
Figure 74 compares detailed127, skeletal (31 species) and various reduced mechanisms’ flame structure predictions for a strained counterflow diffusion flame. Overall the agreement is reasonable. 9.0E-02
1900 1800 1700
8.0E-02
Skeletal
Skeletal
1600
Red 28
Red 28
1500
7.0E-02
Red 22
Red 22
1400
CO Mole Fraction
Red 18
1300 T (K)
Detailed
Detailed
1200 1100 1000 900 800 700
Red 18
6.0E-02 5.0E-02 4.0E-02 3.0E-02 2.0E-02
600 500
1.0E-02
400 300
0.0E+00 0
0.1
0.2
0.3
0.4
0.5
0.6
0.7
0.8
0.9
0
0.1
0.2
0.3
x (cm)
0.5
0.6
0.7
0.8
0.9
0.6
0.7
0.8
0.9
x (cm)
6.0E-02
2.5E-01
Detailed
Detailed
Skeletal
Skeletal
5.0E-02
2.0E-01
Red 28
Red 28 Red 22
Red 22
4.0E-02
O2 Mole Fraction
CO2 Mole Fraction
0.4
Red 18
3.0E-02
2.0E-02
Red 18 1.5E-01
1.0E-01
5.0E-02
1.0E-02
0.0E+00
0.0E+00 0
0.1
0.2
0.3
0.4
0.5
0.6
0.7
0.8
0
0.9
0.1
0.2
0.3
9.E-01
0.5
6.0E-03 Detailed
Detailed
8.E-01
Skeletal 7.E-01
Skeletal
5.0E-03
Red 28
Red 28
Red 22
Red 22 6.E-01
OH Mole Fraction
C2H4 Mole Fraction
0.4
x (cm)
x (cm)
Red 18
5.E-01 4.E-01 3.E-01
4.0E-03
Red 18
3.0E-03
2.0E-03
2.E-01 1.0E-03
1.E-01 0.0E+00
0.E+00 0
0.1
0.2
0.3
0.4
0.5
0.6
0.7
0.8
0.9
0
0.1
0.2
0.3
0.4
0.5
0.6
0.7
0.8
x (cm)
x (cm)
Figure 74. Predicted Flame Structures for a Counterflow Diffusion Flame for Detailed127, Skeletal, and Reduced Chemistry Note: Fuel: 80% C2H4, 20% CH4, P = 1 atm, Tfu = Tox = 373 K, Vfu/Vox =1.0605, fu/ox = 0.8891, gap width = 0.87 cm.
111
0.9
4.5 ChemistryTabulation (ISAT) The small CFD test case is a modified version of the axisymmetric supersonic diffusion flame of Evans et al.129 with ethylene instead of hydrogen as the fuel. A diagram of the configuration is shown in Figure 75. Conditions are summarized in Table 13. The inlet temperatures are increased due to the fact that ethylene has a longer ignition delay than hydrogen. The model uses a 2D axis-symmetric domain with 60×35 cells. Chemical reaction is modeled using a QSS reduced mechanism for ethylene combustion with 21 species125. Turbulence-chemistry interaction is neglected.
C2H4
Figure 75. Diagram of Supersonic Diffusion Flame Experiment of Evans et al.129 with Increased Inlet Temperatures and Ethylene Fuel Table 13. Conditions for Reacting Flow Simulation Specified condition
Fuel jet
Outer jet
Mach number
---
1.9
Temperature (K)
---
1495
Pressure, p (bar)
---
1.0
Temperature (K)
452
---
8.6068
---
Total pressure (bar) O2 mass frac.
0.0
0.241
N2 mass frac.
0.0
0.478
H2O mass frac.
0.0
0.281
Fuel mass frac.
1.0
0.0
Figure 76 shows the grid and its block divisions. The grid is divided into ten blocks; for a reacting flow calculation, only blocks 9 and 10 are active. Due to the positioning of the flame, more reaction occurs in block 10. For the comparisons shown here we have run the case using two processors. For the Local ISAT strategy two unconnected ISAT tables are associated with each of the two active blocks. In URan, the two tables are connected. When using the URan ISAT strategy grid nodes in block 9 and 10 are randomly assigned to two ISAT sub-tables (or trees) residing on the two processors.
112
Static Temperature (K)
Block 9 (35x31)
Block 10 (35x31)
Figure 76. Temperature Plot and Block Divisions for the 2D Supersonic Flame Test Case
Table 14 compares timing results for a single processor run, and the URan and Local parallelization strategies. The overall wall clock times of Local and URan cases are about the same because of the relatively large MPI overhead in the URan strategy. The performance of URan is expected to improve as the chemistry calculation becomes more expensive (e.g., tighter error tolerance, larger and more complex reduced mechanism). Excellent load balance has been achieved between the two ISAT tables in the URan case, whereas the load balance in the Local case is poor. Table 15 shows results for the case with the tightened ISAT tolerance. Excellent load balance has been achieved between the two ISAT tables in the URan case, whereas the load balance in the Local case is poor. For this case the URan strategy is 33% faster than Local (43 vs. 64 s). The overall wall clock times of URan is 17% shorter than that of Local. This suggests that the URan strategy could be beneficial for more complex and difficult problems. Table 14. Comparison of Single Processor and URan and Local Parallelization Strategies Using an ISAT Tolerance of 1.E-3
Case
Processor
CPU time in ISAT (min)
Single Processor
0
24
33887
LOCAL, Two Processors
0
4
927
1
19
38438
0
11
22834
1
11
22995
URAN, Two processors
113
ISAT table size (entries)
ISAT MPI overhead (min)
Total wall clock time (min)
0
72
0
42
8
42
Table 15. Comparison URan and Local Parallelization Strategies Using an ISAT Tolerance of 5.E-5
Case
Processor
CPU time in ISAT (min)
LOCAL, Two Processors
0
12
20587
1
64
241631
0
43
168919
1
42
168281
URAN, Two processors
ISAT table size (entries)
ISAT MPI overhead (min)
Total wall clock time (min)
0
90
8
75
The URan and Local versions of ISAT have been compared using 25- and a 30-species ethylene reduced mechanisms. ISAT tolerances are also varied, using values of 1e-3 and 5e-4 for the 2D supersonic jet flame test case described earlier with the VULCAN CFD code. The cases are again run on two processors and the loads on each processor are compared. Table 16 shows the CPU time used by each processor and the ratio between the two for the 25-species mechanism. Table 17 shows the same for the 30-species mechanism. For both mechanisms and both tolerances used it can be seen that the URan version of ISAT offers better load balancing. Table 16. CPU Loads for the 25-Species Mechanism Ratio Tolerance CPU 0 CPU 1 (CPU 1/CPU 0) 1.00E-03 9.37E+02 1.90E+03 2.03E+00 5.00E-04 1.14E+03 2.34E+03 2.05E+00 1.00E-03 1.75E+03 1.74E+03 9.95E-01 5.00E-04 2.13E+03 2.17E+03 1.02E+00
Version Local URan
Table 17. CPU Loads for the 30-Species Mechanism Tolerance 1.00E-03 5.00E-04 1.00E-03 5.00E-04
CPU 0 1.11E+03 1.33E+03 2.22E+03 2.87E+03
CPU 1 2.48E+03 3.23E+03 2.25E+03 2.90E+03
Ratio (CPU 1/CPU 0) 2.24E+00 2.43E+00 1.02E+00 1.01E+00
Version Local URan
The speedup, defined as the ratio of CPU time with ISAT to CPU time for direct source term evaluation, of URan ISAT is also improved over the Local version. Figure 77 shows a plot of the speedup versus the number of table queries for all cases using the 25-species mechanism. Figure 78 shows these plots for the 30-species mechanism. It can clearly be seen that the URan ISAT shows superior speedup over Local ISAT for both tolerances tested. The initially very high speedup is due to the relatively small amount of reaction occurring in the early iterations. As the flame evolves, a larger number of thermochemical states develop within the domain, resulting in a lower retrieval rate. As the table fills with states close to those of the converged solution toward the end of the simulation, the speedup improves. Figure 79 shows a comparison of the speedup of URan ISAT runs with 1e-3 tolerances for both the 25and 30-species mechanisms. This figure shows that after a certain number of queries the speedup for the
114
30-species mechanism begins to exceed that for the 25-species mechanism. This suggests that the benefits of the URan algorithm could be greater for more complex problems. 15
1e-3 tolerance, Local 5e-4 tolerance, Local 1e-3 tolerance, URan 5e-4 tolerance, URan
Speedup
10
5
0 0.E+00
2.E+06
4.E+06
6.E+06
8.E+06
1.E+07
Queries
Figure 77. ISAT Speedup Histories for the 25-Species Reduced Mechanism 15
1e-3 tolerance, Local 5e-4 tolerance, Local 1e-3 tolerance, URan 10
Speedup
5e-4 tolerance, URan
5
0 0.E+00
2.E+06
4.E+06
6.E+06
8.E+06
1.E+07
Queries
Figure 78. ISAT Speedup Histories for the 30-Species Reduced Mechanism
115
15
Speedup
25 species mechanism 30 species mechanism
10
30 species 5
25 species
0 0.E+00
2.E+06
4.E+06
6.E+06
8.E+06
1.E+07
Queries Figure 79. Comparison of Speedup of 25 and 30-Species Mechanisms for URan ISAT
4.6 CFD Demonstration
This section describes demonstrations in the CFD++ and VULCAN CFD codes of reduced mechanisms and ISAT. 4.6.1 CFD++ Results
The 2D jet flame case of Burrows & Kurkov130 was run using ethylene as the fuel to demonstrate the ISAT/reduced mechanism capability in CFD++. The 21-species reduced mechanism of Montgomery125 was used. Since the case was originally set up for hydrogen, the slower-burning ethylene does not show a fully-developed flame within the computational domain. Nevertheless, significant reaction does occur. The case converged without any problems, demonstrating the functioning of reduced mechanisms and ISAT in CFD++. Results are shown in Figure 80.
1.0 C2H4 mass frac. 0.0 2.6e-7 CH2O mass frac. 0.0 Figure 80. 2D Supersonic Flame130 Results Using a 21-Species Reduced Mechanism125 in the CFD++ CFD Code.
116
4.6.2 VULCAN Results
The 30-species JP-8 reduced mechanism has been implemented into VULCAN and successfully run for a 2D jet case. Results are shown in Figure 81. Shown are the temperature, the mass fractions of the two components of the simplified fuel surrogate, the radical species H, the hydrocarbon fragment intermediate C3H6, and the product species H2O and CO2. The run converged without problem. The conditions and grid did not allow a fully developed flame within the computational domain, but the ability to take a detailed mechanism from the literature, reduce it and run it in a CFD code is demonstrated. 2200
T (K) 300 0.89
n-C12H26 mass frac. 0.0 0.11
m-xylene mass frac. 0.0 9.4e-6
H mass frac. 0.0 8.8e-4
C3H6 mass frac. 0.0 2.3e-3
H2O mass frac. 0.0 3.7e-2
CO2 mass frac. 0.0
Figure 81. 2D Supersonic Flame Results Using a 30-Species Reduced Mechanism Based on the Violi et al1 Detailed Mechanism in the VULCAN CFD Code
The RC-18 case is a model of an ethylene-fueled, dual-mode scramjet combustor tested at AFRL. A diagram of the geometry is shown in Figure 82. A converging-diverging nozzle accelerates a vitiated airstream to about Mach 2. Following the isolator section, two rows of fuel injectors are place at the top and bottom of the channel. For the case run here, only two of the injectors on the top row nearest the stabilization cavity were turned on. The model grid consists of 43 blocks and about 2.3 million grid cells. The RC-18 case was run in VULCAN using ISAT versions 2.0 and 3.0 as well as direct source term evaluation. The chemical kinetics was modeled using an optimized 21-species reduced mechanism125 based on the Wang et al.111 detailed mechanism. The nozzle was run as a separate non-reacting case to provide inlet conditions for the combustor case. The combustor case was initialized using the ignition block feature in VULCAN. This feature was used in the flameholding cavity to force the temperature to be at least 1400 K until the flame was established. Once a stable flame was achieved the ignition blocks were turned off and the case was run several thousand more iterations.
117
Results of the RC-18 case are shown in Figure 83. Figure 83 shows cross-sections through the centerline of one of the fuel injectors. Species concentrations in Figure 83 are in mass fractions. The case did not fully converge during the time of the project as can be seen by the lack of a thermal throat. However, the flame in the cavity appears to be very robust, filling the cavity and firmly anchoring the combustor diffusion flame. The temperature in the cavity is about 2700 K and the concentration of OH and other radicals is high, indicating that the flameholding cavity is performing its function. The jet penetration is good with the fuel plume penetrating ~60% of the height of the duct. The combustion downstream of the flame holder, although not yet converged, had reached the full length of the computational domain and appears to be very robust with flame temperatures varying from 2700 K in the cavity to 2000 K in the diffusion flame near the duct exit. The fuel is mostly consumed, and significant amounts of products CO, CO2, and H2O are produced.
COMBUSTOR
ISOLATOR
NOZZLE (2.500, 2.750) (0.0, 4.0) (11.690, 1.500) (11.690, 0.000) (0.0, -2.5) (2.500, -1.250)
G (37.440, 1.500) I-1 I-2 C D B E A I-3 I-4 (37.440, 0.000)
Figure 82. Diagram of the RC-18 Scramjet Combustor
118
F
(70.440, 0.000)
T (K)
C2H4 0.15
CO 0.0
O2
Mach no. OH
0.02
0.0
CO2
0.18
0.0
0.33
H2O 0.0
Figure 83. Results (Not Completely Converged) for the VULCAN Simulation of the RC-18 Scramjet Combustor Case
Running the RC-18 case using ISAT was found to require a great deal of memory. The case was run on the HP XC Opteron machine Falcon which has 2.9 GB of memory per processor. The only way to get the case to run without it running out of memory was to use 50 CPUS, two CPUs per task. Thus 25 processors were computing the solution using the memory associated with 50 CPUs. Even running the case this way the ISAT table size was limited to 30,000 entries per processor. The ISAT error tolerance was set to 8.e-4.
119
Under the current ISAT algorithm, when a table reaches its maximum allocated size, it is erased and rebuilt. Running the RC-18 case using VULCAN/ISAT as described resulted in an average of about eight table rebuilds per iteration. This means that the number of thermochemical states being generated was so large that ISAT was unable to store sufficient entries to achieve a satisfactory retrieval rate. The result was that the ISAT computational overhead was actually greater than the retrieval savings resulting in a net slowdown for both versions of ISAT. Time per iteration is compared for ISAT versions 2.0 (local) and 3.0 (URAN) as well as direct source term evaluation is compared in Figure 84. The comparisons were made by averaging the time for 500 iterations starting from the same restart file for a condition in which a burning flame had been established.
Time per Iteration (s)
RC-18 Case 90 80 70 60 50 40 30 20 10 0 Local
URAN
Direct
Method Figure 84. Timing Comparisons for Local ISAT, URAN ISAT and Direct Source Term Evaluation for the RC-18 Scramjet Combustor Case Using a 21-Species Ethylene Reduced Mechanism
4.7 Technology Transfer Technology transfer of the products from this project has taken several forms.
Technical papers have been presented at meetings sponsored by the Joint Army Navy NASA Air Force (JANNAF) Interagency Propulsion Committee131, the American Institute of Aeronautics and Astronautics (AIAA)68,125,131,132, the American Chemical Society (ACS)133, and the Combustion Institute134. Reduced mechanisms for JP-8 combustion developed during Phase I of this program have been delivered to Dr. Ephraim Washburn of China Lake Naval Air Weapons Center, Prof. Riggins at the University of Missouri-Rolla (UMR) and Taitech, Inc., a support contractor for the Air Force Research Laboratory at Wright-Patterson Air Force Base. In addition, this project facilitated collaborative interactions between our project team and the research group at Stanford University lead by Prof. Ronald Hanson and with Dr. Hongzhi Zhang of the University of Utah. The improved detailed chemical kinetic mechanisms and reduced chemical kinetic mechanisms and experimental data generated in this project are deliverables to the Air Force. 120
Inclusion of the experimental data in the PRIME database (http://primekinetics.org) will be a valuable asset for researchers investigating JP8 kinetics. The upgraded VULCAN CFD codes, CFD++ and VULCAN, are deliverables to the Air Force, thereby providing tools that can be used by engineers and scientists performing production and research simulations in support of scramjet development. Through a license agreement with Metacomp Technologies, the improvements implemented into CFD++ for this project (i.e., JP-8 kinetics, ISAT) can be made available to academic and commercial organizations. In addition, REI is available to provide engineering services (e.g., evaluation and/or generation of detailed or reduced mechanisms, CFD modeling) for government, academic and commercial organizations.
121
5. Conclusions
Opposed-jet diffusion flame extinction experiments have been performed over a range of subatmospheric pressures for several vaporized liquid fuels diluted in nitrogen, and for pure methane and ethylene. The liquid fuel conditions were selected to match adiabatic flame temperature and stoichiometric mixture fraction. Under these conditions, we have demonstrated that a blend of n-decane and trimethylbenzene is a good surrogate for Jet-A. A new detailed chemical kinetic mechanism containing 566 species and 2024 reactions has been developed using modern computational chemistry techniques. It contains pressure-dependent kinetics for JP-8 surrogate components n-decane and TMB, as well as for smaller hydrocarbons such as n-heptane and ethylene and other aromatics such as m- and o-xylene and toluene. The mechanism is fundamental, meaning that the rates of the elementary reaction steps come from quantum mechanical calculations and measurements from the literature. No tuning has been done to achieve agreement with any experimental combustion measurements. The new mechanism agrees well with published ignition delay measurements for n-decane, but predicts ignition delay times that are a factor of 2-10 too slow for aromatic species such as m- and oxylene. No ignition delay measurements are available for TMB. Modeling of the counterflow extinction experiments is difficult. The nonuniform exit velocity profile of these experiments makes one dimensional modeling questionable. The empirical correction used here to convert global strain with a nonuniform profile to local strain with a single velocity is a reasonable approximation, but considerably more confidence could be gained by 2D modeling of these experiments. It is also likely that further work is needed to improve chemical kinetic mechanisms for the low pressure conditions found in these experiments. Better techniques are also needed to solve the very stiff sets of differential equations resulting from multidimensional modeling using detailed chemical kinetic models of large hydrocarbon combustion or to alleviate the inherent stiffness of these mechanisms. QSS reduced mechanisms created from skeletal mechanisms based on detailed chemistry show the ability to closely approximate the behavior of the full mechanism with many fewer species. Such reduced mechanisms hold great promise for transitioning the growing body of work in detailed chemical kinetics of large hydrocarbons that can be used to model real fuels into reacting flow engineering models that can be used to design advanced propulsion concepts. We believe the ISAT methodology and implementation is sound, but additional work is needed to build an experience base for cases the size of the RC-18 case and larger. Previous tests were on 2D and small 3D cases, where speedup factors of about 409 and more recently 5-10 using more efficient reduced mechanisms68 have been found. Clearly, more memory per processor, which would allow larger ISAT tables, would help the performance of ISAT. It would also be useful to explore the effect of tolerances on ISAT performance and accuracy for a case of this size. Algorithm parameters and variations such as tree-trimming, secondary searching, and strategies for dealing with full tables need to be explored for cases such as RC-18.
122
6. Recommendations
Combustion of small hydrocarbons such as ethylene can be very accurately modeled with about 20 species using the techniques described in this report. Real fuels, such as JP-8 can be modeled with good accuracy using a binary surrogate blend (normal alkane + substituted aromatic) using about 30 species. We recommend this modeling approach. Areas where further study would be profitable include the following:
2D modeling of the counterflow experiments described in this report,
Additional fundamental work on the combustion kinetics of substituted aromatics such as xylenes and TMB,
Additional algorithm development and tuning for ISAT for large (millions of grid cells), multiprocessor CFD simulations of reacting flow,
Numerical techniques to overcome the stiffness inherent in chemical kinetic models of large hydrocarbon combustion.
We make the following recommendations for detailed chemical kinetic mechanisms:
Ethylene The mechanism NJIT mechanism created during this project and the mechanism of Wang et al.127 are both very good. The NJIT mechanism is much more fundamental, while the Wang et al. mechanism may have the advantage of less stiffness.
N-heptane The NJIT and Lawrence Livermore National Laboratories128 mechanisms are both very good. Again, the NJIT mechanism is more fundamental.
N-decane The NJIT mechanism created during this project is, to our knowledge, the best available.
JP-8 The aromatic component of the NJIT JP-8 mechanism needs additional work to achieve agreement with ignition delay measurements for methyl-substituted aromatics. The Zhang mechanism3,4, while excellent for premixed flames, lacks sufficient ignition chemistry for scramjet modeling. We recommend the Violi et al. mechanism1 as the best currently available for JP-8.
123
References 1. Violi, A., Yan, S., Eddings, E. G., Sarofim, A. F., Gratata, S., Faravelli, T., and Ranzi, E., “Experimental Formulation and Kinetic Model for JP-8 Surrogate Mixtures,” Combustion Science and Technology, 174:339-417, 2002. 2. Mawid, M. A., Park, T. W., Sekar, B., Arana, C.A., “Development of Detailed Chemical Kinetic Mechanisms for Ignition/Oxidation of JP-8/Jet-A/JP-7 Fuels,” GT2-3-38932 ASME Turbo Expo, Atlanta, GA, June 16-19, 2003. 3. Zhang, H. R., Eddings, E. G. and Sarofim, A. F., “Criteria for Selection of Components for Surrogates of Natural Gas and Transportation Fuels,” Proceedings of the Combustion Institute, p 401, 2007. 4. Zhang, H., Eddings, E. G. and Sarofim, A. F., "Combustion reactions of paraffin components in liquid transportation fuels using generic rates," Combust. Sci. and Tech., 179: 61–89, 2007. 5. Honnet, S., Seshadri, K., Niemann, U. and Peters, N., “A Surrogate Fuel for Kerosene,” Thirty-Second International Symposium on Combustion, Montreal, Canada, Aug. 3-8, 2008. 6. Cheng, S.-I., “Hypersonic Propulsion,” Progress in Energy and Combustion Science, Vol. 15, No. 3, pp. 183– 202, 1989. 7. Tishkoff, J., Drummond, J., Edwards, T. and Nejad, A., “Future Direction of Supersonic Combustion Research,” AIAA paper, 2007, pp. 97–1017, 2007. 8. Chen, J.-Y., Workshop on Numerical Aspects of Reduction in Chemical Kinetics, CERMICS-ENPC, Cite Descartes -Champus sur Marne, France, Sept. 2, 1997. 9. Montgomery, C. J., Zhao, W., Eklund, D. R. and Chen, J.-Y., “CFD Simulations of Supersonic Hydrocarbon Combustion Using Reduced Mechanisms and ISAT,” AIAA Paper 2003-3547, AIAA Computational Fluid Dynamics Conference, Orlando, FL, June 23-26, 2003. 10. Montgomery, C. J., Zhao, W., Tam, C.-J., Eklund, D. R., and Chen, J.-Y., “CFD Simulations of a 3-D Scramjet Flameholder Using Reduced Chemical Kinetic Mechanisms,” AIAA Paper 2004-3874, AIAA/ASME/SAE/ASEE Joint Propulsion Conference, Fort Lauderdale, FL, July 11-14, 2004 11. Pope, S. B. “Computationally Efficient Implementation of Combustion Chemistry Using In Situ Adaptive Tabulation,” Combustion Theory and Modeling, 1: 42-63, 1997. 12. Montgomery, C. J., Yang, C., Parkinson, A. R., and Chen, J.-Y., “Selecting the Optimum Quasi-Steady State Species for Reduced Chemical Kinetic Mechanisms Using a Genetic Algorithm,” Combustion and Flame 144: 3752, 2006. 13. Peters, N., Turbulent Combustion, Cambridge University Press, pp. 186-193, 2000. 14. Berta, P., Puri, I.K. and Aggarwal, S.K., “Structure of Partially Premixed n-heptane-air Counterflow Flames,” Proceedings of the Combustion Institute, 30, pp. 447-453, 2005. 15. Cooke, J. A., Bellucci, M., Smooke, M. D., Gomez, A., Violi, A., Faravelli, T. and Ranzi, E., “Computational and Experimental study of JP-8, a Surrogate, and its Components in Counterflow Diffusion Flames,” Proceedings of the Combustion Institute, 30, pp. 439-446, 2005. 16. Holley, A.T., Dong, Y., Andac, M.G. and Egolfopoulos, F.N., “Extinction of Premixed Flames of Practical Fuels: Experiments and Simulations,” Combustion and Flame, v. 114, pp. 448-460, 2006. 17. Edwards, T. and Maurice, L. Q., Journal of Propulsion and Power, 17: 461-466, 2001. 18. Colket, M., Edwards, T., Williams, S., Cernansky, N.P., Miller, D.L., Egolfopoulos, F., Lindstedt, P., Seshadri, K., Dryer, F.L., Law, C.K., Friend, D., Lenhert, D., Pitsch, H., Sarofim, A., Smooke, M. and Tsang, W., “Development of an Experimental Database and Kinetic Models for Surrogate Jet Fuels,” AIAA Paper 2007-770, 2007. 19. Gilbert, R. G., Luther, K. and Troe, J., "Theory of Thermal Unimolecular Reactions in the Fall-Off Range: Weak Collision Rate Constants," J. Ber. Bunsenges. Phys. Chem., 87, 169-175, 1983.
124
20. Stewart, P. H., Larson, C. W. and Golden, D., "Pressure and Temperature Dependence of Reactions Proceeding Via a Bound Complex," Combust. & Flame, 75, 25, 1989. 21. Wang, H. and Frenklach, M., "Wang-Frenklach Fall-Off Parameterization," Chem. Phys. Lett., 205, 271, 1993. 22. Pawlowska, Z., Gardiner, W. C. and Oref, I., "Gardiner-Oref J equation and alpha-eqaution for semi-empirical fall-off parameters," J. Phys. Chem., 97, 5024, 1993. 23. Poole, J. S. and Gilbert, R. G., "Improved Method for Fitting Fall-Off Data," Int. J. Chem. Kinet., 26, 273, 1994. 24. Kazakov, A., Wang, H. and Frenklach, M., J. Phys. Chem., 98, 10598, 1994. 25. Venkatesh, P. K., Chang, A. Y., Dean, A. M., Cohen, M. H. and Carr, R. W., "Parameterization of Pressure- and Temperature- Dependent Kinetics in Multiple Well Reactions," AIChE Journal, 43 (5), 1331-1339, 1997. 26. Venkatesh, P. K., Dean, A. M., Cohen, M. H. and Carr, R. W., "Chebyshev Expansions and Sensitivity Analysis for Approximating the Temperature- and Pressure-Dependence of Chemically-Activated Reactions," Reviews in Chemical Engineering, 13 (1), 1997. 27. Chang, A. Y., Bozzelli, J. W. and Dean, A. M., "Kinetic Analysis of Complex Chemical Activation and Unimolecular Dissociation Reactions using QRRK Theory and the Modified Strong Collision Approximation," Zeit. Phys. Ch., 214, 1533-1568, 2000. 28. Sheng, C. Y., Bozzelli, J. W., Dean, A. M. and Chang, A. Y., "Detailed kinetics and thermochemistry of C2H5+O-2: Reaction kinetics of the chemically-activated and stabilized CH3CH2OO center dot adduct," Journal of Physical Chemistry A, 106 (32), 7276-7293, 2002. 29. Benson, S. W., Thermochemical Kinetics, 2nd ed., Wiley-Interscience: New York, 1976. 30. Lay, T. H., Bozzelli, J. W., Dean, A. M. and Ritter, E. R., "Hydrogen atom Bond Increments for Thermodynamic properties of Hydrocarbon Radical Species," J. Phys. Chem., 99, 14514-14527, 1995. 31. Scott, A. P. and Radom, L., "Harmonic Vibrational Frequencies, An Evalution of HF, MP, QCI, DFT, and Semiempirical Scale Factors," J. Phys. Chem. 100, 16502-16513, 1996. 32. Pitzer, K. S. And Gwinn, W. D., J. Chem. Phys. 10, 428, 1942. 33. Sebbar, N., Bozzelli, J. W. and Bockhorn, H., "Thermochemical properties, rotation barriers, bond energies, and group additivity for vinyl, phenyl, ethynyl, and allyl peroxides," Journal of Physical Chemistry A, 108 (40), 83538366, 2004. 34. Sebbar, N., Bockhorn, H. and Bozzelli, J. W., "Thermodynamic properties (S-298, C-p(T), internal rotations and group additivity parameters) in vinyl and phenyl hydroperoxides," Physical Chemistry Chemical Physics, 5 (2), 300307, 2003. 35. Sebbar, N., Bockhorn, H., Bozzelli, J. W., "Structures, thermochemical properties (enthalpy, entropy and heat capacity), rotation barriers, and peroxide bond energies of vinyl, allyl, ethynyl and phenyl hydroperoxides," Physical Chemistry Chemical Physics, 4 (15), 3691-3703, 2002. 36. Chen, C. J. and Bozzelli, J. W., "Kinetic analysis for HO2 addition to ethylene, propene, and isobutene, and thermochemical parameters of alkyl hydroperoxides and hydroperoxide alkyl radicals," Journal of Physical Chemistry A, 104 (21), 4997-5012, 2000. 37. Lee, J. and Bozzelli, J. W., "Thermochemical and kinetic analysis of the formyl methyl radical plus O-2 reaction system," Journal of Physical Chemistry A, 107 (19), 3778-3791, 2003. 38. Sheng, C., "Elementary, Pressure Dependent Model For Combustion Of C1, C2 And Nitrogen Containing Hydrocarbons: Operation Of A Pilot Scale Incinerator And Model Comparison," Ph. D. Dissertation, New Jersey Institute of Technology, 2001. 39. Dean, A. M. and Bozzelli, J. W., "Combustion Chemistry of Nitrogen," Gas-Phase Combustion Chemistry, Gardiner, Jr. W. C., Ed., Springer-Verlag new York, Inc.: New York, 2000. 40. Zhong, X. and Bozzelli, J. W., "Thermochemical and Kinetic Analysis of the H, OH, HO2, O, and O2 Association Reactions with Cyclopentadienyl Radical," J. Phys. Chem. A, 102 (20), 3537-3555, 1998.
125
41. Ritter, E. R., CPFIT, J. Chem. Info. Comput. Sci. 31, p. 400, 1991. 42. Bozzelli, J. W., Chang, A. Y. and Dean, A. M., "Molecular Density of States from Estimated Vapor Phase Heat Capacities," Int. J. Chem. Kinet., 29 (3), 161-170, 1997. 43. Gilbert, R. G. and Smith, S. C., Theory of Unimolecular and Recombination Reactions, Blackwell Scientific Publications: Oxford, 1990. 44. Carter, W. P. and Tardy, D. C., J. Phys. Chem., 78, 1579-1582, 1974. 45. Fox, L. and Parker, I. B., Chebyshev Polynomials in Numerical Analysis, Oxford University Press: London, 1968. 46. Rivlin, T. J., Chebyshev Polynomials From Approximation Theory to Algebra and Number Theory, Second ed., Wiley-Interscience, 1990. 47. A.M. Dean, J.W. Bozzelli, CHEMACT: A computer code to estimate rate constants for chemically activated reactions. Combust Sci. Tech., 80 63-85, 1991. 48. Dean, A.M., J. Phys. Chem. 89, p. 4600, 1985. 49. Ritter, E., and J.W. Bozzelli, Int. J. Chem. Kinetics, 23, p. 767 1991. 50. Frish, M.J. et al.,Gaussian 03, Revision D.01, Gaussian, Inc., Pittsburgh, PA, 7276-7293, 2003. 51. Chen, C.J., and Bozzelli J.W., J. Phy. Chem. A, 103 (48), 9731-9769, 1999. 52. Carstensen H., Dean A.M., Proceedings of the Combustion Institute 30 p. 995–1003, 2005 53. da Silva G., Chen C. C., Bozzelli J.W., J. Phys. Chem. A, 111 (35), 8663 -8676, 2007. 54. Sveen, J. K., “An Introduction to MatPIV 1.4 - the Particle Image Velocimetry Toolbox for Matlab,” http://www.math.uio.no/~jks/matpiv, 1998. 55. Fristrom, R.M., Flame Structure and Processes, New York: Oxford University Press, 1995. 56. Eckert, E.R.G. and Goldstein, R.J., Measurements in Heat Transfer, Washington: Hemisphere Publishing Corp., 1978. 57. Collis, D.C. and Williams, M.J., “Two-Dimensional Convection from Heated Wires at Low Reynolds Numbers,” Journal of Fluid Mechanics v.6, Part 3, pp. 357-384, 1959. 58. Touloukian, Y. S. (ed.), Thermophysical Properties of High Temperature Solid Materials, Vol. 1, Macmillan, New York, 1967. 59. Neuer, G. and Jaroma-Weiland, G., “Spectral and Total Emissivity of High-Temperature Materials,” International Journal of' Thermophysics, Vol. 19, No. 3, pp. 917-929, 1998. 60. Seshadri, K. and Williams, F. A., “Laminar Flow Between Parallel Plates with Injection of a Reactant at High Reynolds Number,” International Journal of Heat and Mass Transfer, Vol. 21, No. 2, pp. 251–253, 1978. 61. Chelliah, H.K., Law, C.K., Ueda, T., Smoke, M.D. and Williams, F.A., “An Experimental and Theoretical Investigation of the Dilution, Pressure and Flow-Field Effects on the Extinction Condition of Methane-Air-Nitrogen Diffusion Flames,” 23rd Symposium on Combustion, The Combustion Institute, pp. 503-511, 1990. 62. Pellett, G.L., Vaden, S.N. and Wilson, L.G., “Opposed Jet Burner Extinction Limits: Simple Mixed Hydrocarbon Scramjet Fuels vs. Air,” presented at the 43rd AIAA/ASME/ASEE Joint Propulsion Conference and Exhibit, July 8-11, 2007, Cincinnati, OH, AIAA paper 2007-5664, 2007. 63. Zegers, E.J.P., Williams B.A., Fisher, E.M., Fleming, J.W. and Sheinson, R.S., “Suppression of Nonpremixed Flames by Fluorinated Ethanes and Propanes,” Combustion and Flame, 121, pp. 471-487, 2000. 64. Holley, A.T., Dong, Y., Andac, M.G., Egolfopoulos, F.N. and Edwards, T., “Ignition and Extinction of NonPremixed Flames of Single-Component Liquid Hydrocarbons, Jet Fuels, and Their Surrogates,” Proceedings of the Combustion Institute, 31, pp. 1205-1213, 2007.
126
65. Chen, R., and Axelbaum, R.L., “Scalar Dissipation Rate at Extinction and the Effects of Oxygen-Enriched Combustion,” Combustion and Flame, 142, pp. 62-71, 2005. 66. Lu, T.F., and Law, C.K., Combust. Flame 146, pp.472-483, 2006. 67. Tham, Y.F, and Chen, J.-Y., “Speedy Solution of Quasi-Steady-State Species by Combination of Fixed-Point Iteration and Matrix Inversion,” Combustion and Flame, 153: 634-644, 2008. 68. Montgomery, C.J., Tang, Q., Bozzelli, J.W., and White, J.A. “Improved Chemical Kinetic Models for Scramjet Combustion Simulation,” AIAA Paper 2007-0773, 45th AIAA Aerospace Sciences Meeting and Exhibit, Reno, NV Jan. 8-11, 2007. 69. Norton, T. S. and Dryer, F. L., Int. J. Chem. Kinet., 22 (219), 1990. 70. De Avillez Pereira, R., Baulch, D. L., Pilling, M. J., Robertson, S. H. and Zeng, G., "Temperature and Pressure Dependence of the Multichannel Rate Coefficents for the CH3+OH System," J. Phys. Chem. A, 101 (50), 96819693, 1997. 71. Smith, S. R. and Gordon, A. S., J. Phys. Chem., 60, 1956. 72. Fletcher, J. C., Proc. Roy. Soc. (London), A147 (119), 1934. 73. Someno, F., Bull. Ins. Phys. Chem. Research (Tokyo), 21 (27), 1942. 74. Cooke, D. F., Dodson, M. G. and Williams, A., Combustion and Flame, 16 (233), 1971. 75. Bowman, C. T., Combustion and Flame, 25 (343), 1975. 76. Aronowitz, D., Santoro, R. J., Dryer, F. L. and Glassman, I. "Kinetics of the Oxidation of Methanol: Experimental Results Semi-Global Modeling and Mechanistic Concepts," 17th Symposium (International) on Combustion, Combustion Institute, 1978. 77. Westbrook, C. K. and Dryer, F. L., Combust. Sci. and Tech., 20 (125), 1979. 78. Westbrook, C. K., Creighton, J., Lund, C. and Dryer, F. L., J. Phys. Chem., 81 (2542), 1977. 79. Vandooren, J. and Van Tiggelen, P. J., "Experimental Investigation of Methanol Oxidation in Flames: Mechanism and Rate Constants of Elementary Steps," Ontario, Canada, 1981. 80. Norton, T. S. and Dryer, F. L., "The Flow Reactor Oxidation of C1-C4 Alcohols and MTBE," Orleans, France, 1990. 81. Grotheer, H.-H., Riekert, G., Walter, D. and Just, T., "Reactions of Hydroxymethyl and Hydroxyethyl Radicals with Molecular and Atomic Oxygen," Seattle, WA USA, 1988. 82. Yetter, R. A., Dryer, F. L. and Rabitz, H., Combustion Science and Technology, 79 (97), 1991. 83. Hochgreb, S. and Dryer, F. L., Combustion Flame, 91 (257), 1992. 84. Ing, W,."Reaction Kinetics on Methanol and MTBE Oxidation and Pyrolysis," New Jersey Institute of Technology, 1996. 85. Norton, T. S. and Dryer, F. L., Combust. Sci. and Tech., 63 (107), 1989. 86. Held, T. J. and Dryer, F. L., "A Comprehensive Mechanism for Methanol Oxidation," Internation Journal of Chemical Kinetics, 30 (11), 805-830, 1998. 87. Smith, G. P., Golden, D. M., Frenklach, M., Moriarty, N. W., Eiteneer, B., Goldenberg, M., Bowman, C. T., Hanson, R. K., Song, S., Gardiner, W. C. Jr., Lissianski, V. V. and Qin, Z., "GRI-Mech 3.0," 2004. 88. Ing, W. C., Sheng, C. Y. and Bozzelli, J. W., "Development of a detailed high-pressure reaction model for methane/methanol mixtures under pyrolytic and oxidative conditions and comparison with experimental data," Fuel Processing Technology, 83 (1-3), 111-145, 2003. 89. Warnatz, J., "Combustion Chemistry," Gardiner, W. C., Ed.; Springer-Verlag: New York, Chap. 5, 1984. 90. Krasnoperov, L. N. and Chesnokov, E. N., "Reaction of unimolecular dissociation of formyl radical, HCO>H+CO, studied over 1-100 bar buffer gas pressure range," Chem. Phys. Processes Combust., 293-295, 1999.
127
91. Evleth, E. M., Melius, C. F. and Rayez, M. T., "Theoretical Characterization of the Reactions of HO2 with Formaldehyde," J. Phys. Chem., 97, 5040-5045, 1993. 92. Sebbar, N., Bockhorn, H. and Bozzelli, J. W., "Thermodynamic Properties and Reactions of vinyl hydroperoxides, peroxy radicals and phenyl hydroperoxide," NIEHS: Research Triangle Park, NC, 2001. 93. Bozzelli, J. W. and Sheng, C., "Thermochemistry, Reaction Paths, and Kinetics on the Hydroperoxy-Ethyl Radical Reaction with O2: New Chain Branching Reactions in Hydrocarbon Oxidation," J. Phys. Chem. A, 106, 1113-1121, 2002. 94. Cobos, C. J., Hippler, H., Luther, K., Ravishankara, A. R. and Troe, J., "High pressure limit param for CH3 + O2 -> CH3OO," J. Phys. Chem., 89, 4332, 1985. 95. Yu, C.-L., Wang, C. and Frenklach, M., "Chemical Kinetics of Methyl Oxidation by Molecular Oxygen," J. Phys. Chem., 99, 14377-14387, 1995. 96. Walch, S. P., J. of Chem. Phys., 98 (4), 3163-3167, 1993. 97. Hsu, C.-C., Mebel, A. M. and Lin, M. C., "Ab initiomolecular orbital study of the HCO1O2 reaction: Direct versus indirect abstraction channels," J. Chem. Phys., 105 (6), 2346-2352, 1996. 98. Dean, A. M. and Westmoreland, P. R., "QRRK agreement," Int. J. Chem. Kinet., 19 (207), 1987. 99. Yamada, T., "The Oxidation of Dimethyl-Ether and Ethylene in the Atmosphere and Combustion Environment and Thermodynamic Studies on Hydrofluorocarbons Using Ab Initio Calculation Methods," Ph. D. Dissertation, New Jersey Institute of Technology, 1999. 100. Yamada, T., Bozzelli, J. W. and Lay, T. H., "Comparisons of CBS-q and G2 Calculations on Thermodynamic Properties, Transition States, and Kinetics of Dimethyl-ether + O2 Reaction System," Int. J. Chem. Kinet., 32 (7), 435-452, 2000. 101. Walker, R. and W. C. Morley, "Basic Chemistry of Combustion," Low-Temperature Combustion and Autoignition, Elsevier: Amsterdam; New York, pp 1-124, 1997. 102. Bach, R. D., Ayala, P. Y. and Schlegel, H. B., "A Reassessment of the Bond Dissociation Energies of Peroxides," J. Am. Chem. Soc., 118, 12758, 1996. 103. Carpenter, B. K, J. Phys. Chem., 99, 9801, 1995. 104. Carpenter, B. K. J. Am. Chem. Soc. 115, 9806, 1993. 105. Lee, J., Chen, C.-J. and Bozzelli, J. W., "Thermochemical and Kinetic Analysis of the Acetyl Radical (CH3C*O) + O2 Reaction System," J. Phys. Chem. A, 106 (31), 7155-7170, 2002. 106. da Silva, G., J. W. Bozzelli, L. Liang, J. T. Farrell, “Thermochemistry and kinetics of the alpha and betahydroxyethyl radical + O2 reactions in ethanol combustion”, 5th US Combustion Meeting, San Diego, United States, 25-28 March 2007. 107. Zhu, L., J.W. Bozzelli, L.M. Kardos, J. Phys. Chem. 111, 6361, 2007. 108. Kaiser, E. W., J. Phys. Chem. 99, 707, 1995. 109 Clifford, E. P.; Farrell, J. T.; DeSain, J. D.; Taatjes, C. A. J. Phys.Chem A 104, 11549, 2000. 110 Mittal, G., Sung, C.-J., and Yetter, R.A.. “Autoignition of H2/CO at Elevated Pressures in a Rapid Compression Machine,” International Journal Chemical Kinetics, 38: 516-529, 2006. 111. Wang, H., Laskin, A., Djurisic, Z. M., Law, C. K., Davis, S. G., and Zhu, D. L., “A Comprehensive Mechanism of C2Hx and C3Hx Fuel Combustion,” Eastern States Section of the Combustion Institute Meeting, Raleigh, NC, Oct., 1999. 112. Y. Huang, C.J. Sung, J.A. Eng, Combust. Flame, 139 (2004) 239-251. 113. Davis, S.G. and C.K. Law, Proc. Comb. Inst. 27521-527, 1998. 114. Kwon, O.C., M.I. Hassan, and G.M. Faith, J. Propulsion Power, 16 513, 2000.
128
115. Dean A.J., O.G. Penyazkov, K.L. Sevruk , and B. Varatharajan , “Autoignition of surrogate fuels at elevated temperatures and pressures,” Proceedings of the Combustion Institute 31 2481–2488, 2007. 116. Ciezki, H.K. and Adomeit, G., "Shock-Tube Investigation of Self-Ignition of n-Heptane-Air Mixtures Under Engine Relevant Conditions," Combustion and Flame 93:421-433, 1993. 117. Minetti, R., Carlier, M., Ribaucour, M., Therssen, E., and Sochet, L.R., “A Rapid Compression Machine Investigation of Oxidation and Auto-Ignition of n-Heptane: Measurements and Modeling,” Combustion and Flame, 102, pp. 298-309, 1995. 118. Pfahl, U. and Adomeit, G., 21st Int'l Symp. On Shock Waves, pp. 273-278, 1997. 119. Hornung, D.C., D.F. Davidson and R.K. Hanson, “Study of the high-temperature autoignition of nalkane/O2/Ar mixtures,” J. Propulsion Power, 18 363, 2002. 120. Roubaud, A., Minetti, R., and Sochet, L.R., “Oxidation and Combustion of Low Alkylbenzenes at High Pressure: Comparative Reactivity and Auto-Ignition,” Combustion and Flame, 121, pp. 535-541, 2000. 121. Battin-Leclerc, F., Bounaceur, N., Belmekki, N., and Glaude, P.A., “Experimental and Modeling Study of the Oxidation of Xylenes,” Int. J. Chem. Kinetics 38, pp. 284-302, 2006. 122. Mullins, B. P., “Autoignition of Hydrocarbons,” AGARDograph No. 4, 1955. 123. Freeman, G. and Lefebvre, A. H., “Spontaneous Ignition Characteristics of Gaseous Hydrocarbon-Air Mixtures,” Combustion and Flame 58:153-162, 1984. 124. Vasu, S. S., D. F. Davidson, R. K. Hanson, “Jet fuel ignition delay times: Shock tube experiments over wide conditions and surrogate model predictions,” Combustion and Flame 152:125-143, 2008. 125. Montgomery, C.J., “Optimized Reduced Chemical Kinetic Mechanisms for Ethylene and JP-8 Combustion,” AIAA Paper 2007-0771, 45th AIAA Aerospace Sciences Meeting and Exhibit, Reno, NV Jan. 8-11, 2007. 126. Lutz, A.E., Kee, R.J., Grcar, J.F., and Rupley, F.M., “OPPDIF: A FORTRAN Program for Computing Opposed-Flow Diffusion Flames,” Sandia National Laboratories Report SAND-8243, 1997. 127. Wang, H., You, X, Joshi, A.V., Davis, S.G., Laskin, A., Egolfopoulos, F., Law, C.K., “USC Mech Version II. High-Temperature Combustion Reaction Model of H2/CO/C1-C4 Compounds”. http://ignis.usc.edu/USC_Mech_II.htm, May 2007. 128. Seiser, H., H. Pitsch, K. Seshadri, W. J. Pitz, and H. J. Curran, "Extinction and Autoignition of n-Heptane in Counterflow Configuration," Proceedings of the Combustion Institute 28, pp. 2029-2037, 2000. 129. Evans, J. S., Schexnayder, C. J. Jr., and Beach, H. L. Jr., “Application of a Two-Dimensional Parabolic Computer Program to Prediction of Turbulent Reacting Flows,” NASA TP 1169, 1978. 130. Burrows, M.C. and Kurkov, A.P., “Supersonic Combustion of Hydrogen in a Vitiated Air Stream using Stepped-wall injections,” AIAA Paper No. 71-121, AIAA/SAE 7th Propulsion Joint Specialist Conference, June 1418, 1971. 131. Dattarajan, S., Montgomery, C.J., Gouldin, F.C., Fisher, E.M., Bozzelli, J.W., “Extinction of Opposed Jet Diffusion Flames of Scramjet Fuel Components at Subatmospheric Pressures,” AIAA-2008-0996 46th AIAA Aerospace Sciences Meeting, Reno, NV, Jan. 7-10, 2008. 132. Montgomery, C.J., Tang, Q., Sarofim, A., and Bozzelli, J.W., “Supersonic Reacting Flow Simulations Using Reduced Chemical Kinetic Mechanisms and Multiprocessor ISAT,” AIAA-2008-1014, 46th AIAA Aerospace Sciences Meeting, Reno, NV, Jan. 7-10, 2008. 133. Asatryan, R., Montgomery. C., and Bozzelli, J.W., “Chemical Activation and Stabilized Adduct Reactions of nPentyl,” 235th American Chemical Society National Meeting, New Orleans, LA, April 6-10, 2008. 134. Bozzelli, J.W, Asatryan, R., and Montgomery, C.J., “Pressure Dependent Mechanism for H/O/C(1) Chemistry,” 5th U.S. Combustion Meeting, San Diego, CA, March 25-28, 2007.
129
Appendix A List of Cross Reactions
The chemical kinetic mechanism generated during this project is constructed to contain a mixture of two fuels with one being n-decane and the other being 1,2,4 trimethylbenzene (TMB). It is important, but uncommon, for a mechanism to have cross reactions between the two fuel parent molecules and the important initial fuel radicals and other possible higher concentration intermediates, which may consist of both radical and stable species. The following cross reactions between n-decane and n-decane radicals with TMB and corresponding benzyl radicals of TMB listed below are included in the mechanism. In the list below, which uses the same nomenclature as the chemical kinetic mechanism file, TMB is called “B124M” and n-decane is called “NC10H22”. For additional notation details see Section 3.2.2.1 NC10H22+B12M4J=DC-2J+B12M NC10H22+B12M4J=DC-4J+B12M
B2M + DC-1J = C6H5CH2 + NC10H22 B2M + DC-2J = C6H5CH2 + NC10H22 B2M + DC-4J = C6H5CH2 + NC10H22
NC10H22+B2M4MJ=DC-1J+B24M NC10H22+B2M4MJ=DC-2J+B24M NC10H22+B2M4MJ=DC-4J+B24M
B12M + DC-1J = B1MJ2M + NC10H22 B12M + DC-2J = B1MJ2M + NC10H22 B12M + DC-4J = B1MJ2M + NC10H22
NC10H22+B1J24M=DC-1J+B24M NC10H22+B1J24M=DC-2J+B24M NC10H22+B1J24M=DC-4J+B24M
B24M + DC-1J = B2M4MJ + NC10H22 B24M + DC-2J = B2M4MJ + NC10H22 B24M + DC-4J = B2M4MJ + NC10H22
NC10H22+C6H5CH2=DC-1J+B2M NC10H22+C6H5CH2=DC-2J+B2M NC10H22+C6H5CH2=DC-4J+B2M
B124M + DC-1J = B12M4MJ + NC10H22 B124M + DC-2J = B12M4MJ + NC10H22 B124M + DC-4J = B12M4MJ + NC10H22
NC10H22+B1J2M=DC-1J+B2M NC10H22+B1J2M=DC-2J+B2M NC10H22+B1J2M=DC-4J+B2M
B124M + DC-1J = B1MJ24M + NC10H22 B124M + DC-2J = B1MJ24M + NC10H22 B124M + DC-4J = B1MJ24M + NC10H22
NC10H22+B2M4J=DC-1J+B2M NC10H22+B2M4J=DC-2J+B2M NC10H22+B2M4J=DC-4J+B2M
NC10H22+C6H5=DC-1J+C6H6 NC10H22+C6H5=DC-2J+C6H6 NC10H22+C6H5=DC-4J+C6H6 NC10H22+B124M6J=DC-1J+B124M NC10H22+B124M6J=DC-2J+B124M NC10H22+B124M6J=DC-4J+B124M NC10H22+B12M4MJ=DC-1J+B124M NC10H22+B12M4MJ=DC-2J+B124M NC10H22+B12M4MJ=DC-4J+B124M NC10H22+B1MJ24M=DC-1J+B124M NC10H22+B1MJ24M=DC-2J+B124M NC10H22+B1MJ24M=DC-4J+B124M NC10H22+B1MJ2M=DC-1J+B12M NC10H22+B1MJ2M=DC-2J+B12M NC10H22+B1MJ2M=DC-4J+B12M NC10H22+B12M4J=DC-1J+B12M
130
Appendix B1 Bozzelli_Detailed_TMB-NC10_chem.inp
The file, Bozzelli_Detailed_TMB-NC10_chem.inp, is a stand-alone file that will be available on CD (see technical report AFRL-RZ-WP-TR-2008-2224 for this file, which is proprietary). It contains the detailed Bozzelli mechanism in Chemkin format.
131
Appendix B2 Bozzelli_Detailed_TMB-NC10_therm.dat
The file, Bozzelli_Detailed_TMB-NC10_therm.dat, is a stand-alone file that will be available on CD (see technical report AFRL-RZ-WP-TR-2008-2224 for this file, which is proprietary). It contains the thermodynamic data for the detailed Bozzelli mechanism in Chemkin format.
132
Appendix B3 Bozzelli_Detailed_TMB-NC10_tran.dat
The file, Bozzelli_Detailed_TMB-NC10_tran.dat, is a stand-alone file that will be available on CD (see technical report AFRL-RZ-WP-TR-2008-2224 for this file, which is proprietary). It contains the transport data for the detailed Bozzelli mechanism in Chemkin format.
133
Appendix C1 Violi_Detailed_JP-8_chem.inp
The file, Violi_Detailed_JP-8_chem.inp, is a stand-alone file that will be available on CD (see technical report AFRL-RZ-WP-TR-2008-2224 for this file, which is proprietary). It contains the detailed Violi mechanism in Chemkin format.
134
Appendix C2 Violi_Detailed_JP-8_therm.dat
The file, Violi_Detailed_JP-8_therm.dat, is a stand-alone file that will be available on CD (see technical report AFRL-RZ-WP-TR-2008-2224 for this file, which is proprietary). It contains the thermodynamic data for the detailed Violi mechanism in Chemkin format.
135
Appendix C3 Violi_Detailed_JP-8_tran.dat
The file, Violi_Detailed_JP-8_tran.dat, is a stand-alone file that will be available on CD (see technical report AFRL-RZ-WP-TR-2008-2224 for this file, which is proprietary). It contains the transport data for the detailed Violi mechanism in Chemkin format.
136
Appendix D1 Bozzelli_Skeletal_N-Decane_chem.inp
The file, Bozzelli_Skeletal_N-Decane_chem.inp, is a stand-alone file that will be available on CD (see technical report AFRL-RZ-WP-TR-2008-2224 for this file, which is proprietary). It contains the skeletal Bozzelli mechanism in Chemkin format.
137
Appendix D2 Bozzelli_Skeletal_N-Decane_therm.dat
The file, Bozzelli_Skeletal_N-Decane_therm.dat, is a stand-alone file that will be available on CD (see technical report AFRL-RZ-WP-TR-2008-2224 for this file, which is proprietary). It contains the thermodynamic data for the skeletal Bozzelli mechanism in Chemkin format.
138
Appendix D3 Bozzelli_Skeletal_N-Decane_tran.dat
The file, Bozzelli_Skeletal_N-Decane_tran.dat, is a stand-alone file that will be available on CD (see technical report AFRL-RZ-WP-TR-2008-2224 for this file, which is proprietary). It contains the transport data for the skeletal Bozzelli mechanism in Chemkin format.
139
Appendix E1 Violi_Skeletal_JP-8_chem.inp
The file, Violi_Skeletal_JP-8_chem.inp, is a stand-alone file that will be available on CD (see technical report AFRL-RZ-WP-TR-2008-2224 for this file, which is proprietary). It contains the skeletal Violi mechanism in Chemkin format.
140
Appendix E2 Violi_Skeletal_JP-8_therm.dat
The file, Violi_Skeletal_JP-8_therm.dat, is a stand-alone file that will be available on CD (see technical report AFRL-RZ-WP-TR-2008-2224 for this file, which is proprietary). It contains the thermodynamic data for the skeletal Violi mechanism in Chemkin format.
141
Appendix E3 Violi_Skeletal_JP-8_tran.dat
The file, Violi_Skeletal_JP-8_tran.dat, is a stand-alone file that will be available on CD (see technical report AFRL-RZ-WP-TR-2008-2224 for this file, which is proprietary). It contains the transport data for the skeletal Violi mechanism in Chemkin format.
142
Appendix F1 USC_Skeletal_Ethylene_chem.inp
The file, USC_Skeletal_Ethylene_chem.inp, is a stand-alone file that will be available on CD (see technical report AFRL-RZ-WP-TR-2008-2224 for this file, which is proprietary). It contains the skeletal USC ethylene mechanism in Chemkin format.
143
Appendix F2 USC_Skeletal_Ethylene_therm.dat
The file, USC_Skeletal_Ethylene_therm.dat, is a stand-alone file that will be available on CD (see technical report AFRL-RZ-WP-TR-2008-2224 for this file, which is proprietary). It contains the thermodynamic data for the skeletal USC ethylene mechanism in Chemkin format.
144
Appendix F3 USC_Skeletal_Ethylene_tran.dat
The file, USC_Skeletal_Ethylene_tran.dat, is a stand-alone file that will be available on CD (see technical report AFRL-RZ-WP-TR-2008-2224 for this file, which is proprietary). It contains the transport data for the skeletal USC ethylene mechanism in Chemkin format.
145
Appendix G Bozzelli_Reduced_Decane25.f90
The file, Bozzelli_Reduced_Decane25.f90, is a stand-alone file that will be available on CD (see technical report AFRL-RZ-WP-TR-2008-2224 for this file, which is proprietary). It contains the 25-species reduced Bozzelli decane mechanism in Fortran format.
146
Appendix H Bozzelli_Reduced_Decane30.f90
The file, Bozzelli_Reduced_Decane30.f90, is a stand-alone file that will be available on CD (see technical report AFRL-RZ-WP-TR-2008-2224 for this file, which is proprietary). It contains the 30-species reduced Bozzelli decane mechanism in Fortran format.
147
Appendix I Violi_Reduced_JP-8-30.f90
The file, Violi_Reduced_JP-8-30.f90, is a stand-alone file that will be available on CD (see technical report AFRL-RZ-WP-TR-2008-2224 for this file, which is proprietary). It contains the 30-species reduced Violi JP-8 mechanism in Fortran format.
148
Appendix J Wang_Reduced_Ethylene19.f90
The file, Wang_Reduced_Ethylene19.f90, is a stand-alone file that will be available on CD (see technical report AFRL-RZ-WP-TR-2008-2224 for this file, which is proprietary). It contains the 19-species reduced Wang ethylene mechanism in Fortran format.
149
Appendix K Wang_Reduced_Ethylene21.f90
The file, Wang_Reduced_Ethylene21.f90, is a stand-alone file that will be available on CD (see technical report AFRL-RZ-WP-TR-2008-2224 for this file, which is proprietary). It contains the 21-species reduced Wang ethylene mechanism in Fortran format.
150
Appendix L REIISAT_src
The folder, REIISAT_src, is a stand-alone folder that will be available on CD (see technical report AFRL-RZ-WP-TR-2008-2224 for this file, which is proprietary). It contains the files that make up Version 2.0 of the REIISAT software package. Additionally, the User’s Guide and Reference Manual, REIISAT_manual.pdf, is included in the folder.
151