increase the overall signal strength, and reduce the degree ... Actual measurements using invasive tech- niques in ... above the valves with ultrasound echo measurements of diameter .... The SD-100 has been slightly modified to allow online.
1 Introduction DOPPLER ECHOCARDIOGRAPHY has for some years been used as a potentially sound and noninvasive method for measurement of cardiac output (CO). Several investigators have compared Doppler measurements with parallel estimates of cardiac output obtained by other methods, mainly thermodilution (IHLEN etal., 1984; MCLENNAN et al., 1986; FAST etal., 1988). They have all concluded that there is a reasonably good correlation between results from the Doppler and other methods. Doppler echocardiography has been found to yield values for cardiac output in the same range as, and in acceptable accordance with, results from other methods. There are various technical and practical problems connected with attempts to make a reliable recording of every stroke volume in a consecutive series of heartbeats using the Doppler ultrasound method. As the method is theoretically advantageous, noninvasive and without risk to the test persons, we have elaborated on some of its technical and theoretical features. Our aim has been to achieve more continuous measurements and to improve their reliability. The best location for measuring CO, defined as the amount of blood leaving the left ventricle per unit time, is at the level of the aortic valves. IHLEN et al. (1984) measured the maximum velocity at this point, and multiplied it by the cross-sectional area found by echo imaging. This procedure was shown to give time-averaged results in good accordance with thermodilution measurements in a First received 3rd July and in final form 30th December 1989
9 IFMBE: 1990 Medical & Biological Engineering & Computing
steady-state situation. However, Doppler signals obtained from a location so near to the aortic valves will often be of inferior quality as a result of strong Doppler-shifted sound reflected from the moving solid structures of the heart, the vessel walls, and from the valve leaflets themselves. There also tends to be a high degree of ultrasonic attenuation in the tissues from the suprasternal notch or the apical position, which are convenient sites for transducer location. This is because of the distance from the transducer position, and the possible intermittent interposition of lung tissue in the sound path. The latter often limits the time intervals in which reliable Doppler signals can be obtained. In particular, signal strength tends to drop dramatically in the inspiratory phase, often limiting reliable measurements to the expiratory phase of the respiratory cycle. As Ihlen's group (IHLEN et al., 1984; 1987) and others have relied on averages of several selected beats, the method must be refined to obtain reliable measurements of each and every beat. For the above reasons, a sampling volume located nearer to the transducer would be preferable, as this would increase the overall signal strength, and reduce the degree of interposition of attenuating lung tissue between the transducer and the sampling site. The theoretical prediction that the blood jet in the aortic valve orifice formed during systole conserves its velocity for some distance upwards can be confirmed, so that the sampling volume can be positioned a few centimetres above the aortic valve where distortions are minimal, but velocity values are still unaltered.
November 1990
555
2 Method development
2.1 Anatomical and hydrodynamic considerations Fig. 1 shows the left ventricle of the heart and the aortic root. Blood is expelled from the left ventricle into the aorta during systole. At the level of the aortic valves, the bloodstream is constricted by a fibrous ring, which supports the valve leaflets. Above the valve, the aorta widens out, forming the bulb of the aorta. During systole, a blood jet is formed through this rigid ring. The jet is directed upwards in the wide ascending part of the aorta and continues well above the edge of the open valves. Its highest velocities are displaced towards the inner curvature of the aortic arc (VIELIe t al., 1986; SEGADALand MATRE, 1987).
2.2 Experimental investigation o f method assumptions The existence of a rectangular velocity profile in the aortic orifice can be confirmed by actual noninvasive Doppler measurements of velocities in the aortic orifice, using a transducer with a broad sampling volume set at the appropriate depth. The velocity distribution can be calculated by Fourier analysis of the returned Doppler frequency spectrum, as is demonstrated in an experiment illustrated in Fig. 2. The measurement was taken from a supine, resting subject, with a 2 M H z pulsed transducer positioned in the suprasternal notch, and measuring at a depth of 95 mm, corresponding to a location just above the aortic valve. The sampling volume was symmetric along the axis of the beam, with a triangular envelope and a total
> o
"(3 0 o
0'.1
0"2
013 0"4 015 0.6 0"7 vetocity, m $-1
0"8
0.9
1-0
Fig. 2 Velocity distribution at the aortic valve level. The curve was obtained by averaging velocity distributions calculated from Doppler spectra at mid-systole from six consecutive cardiac cycles. The stepped appearance is caused by the method used for constructing the curve, by calculating spectral power percentile values from the Doppler instrument in steps of 5 per cent. Each rectangle used to build the curve thus contains 5 per cent of the sampled bloodstream. The velocity axis markers indicate the median and the 94th percentile of the velocity distribution
f Fig. 1 The left ventricle of the heart, together with the aortic valve and the aortic root. The drawing was made from an angiogram taken in late diastole
When a stream of fluid reaches a gradual circular constriction, as in the left ventricular outlet, its velocity profile tends to become rectangular (NIKURADS~, 1929; ROUSE, 1961). In addition it is known from hydrodynamic theory that putsatile flow augments the formation of a rectangular flow profile. Actual measurements using invasive techniques in experimental animals and in man have confirmed this (STEIN and SABBAH,1985; FARTHINGand PERONN~AU, 1979; PAtJLSEN, 1980). Furthermore, it is known from hydrodynamic theory that when a tube widens out, the central part of such a jet conserves its maximum velocity for quite some distance after the jet has been formed (e.g. WILLE and WALLOE, 1981). If the ejection jet velocity of the bloodsteam is conserved for some distance after leaving the valvular orifice, it is possible to obtain the mean velocity at the orificial level simply by measuring the maximum velocity at the preferred location a few centimetres above the valves. On the assumption that the velocity profile across the valvular orifice is rectangular, cardiac output can then be calculated by combining velocity measurement a few centimetres above the valves with ultrasound echo measurements of diameter at the valvular orifice. 556
length of 20 tissue half-wavelengths. The spectrum achieved is relatively narrow-banded, supporting the hypothesis that the velocity profile is rectangular. The spread observed in the plot of velocity distributions in Fig. 2 is caused by the combined effect of (a) the time window situation caused by the short time of passage of individual blood corpuscles through the spatial sampling volume (b) Fourier transform inaccuracy introduced by estimation of frcquency by the use of a fixed sampling time window (c) the actual spread of velocities present in the bloodstream. By computation (Fourier transformation of the expected transient signal from a single point scattering object passing through the sampling volume with a constant velocity), the spectral spread from the spatial sampling window can be estimated. With reference to Fig. 2, assuming a velocity of 0.9 s -1, it can be shown that the transit time effect (a) accounts for a spread (SD) of _+0.015 m s-1. The Fourier transform process generates 64 frequency bins, and the process gives an approximate halfpower spectral spread of _+ one bin. At the instrument setting used, the bandwidth of each bin corresponds to a velocity range of 0-03 m s-1. Because these apparent velocity spreads are independently generated at different points along a signal processing path, and each spread is approximately a normal distribution, they will add up to about _+0.04ms-1. This means that the true spread of blood
Medical & Biological Engineering & Computing
November 1990
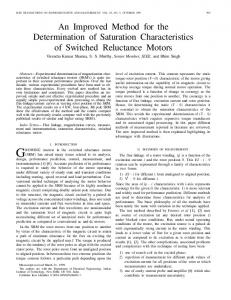
velocities at the aortic orifice is considerably smaller than illustrated in Fig. 2, because the spread in Fig. 2 is only slightly greater than that accounted for in the calculation above. The conservation of blood jet maximum velocity above the valves was confirmed by measurements in all subjects examined in the present study. As an example, in Fig. 3 the apparent systolic stroke distance found by integrating instantaneous maximum velocity from pulsed Doppler measurement is plotted against sampling volume distance above the aortic valve in one of our subjects. The sampling volume location was moved by adjusting the sampling distance setting of the Doppler instrument. As shown in Fig. 3, we found that the velocity integral is within 90 per
0'20 ;
c-
o.m !
o~
0.16
tt
0-14 0-12
6
i;
2'o
;o
distance above valve, mm
Fig. 3 Averaged systolic stroke distances against distance above and slightly below the aortic valve in one of the subjects studied. Each point represents the average of 50 heartbeats. +_one standard deviation of the observed values is indicated at each level
cent of its maximum value up to about 30mm above the valve level. Above this level, the stroke distance (systolic velocity integral) is successively reduced. This is partly because the jet loses its high central peak velocity, and partly because the curvature of the aortic arch diverts the bloodstream away from the direction of the ultrasonic beam. The data presented in Fig. 3 are representative for most such measurements.
2.3 T h e Doppler instrument and the measurement procedure Any suitable pulsed Doppler instrument with spectral analysis can theoretically be used for measurement of cardiac output according to our method. It is important, however, to use a high-performance instrument which gives a sufficiently high signal-to-noise ratio to allow all cardiac cycles to be analysed automatically, without manual editing. In this study, we used a standalone Doppler instrument (SD-100, Vingmed Sound A/S, Horten, Norway), operated at 2 MHz. This unit contains the analogue Doppler hardware, a transversal filter chirp-z discrete Fourier transform system and a spectrum-based maximum velocity estimator. The instrument continuously displays the audio spectrum and the estimated maximum velocity during measurement. The spectrum is calculated with a total of 64 coefficients, and with an adjustable frequency offset to enable simultaneous display of forward and backward velocities. A new set of spectral coefficients is calculated every 10ms, and both temporal and frequency averaging are carried out to minimise variance in the spectrum without losing too much information (KRISTOFFERSEN, 1984). The instantaneous maximum velocity limax is estimated from the spectral coefficients every 10ms. A robust estimate is obtained by calculating the frequency at which a Medical & Biological Engineering & Computing
pre-defined percentile of the total spectral power is contained at frequencies below the estimate. In this study, the 94th percentile was used, thereby obtaining a fair compromise between noise, sensitivity and accuracy. The SD-100 has been slightly modified to allow online digital interfacing to an Apricot XI microcomputer (ACT, Birmingham, UK), which runs a dedicated data collection and analysis program, BVA (Blood Velocity Analyzer, Andiamo A/S, Oslo, Norway) (ERIKSEN and KJAERNES, 1989). The modification of the equipment involves the installation of a digital interfacing card inside the Doppler instrument, as well as placing a multilead cable between the instrument and the built-in parallel communications port of the computer. The purpose of the interface card is to pick up and buffer the digital information written to the analogue recorder outputs in the Doppler instrument. The card also generates a strobe signal every 10ms to tell the computer that a new set of data is ready to be transferred. The Doppler measurements were made with the instrument operated at 2.0MHz in pulsed mode. This mode enables selection of sampling volume distance from the transducer. A single, unfocused (flat surface) transducer was used. Such a transducer gives a more uniform sound intensity pattern with fewer sidelobes than a two-crystal transducer. The use of the same transducer for transmission and reception also ensures complete overlap between the spatial sensitivity patterns of the transmitter and the receiver. The spatial intensity patterns of the transducers were measured beforehand in a water tank, and only transducers with near axisymmetrical soundbeam patterns were used (GuLDVOG et al., 1980). It was also necessary for the beam pattern to be consistent with patterns obtained by numerical calculations. The one-way travel, half-intensity beam width at the requested sampling distance was about 5ram. The thickness (depth interval) of the sampling volume was set at 8 mm. This is the total width of the sampling volume, inside which a triangular amplitude weighting function is applied. This function has its maximum at the centre of the window, and it is symmetrically reduced to zero at the edges of the window. Using this sampling volume thickness is a compromise between spatial resolution on one side and signal strength and velocity resolution on the other. To remove Doppler-shifted echoes originating from slowly moving objects, the built-in highpass filter of the instrument was used. The threshold velocity was typically set to between 0.20 and 0.25ms -1. This effectively prevents Doppler-shifted signals originating in diastole from reaching the input of the maximum velocity estimator, which is constructed to force its output to zero when total signal intensity falls below a preset threshold. However, for short time intervals at start and end of systole, the maximum frequency will be below the filter threshold. By calculation, it can be shown that this procedure causes an underestimation of the velocity integral of about 1-2 per cent, an effect small enough to be totally disregarded. The spectrogram shown in Fig. 4, with a high-pass filter setting corresponding to 0.2 m s-1, demonstrates the effects of the high-pass filter by exhibiting a clear zone around the baseline. The distance from the suprasternal notch to the sampling volume location used in our subjects was generally 60mm. At this distance, sound pulse emissions can be repeated at intervals of about 80#s, corresponding to a frequency of 12.5kHz. Doppler-shifted frequencies up to 6.25kHz (corresponding to a blood velocity of about 2ms -1) can be reproduced without aliasing at this sampling rate. Obviously, the same limitations apply to the sampling process taking place prior to the discrete Fourier
November 1990
557
transformation of the signal. Because measurements are restricted to subjects without aortic valvular disease, this velocity range will be sufficient, so that no frequency aliasing will take place. The transducer is hand-held by a well trained operator, and positioned in the suprasternal notch, with the soundbeam aimed towards the ascending aorta. The correct beam direction is identified as the one giving the highest velocity indications during peak systole. This direction is continuously fine-tuned by the operator, who monitors the velocity spectrum and listens to the audio Doppler signal through a pair of stereo headphones. The best sampling volume depth has been found beforehand, by applying the procedure mentioned above, and illustrated in Fig. 3.
E 2
"5 a~ O_
.t o w
am1.0 >EEo. 6.2 5.61-
"".,,/
- 105F "', J u~ 1001"",~
"~
~_
. /
time, s
Fig. 4
A lOs section of ECG, recorded Doppler spectrum and several variables derived from the original spectrum. From top to bottom the traces are Doppler spectrum, ECG, maximum velocity, cardiac output and stroke volume. As a result of the method for signal processing, beat-by-beat values of cardiac output and stroke volume cannot be determined before completion of the actual cardiac cycle. These values are therefore calculated and plotted at the
end of the cardiac cycle To discriminate between individual heartbeats, a threelead ECG recording was made through the SD-100 internal ECG amplifier. The output of this was transferred to the computer, and an online adaptive threshold detection algorithm was used to identify the individual QRS complexes. The crossing of the R-wave rising edge with a preset threshold was used for this detection. This threshold is automatically set at 50-70 per cent of the peak voltage of the previous R-wave. The detection algorithm allows for variations in the ECG amplitude, and will not usually detect T-waves. To further improve the accuracy of detection, a minimum time interval between successive detections could be specified, thus completely eliminating possible T-wave detection. Because the ECG was sampled in synchrony with the Doppler-derived blood velocity, event determination with a greater accuracy than l0 ms was impossible. However, as the R-wave coincides with a period with low velocities in the aorta, this possible 'jitter' will have minimal effects on the calculated velocity values. Instantaneous flow was found by multiplying instantaneous maximum velocity by the cross-sectional area of the valvular orifice. This area was found from M-mode or sector-scan ultrasound echo measurements of valvular diameter. The measurement was carried out from the parasternal position with a combined Doppler and imaging instrument (CFM-700, Vingmed 558
Sound A/S, Horten, Norway). The individual orifice diameters were determined from images by the leading edge to leading edge method, taking the average of values determined by three individual scans. The area is calculated from the diameter, assuming the valve opening to be circular. Stroke volume was found by numerically integrating velocity during the cardiac cycle, as defined by the R-R intervals. CO was estimated beat for beat by dividing stroke volume by the duration of the corresponding R-R time interval. During the systolic heart contraction, the aortic root moves downwards. This is caused by a combination of inertial forces and a direct pull by the heart which becomes more spherical as the wall tension increases and ventricular emptying begins (ROBINSON et al., 1986). The peak-topeak amplitude of this movement is about 9 mm in the experimental subjects, as observed by sector-scan ultrasound imaging from the heart's apical position. If blood velocity is measured relative to a point fixed on the body surface, the movement of the aortic root will cause a systematic underestimation of velocity during systole. Assuming an aortic ring diameter of 25 ram, the underestimation of systolic stroke volume will be about 5 ml. In practice, an approximate correction was made by adding 5ml to each calculated stroke volume, This volume is believed to be fairly constant between persons, and in one and the same person under most conditions. The relative error introduced by estimating this volume incorrectly will be small. The instrumental arrangement allows stroke volumes and flow to be recorded for long periods of time. This is because the calculation of integrals is performed online, and only one set of values needs to be stored for each cardiac cycle. The measured values can be postprocessed offline with programs external to the BVA program. Such operations include time averaging (low-pass filtering), integration and correlation analysis. All information transfers from BVA are made using text files containing number columns, a format which is compatible with most computer programming languages. 3 Examples Figs. 4-6 serve to show some of the types of observations that can be obtained with the equipment and method described. Fig. 4 gives a typical display of recorded values over a 10 s period. Even if the contour of the sound spectrogram is not perfectly defined, it is followed quite closely by the Vmax estimator. The figure shows beat-for-beat stroke volume and flow variations which are not easily observed in the raw trace. However, the variations are clearly revealed after integrating the velocity curve over the complete cardiac cycle. Another set of observations is shown in Fig. 5. Here, CO is recorded during rest first in the supine and then in the sitting position in one and the same subject. The two measurement sessions, each with a duration of some 25 s, were separated by about 1 min. As expected, CO and stroke volume (SV) drops and heart rate (HR) increases after changing from the supine to the sitting position. The longer-lasting recording in Fig. 6 demonstrates that dynamic events, with rapid changes in CO, can also be closely followed using the method and technique discussed here. Here CO, SV and HR were continuously recorded in a supine person before and after the start of moderate, rhythmic, bilateral leg exercise. This exercise consisted of nearly isometric alternating contractions of the quadriceps femoris muscles, each contraction lasting for 2 s. The force
Medical & Biological Engineering & Computing
November 1990
c
5"0 4.5
0"4.o 110 t
-~ loo I 8O 7O
E
d V
5 Fig. 5
"7c
10 15 20 time,s
5
1'0 1'5 20 time,s
Cardiac output, stroke volume and heart rate before and after the transition from supine to sitting position in a resting subject
70
60 50
i
40
8'~1
AA.AA AAA AMr, j
9~ 7"0
r
!
f
~ 9o
015
110 115 time, min
210
2"5
Fig. 6 A 289
recording of heart rate (upper trace), cardiac output (middle trace) and stroke volume (lower trace) on transition from rest to moderate, supine bilateral rhythmic leg exercise. The dotted vertical line indicates start of exercise
developed was controlled by attaching known weights to the ankles, and each contraction lifted the heel a few centimetres above a supporting table (WEscI-m and WALLOE, 1988). A continuous and complete series of heartbeats is depicted from rest and through the rapidly occurring changes in HR and CO at the start of exercise. 4 Discussion The method described represents several improvements in the procedure for ultrasound Doppler measurements of CO described by IHLEN et al. (1984). One important difference from previous procedureg is the use of a velocity sampiing volume location above the aortic ring in combination with the measured cross-sectional area at the ring level. The theoretical and verified basis for such a Medical & Biological Engineering & Computing
combination is the conservation of the blood jet velocity upwards from the aortic valve. In this procedure, the distance from the transducer in the suprasternal notch to the sampling site is shorter, resulting in a considerable increase in the signal strength. Velocity measurement above the aortic orifice also has the advantage of reducing lowfrequency interference from valve and myocardial movements in the Doppler signal. The improved signal quality makes it possible to obtain reliable and fully continuous long-term measurements of CO, with stroke volume and flow determinations for each and every separate cardiac cycle. To our knowledge, such a full continuity in recordings has not been achieved before. The reliability of recordings is good enough to make manual postprocessing or editing superfluous. The method can be implemented with other brands of equipment than those used in this report. The main requirements are a pulsed Doppler unit with spectrum analysis and a high-quality M-mode or sector scan apparatus for aortic ring dimensional measurement. However, to obtain the full benefit of the method, a means of online collection and processing of the measured values is needed. With CO defined as the amount of blood leaving the left ventricle through the aortic valves, coronary flow will of course be included in CO. At rest, coronary flow is some 10 per cent of CO. The main part of this flow takes place in diastole. As our sampling site is located above the coronary ostia, it might be thought that coronary flow is not included in our measurements. However, any systolic drainage of blood from the circumferential part of the proximal blood jet will not influence its centrally located systolic peak velocity, which is what we measure. Even if the net amount of blood passing through the aorta over the whole cardiac cycle at the level of the sampling site does not include coronary flow, the method will nevertheless include coronary flow in the measured values, which give the full systolic output of the left ventricle. The method described appears to be a reasonable and attractive way of estimating CO in humans. However, there are some methodological problems which represent possible sources of systematic as well as random errors in flow and stroke volume estimates. 4.1 Flow cross-sectional area The method assumes that the cross-sectional area of the jet-forming orifice does not change with time. M-mode recordings of annulus diameter show variations during the cardiac cycle with a relative peak-to-peak amplitude of the order of 2 per cent, with the highest value in systole. During exercise, with raised blood pressure, the averaged diameter may increase by about another 2 per cent, as observed by CrmISWIE et al. (1987). These area changes are relatively small compared with those of the aortic root itself, which is far more compliant. We assume these variations to be of minor importance, as we use diameter estimates recorded during systole. Because the aortic ring diameter estimate is to be squared to calculate area, the accuracy of the whole method depends critically on the accuracy of this measurement. Typically, a 0.5 mm error in the diameter will result in a 5 per cent error in the flow estimate. 4.2 Noise Noise from the electronic circuits can be a limiting factor in Doppler measurements. Estimates of maximum frequency in the Doppler audio spectrum can be sensitive to noise. As a result of the use of fractile-based estimation
November 1990
559
of Vmax, the system is quite resistant to noise. The spectral averaging built into the instrument facilitates estimation of V,,ax by reducing the variance of the spectrum. In addition, reducing the sampling volume depth by some 2-3 cm compared with the distance to the valve substantially improves the signal-to-noise ratio. In conclusion, electronic noise is not a problem in this system. 4.3 Validation against other methods IHLEN et al. (1984) have compared measurements of C O with their Doppler method against thermodilution during steady-state situations with favourable results. F r o m Fig. 3, it is evident that their method of measuring at the aortic ring level and our modified method will give similar results in steady-state situations. F o r two reasons, there is no point in a further and elaborate comparison of steadystate findings with this improved method with similar results from other methods such as thermodilution, dye dilution variations of the Fick method (DoRB and DONOVAN, 1987) etc. One reason is the inherent problems and uncertainties connected with all previous methods. Another reason is the discovery with this improved method of continuous and considerable fluctuations in the C O of a resting person from minute to minute. Because of these normal fluctuations, both repeated measurements of C O with one and the same method, and repeated and alternate measurements with two different methods will necessarily produce somewhat different C O values as a reflection of the variations. Analyses of dynamic events by this method would be difficult to compare with other methods and techniques, as these are largely based on averaging procedures in steadystate situations. Acknowledoments--We thank Jarlis Wesche for help with the measurements shown in Figs. 3-6, and Bjarne A. Waaler for valuable comments on the manuscript. References CHRISTIE, J., SHELDAL,L. M., TRISTANI, F. E., SAGAR, K. B., PTACIN, M. J. and WANN, S. (1987) Determination of stroke volume and cardiac output during exercise: comparison of two-dimensional and Doppler echocardiography, Fick oximetry, and thermodilution. Circ., 76, 539-547. DOBB, G. J. and DONOVAN,K. D. (1987) Non-invasive methods of measuring cardiac output. Intensive Care Med., 13, 304-309. ERIKSEN, M. and KJAERNES, M. (1989) BVA--blood velocity analyzer. Research report 123, Department of Informatics, University of Oslo, ISBN 82-7368-028-2. FARTHING, S. and PERONNEAU, P. (1979) Flow in the thoracic aorta. Cardiovasc. Res., 13, 607-620. FAST, J. H., VAN DEN MERKHOF,L., BLANS,W., VAN LEEUWEN,K. and UIJEN, G. (1988) Determination of cardiac output by single gated pulsed Doppler echocardiography. Int. J. Cardiol., 21, 33-42. GULDVOG, 1., KJAERNES, M., THORESEN, M. and WALLOE, L. (1980) Blood flow in arteries determined transcutaneously by an ultrasonic Doppler velocitymeter as compared to electromagnetic measurements on the exposed vessels. Acta Physiol. Scand., 109, 221-266. IHLEN,H., AMLIE,J. P., DALE, J., FOREANG,K., NITTER-HAUGE,S., OTTERSTAD,J. E., SIMONSEN,S. and MVHRE, E. (1984) Determi-
560
nation of cardiac output by Doppler echocardiography. Br. Heart J., 51, 54-60. IHLEN, H., ENORESEN, K., MYRENG, Y. and MYrmE, E. (1987) Reproducibility of cardiac stroke volume estimated by Doppler echocardiography. Am. J. Cardiol., 59, 975-978. KRISTOFFERSEN,K. (1984) Real time spectrum analysis in Doppler ultrasound blood velocity measurements. SINTEF report STF48 A84030. SINTEF, Trondheim, Norway. MCLENNAN, F. M., HAITES,N. E., MACKENZIE,J. D., DANIEL,M. K. and RAWLES,J. M. (1986) Reproducibility of linear cardiac output measurement by Doppler ultrasound alone. Br. Heart J., 55, 25-31. NIKURADSE, J. (1929) Untersuchungen fiber die Str6mungen des Wassers in konvergenten und divergenten Kan/ilen. Forschungsarbeiten auf dem Gebiete des lngenieurwesens, 289, 1-49. PAULSEN, P. K. (1980) The hot-film anemometer--a method for blood velocity determination. II In vivo comparison with the electromagnetic blood flowmeter. Eur. Surg. Res., 12, 149-158. ROBINSON, T. F., FACTOR, S. M. and SONNEBLICK,E. H. (1986) The heart as a suction pump. Sci. Am., 254, 62-67. ROUSE, H. (1961) Fluid mechanics for hydraulic engineers. Dover Publ. Inc., New York, 262-263. SEGADEL,L. and MATRE, K. (1987) Blood velocity distribution in the human ascending aorta. Circ., 76, 90-100. STEIN, P. D. and SABBAH, H. N. (1985) Blood velocity, velocity profiles, disturbances of flow and phasic dimensional changes of valve annuli and great vessels. In Cardiovascular ultrasonic flowmetry. ALTOBELLI,S. A., VOYLES,W. F. and GREEN, E. R. (Eds.), Elsevier Science Publ. Co., New York, 63. VILLI, A., JENNI, R. and ANLIKER,M. (1986) Spatial velocity distributions in the ascending aorta of healthy humans and cardiac patients. IEEE Trans., BME-33, 28-34. WESCI~, J. and WALLOE,L. (1988) Time course and magnitude of blood flow changes in the human quadriceps muscles during and following rhythmic exercise. J. Physiol., 405, 257-273. WILLE, S. ~. and WALLOE,L. (1981) Pulsatile pressure and flow in arterial stenoses simulated in a mathematical model. J. Biomed. Eng., 3, 17-24.
Authors' biographies Morten Eriksen was born in 1955 in Oslo, Norway and graduated from medical school, University of Oslo in 1981. While a medical student he participated in the development of UNIDOP, a heterodyne directional ultrasound Doppler blood velocity meter. He has now been working for five years in the Department of Physiology, University of Oslo, where he has been developing equipment and methods for noninvasive haemodynamic studies.
Lars Walloe was born in Oslo, Norway, ~n 1938. He studied medicine at the University of Oslo 1957-1963, and received the Ph.D. in Physical Chemistry in 1965 and MD degree in Physiology in 1968, both from the University, of Oslo. He was Professor of Informatics at the University of Oslo 1970-1988, becoming head of department in 1978. Since 1988 he has been Professor of Physiology there. His interests are in physical chemistry, neurophysiology, applied statistic,;, cardiovascular physiology and pathology, and Doppler ultrasound methods. In 1972 he initiated the Norwegian technical development in the Doppler ultrasound field (Vingmed etc.).
Medical & Biological Engineering & Computing
November 1990