functionals for endocardium and epicardium segmentation to account for their distinctive characteristics; 2) proposing a dual-background model that is suitable ...
IMPROVED SEMI-AUTOMATED SEGMENTATION OF CARDIAC CT AND MR IMAGES Chao Li, Xiao Jia and Ying Sun Department of Electrical and Computer Engineering, National University of Singapore, Singapore 117576 ABSTRACT
model of the background may still fail to differentiate the myocardium and the right ventricle (RV) when the contrast between them is not good; 3) the shape prior term may generate incorrect force directions in cases with large papillary muscles; and 4) potentially nonconvergent contours can lead to inaccurate estimation of myocardium thickness. To address these issues, we propose to use different energy functionals for endocardium and epicardium segmentation by taking into account their respective characteristics. The proposed segmentation method integrates the desirable features of existing methods [5, 6] with a dualbackground intensity model for epicardium segmentation, a novel shape prior term, and a weighted method for estimating myocardium thickness. The rest of the paper is organized as follows. Section 2 describes in detail the proposed segmentation method. Our experimental results are presented in Section 3, followed by conclusion in Section 4.
This paper presents a semi-automated segmentation method for short-axis cardiac CT and MR images. The main contributions of this work are: 1) using two different energy functionals for endocardium and epicardium segmentation to account for their distinctive characteristics; 2) proposing a dual-background model that is suitable for representing intensity distributions of the background in epicardium segmentation; 3) designing a novel shape prior term that is robust and controllable; and 4) an improved estimation of myocardium thickness by using edge information. Experimental results on cardiac CT, perfusion and cine MR images show that our method is robust and effective for both CT and MR images. Index Terms— myocardium segmentation, level set, region based, shape prior 1. INTRODUCTION
2. METHOD
Cardiac image segmentation is an important and challenging problem. Due to lack of contrast, conventional image segmentation methods, either boundary-based [1, 2] or regionbased [3], often cannot produce reliable and accurate results for cardiac images. Therefore, shape priors [4] and hybrid segmentation frameworks [5] have been explored to solve the problem. In [5], the STACS method combines both edge and region based information as well as an elliptical shape prior into one energy functional for minimization. This method is able to separate papillary muscles from the endocardium and has been shown to produce relatively accurate segmentation results on short-axis rat heart images. Recently, Chen et al. developed a semi-automated cardiac contour segmentation method for cine displacement-encoded MRI [6], which improves the STACS method by using a nonparametric model of the background intensity distribution, a self-adaptive parametric shape prior model, and contour interaction between epicardial and endocardial surfaces. However, this method [6] may not produce accurate segmentation results for cases with poor image quality due to the following reasons: 1) it uses the same energy functional for both endocardium and epicardium segmentation, without recognizing their distinct characteristics, such as local image contrast and the presence of papillary muscles; 2) using a non-parametric
We develop an improved hybrid framework for cardiac CT and MR image segmentation, which consists of two steps: initialization and evolution. In the initialization step, first the user selects a seed point in the left ventricle (LV). Then the image is classified by maximum likelihood to roughly detect the LV cavity and to estimate the myocardium thickness. Finally, we initialize the endocardial contour using an ellipse fitted to the detected LV cavity, and initialize the epicardial contour by dilating the endocardial contour with the estimated thickness (see Fig. 1 (a)). In the evolution step, the endocardium (C1 ) and epicardium (C2 ) are represented by the zero levels of two level set functionals φ1 and φ2 , respectively. The region with φk > 0 corresponds to the interior of the contour, and φk < 0 to the exterior. Thus the myocardium is defined by {(x, y)| φ1 (x, y) ≤ 0 & φ2 (x, y) ≥ 0} . 2.1. Energy Functionals We define two energy functionals J1 (φ1 ) and J2 (φ2 ), minimizing which solve the corresponding segmentation problems. The general form of the two energy functionals is: Jk (φ) = λka Jka (φ) + λkb Jkb (φ) + λkc Jkc (φ) +λkd Jkd (φ) + λke Jke (φ), k = 1, 2.
This work was supported by NUS grant R-263-000-470-112.
978-1-4244-3932-4/09/$25.00 ©2009 IEEE
(1)
25
(2)
ISBI 2009
It consists of five terms: a) a region-based term incorporating the intensity distribution variation between different regions; b) an edge-based term attracting the contour to the boundaries between different regions; c) a shape-prior term forcing the contour to resemble the prior shape; d) a smoothness term controlling the smoothness of the contour; and e) a thickness constraint term to prevent it from resulting in uneven myocardium thickness. The weighting factors {λka , ..., λke } control the contribution of each term. In cardiac CT and MR images, generally there are strong edges along the endocardial boundary, whereas at the epicardial boundary edge-based information is not as reliable due to the complex background and poor contrast. Therefore, endocardium segmentation (J1 (φ1 )) should rely on the edge-based term but not the thickness constraint to respect the good contrast between the endocardium and the LV blood pool, while in contrast, epicardium segmentation (J2 (φ2 )) should include the thickness constraint but not the edge-based term to prevent the contour from being attracted by irrelevant edges. In our framework, this is achieved by setting λ1e = 0 and λ2b = 0. Due to the facts that the epicardium is surrounded by a complex background and papillary muscles should be excluded from the myocardium, we use different formulations of region-based and shape-based terms in J1 (φ1 ) and J2 (φ2 ). In the followings, we describe each term in the energy functionals with special emphasis on the differences between the two energy functionals. a) Region-based term: As shown in Fig. 1 (a), the image is divided into three regions by the two contours. For each contour, the region-based model separates the two corresponding regions according to the difference in their intensity distributions. Let p (u(x, y)|Ωi ) denote the probability density function for Ωi . The region-based term is given by: �� Jka (φ) = − ln p (u(x, y)|Ωi ) dxdy, (3) i∈Rk
Ω3
Ω2
Ω1
(a)
(b)
(c)
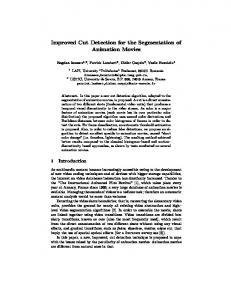
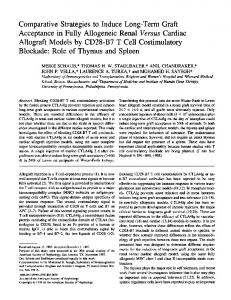
Fig. 1. Segmentation results obtained using only the region term and the smoothness term: (a) the initial contours; the contours after 100 iterations evolved by (b) non-parametric method [6], and (c) our dual-background method. The image was reformatted from a 3D CT data set available at http://www.osirix-viewer.com. This is because the upper part of the RV, which only takes a small proportion in Ω3 , has similar intensities as pixels in Ω2 . Consequently, for these intensities the estimated p(u|Ω3 ) is smaller than p(u|Ω2 ) and hence resulting in leaks. To obtain an intensity model that properly represents different background regions, we divided Ω3 into two subregions: ΩLow = {(x, y)|u(x, y) < μ2 } , and
(4)
ΩHi = {(x, y)|u(x, y) ≥ μ2 } ,
(5)
where (x, y) ∈ Ω3 , u(x, y) is the intensity value of (x,y) and μ2 is the mean intensity of Ω2 . For different regions, the background model is automatically selected as: � p(u(x, y)|ΩLow ) if u(x, y) < μ2 , (6) p(u(x, y)|Ω3 ) = p(u(x, y)|ΩHi ) if u(x, y) ≥ μ2 where p(u(x, y)|ΩLow ) and p(u(x, y)|ΩHi ) are estimated using Gaussian models. As shown in Fig.1(c), this dualbackground approach effectively prevents the epicardial contour from leaking into the RV. b) Edge-based term: The definition of the edge-based term is the same as (14) in [5], except we use an inverse edge indicator function:
Ωi
where Rk = {1, 2}, for k = 1; and Rk = {2, 3}, for k = 2. Endocardium: Similar to [5], assuming that the intensity distributions of Ω1 and Ω2 are approximately Gaussian, we use Gaussian models in endocardium segmentation. Epicardium: In contrast to endocardium segmentation, the background of the epicardium (Ω3 ) contains different region clusters, some of which are brighter than the object Ω2 (e.g. RV) while the rest are darker than Ω2 (e.g. lung). As far as the region-based term is concerned, at the epicardial boundary, the background intensity model should be representative of the intensity distribution of its local background region. Therefore, using a unique Gaussian[5] or non-parametric[6] model for Ω3 may not accurately segment the epicardium when the background is complex. Fig.1 displays the segmentation results obtained using only the region-based term and the smoothness term on a CT image. As shown in Fig. 1 (b), the epicardial contour leaks into the RV when direct non-parametric models are used.
Υ = 1/ (1 + |∇Gσ ∗ u|) ,
(7)
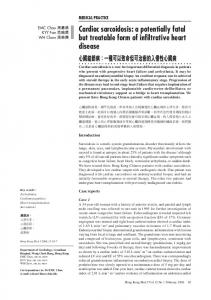
where Gσ is the 2-D Gaussian kernel with variance σ 2 . c) Shape prior term: Because both endocardium and epicardium resemble ellipses, we use an elliptical shape prior similar as in [5] and [6]. During the endocardial contour estimation, in the STACS method [5] all pixels are weighted equally, whereas in [6], pixels with negative curvatures on C1 are eliminated from the estimation. Although the later has the advantage of effectively removing papillary muscles in general, when there are only a few pixels having non-negative curvatures, the ellipse fitting can become instable, see the yellow curve in Fig. 2 (a). Aiming at both robustness and effectiveness, we use a weighted
26
problem, we set D1E = 0 for the exterior of the estimated ellipse in order to only move the inner part of the endocardial contour. Thus, we can effectively exclude papillary muscles from the myocardium and at the same time avoid collapsing. For epicardium segmentation, issues of papillary muscles are not present. Hence we penalize both sides of the prior shape to avoid leaking. d) Smoothness: Commonly used in level set implementations, the smoothness term penalizes the Euclidean arc length of the contour. We use the same definition as (28) in [5] for both endocardium and epicardium segmentation. e) Thickness term: Because the endocardium is easier to segment than the epicardium, we use the endocardial contour to refine the epicardial contour by penalizing the variations of the myocardium thickness. Unlike [6], we assign each pixel a weight when estimating the myocardium thickness. This is based on the assumption that we are more confident in regions with strong edges. Specifically, we first generate a signed distance (to the endocardial contour, negative outside) map Dendo (x, y), and we define an edge map as: (10) f (x, y) = |∇Gσ ∗ u(x, y)|.
(a) (b) (c) Fig. 2. (a) Comparison of the ellipse fitting methods of [6] (yellow) and ours (blue); (b) the shape prior force in [6]; (c) our shape prior force. To compare the two shape prior forces, the same ellipse was used as the shape prior. ellipse fitting method, in which each pixel is weighted according to its distance to the convex hull of the evolving contour: the closer to the convex hull, the higher the wight. Depending on how the weights are assigned, our weighted ellipse fitting method has the flexibility of acting like the method in either [5] or [6]. For the epicardial contour, all points along C2 are equally weighted in the ellipse estimation, because there is no presence of papillary muscles. In order to make the contour resemble an ellipse, the shape prior term in [5] and [6] penalizes the squared distance between the current contour and the estimated contour. As shown in Fig. 2 (b), such a shape prior term generates forces that push the contour towards the nearest boundary of the prior shape. Consequently, in the case where the nearest boundary is located at the inner side of the contour, this force will cause the contour to erode (see Fig. 2 (b)). In this work, we introduce a new shape prior term that generates forces in desirable directions. To formulate this term, we first compute a signed distance map DkE to define the shape prior forces in different regions: � �n |dk (x, y)| E Dk (x, y) = sign (dk (x, y)) , (8) W
The myocardium thickness is then estimated by:
f (x, y)|Dendo (x, y)|δ� (φ2 )dxdy
m= Ω , f (x, y)δ� (φ2 )dxdy Ω
where δ� (φ) is the regularized Dirac function. Finally, we replace dk in (8) by (Dendo + m) to define the thickness force DT , and use the same form as (9) to incorporate the thickness constraint into the energy functional. 2.2. Energy Minimization To minimize the energy functionals, φ1 and φ2 are updated according to the gradient descent rule as:
where dk (x, y) is the signed (negative outside) distance to the corresponding shape prior, W is a constant that controls the effective region of the shape prior term, and n controls the sensitivity of the penalty to different distances. When n = 0, all the mismatched pixels are equally penalized as in [7]; when n � 1, the pixels outside/inside the band with a bandwidth of W are strongly/hardly penalized, and the shape prior term becomes a hard constraint. Then we penalize the sum of this force in the mismatched regions: �
Jkc (φk )
=
Ω
� � DkE H(DkE ) − H(φk ) dxdy,
(11)
� � � ∇φ1 ∂φ1 = λ1a (M2−M1 )+λ1c D1E−div (λ1b Υ+λ1d ) · δ� (φ1 ) ∂t |∇φ1 | � � � ∇φ2 ∂φ2 = λ2a (M3−M2 )+λ2c D2E+λ2e DT −λ2d div δ� (φ2 ), ∂t |∇φ2 |
where Mi = − ln p(u|Ωi ) and Υ is given by (7). Both endocardial and epicardial contours evolve simultaneously, i.e., in each iteration, we first fix φ2 and update φ1 , then update φ2 with φ1 fixed. Similar as in [5, 6], the weights balancing different terms are adjusted by an annealing algorithm. After 100 iterations, the weights remain fixed to ensure convergence.
(9)
where H(φ) is the Heaviside function. As shown in Fig. 2 (c), the force derived from this novel shape prior tends to dilate the contour if it is inside the estimated ellipse and vice versa. For endocardium segmentation, penalizing both the interior and exterior of the ellipse prior like [5] and [6] may cause the contour to collapse when there is not enough overlap between the estimated ellipse and the LV cavity. To solve this
3. EXPERIMENTAL RESULTS We tested our segmentation method on 65 short-axis cardiac images comprising of 20 CT images from 5 patients, 20 perfusion MR images from 5 patients and 25 cine MR images
27
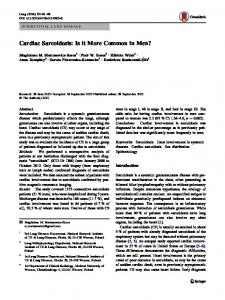
Fig. 3. Comparison of segmentation results obtained by [5] (left), [6] (middle) and our framework (right). from 5 patients. The CT images were acquired by Siemens Sensation 16/64-Slice CT scanners, and the MR images by Siemens 1.5T MRI scanners. In our experiments, pixel intensities in each image were linearly normalized to [0-255], and we used the same parameter settings for all three different types of images, which indicates that our method has good robustness and generalizability. To evaluate the accuracy of our segmentation method against the manual segmentation, we calculated the True Positive (TP), True Negative (TN), and False Positive (FP) and area similarity Sarea for the myocardium, following the same definitions as used in [6]. The TP-TN-FP and Sarea values are summarized in Table 1. As shown, the mean values of the above metrics are similar to those reported in [6]. Data sets CT Pefusion MR Cine MR
FP(%) 14.2 15.4 17.3
TN(%) 8.7 10.6 10.0
TP(%) 91.3 89.4 90.0
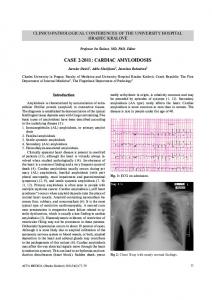
Fig. 4. Experimental results of CT (the 1st row), Perfusion MR (the 2nd row) and cine MR (the 3rd row) images. term, the papillary muscles are successfully separated from the myocardium, see the third column in Fig.4. 4. CONCLUSION This paper presents a semi-automated framework for segmentation of short-axis cardiac images. The proposed framework uses different energy functionals for endocardium and epicardium segmentation to account for their respective characteristics, by incorporating a dual-background intensity model, a novel shape prior term, and a weighted method for estimating the myocardium thickness. Our experimental results on both CT and MR images have demonstrated that our method is effective and robust even in difficult images.
Sarea (%) 89.3 ± 6.0 87.4 ± 5.7 87.2 ± 5.2
Table 1. Summary of mean TP-TN-FP and Sarea values.
5. REFERENCES
To demonstrate the robustness and effectiveness of our method, we compare in Fig. 3 the segmentation results of a cardiac CT image obtained by using the methods in [5], [6] and our framework. As shown in the left image in Fig. 3, the epicardial contour detected by [5] leaks to the RV due to lack of local contrast. The leaking problem is alleviated by using the non-parametric model and the contour interaction term [6] (see the middle image in Fig. 3). However, the epicardial contour between the myocardium and the RV is still not accurate. Moreover, the endocardial contour incorrectly converged to a local minima because the contour interaction affects both endocardium and epicardium. By using distinct energy functionals and integrating a dual-background intensity model, novel shape prior terms, and an improved thickness constraint, our framework generated more accurate myocardial boundaries as shown in the right image in Fig. 3. Fig.4 displays the segmentation results of another 12 CT, perfusion MR and cine MR images. As shown, despite that the images are noisy (the first column) or the contrast between the RV and the myocardium is poor (the second column), the LV myocardium are reliably detected with good accuracy thanks to the use of the dual-background intensity model and the thickness constraint term. By using our novel shape prior
[1] M. Kass, A. Witkin, and D. Terzopoulos, “Snakes: Active contour models,” IJCV, vol. 1, no. 4, pp. 321 – 331, 1988. [2] C. Xu and J.L. Prince, “Snakes, shapes, and gradient vector flow,” IEEE Trans. Image Processing, vol. 7, no. 3, pp. 359 – 369, Mar. 1998. [3] T.F. Chan and L.A. Vese, “Active contours without edges,” IEEE Trans. Image Processing, vol. 10, no. 2, pp. 266 – 277, Feb. 2001. [4] N. Paragios, “A level set approach for shape-driven segmentation and tracking of the left ventricle,” IEEE Trans. Medical Imaging, vol. 22, no. 6, pp. 773 – 776, June 2003. [5] C. Pluempitiwiriyawej, J.M.F. Moura, Y.-J. L. Wu, and C. Ho, “STACS: New active contour scheme for cardiac MR image segmentation,” IEEE Trans. Medical Imaging, vol. 24, no. 5, pp. 593 – 603, May 2005. [6] T. Chen, J. Babb, P. Kellman, L. Axel, and D. Kim, “Semiautomated segmentation of myocardial contours for fast strain analysis in cine displacement-encoded MRI,” IEEE Trans. Medical Imaging, vol. 27, no. 8, pp. 1084 – 1094, Aug. 2008. [7] T. Chan and W. Zhu, “Level set based shape prior segmentation,” in Proc. CVPR, June 2005, vol. 2, pp. 1164 – 1170.
28