Ndung’u and Tjandrasa— Improved Stroke Detection at Early Stages Using Haar Wavelets and Laplacian Pyramid
IMPROVED STROKE DETECTION AT EARLY STAGES USING HAAR WAVELETS AND LAPLACIAN PYRAMID Michael N. Ndung’u1), Handayani Tjandrasa2) 1, 2)
Department of Informatics Engineering, Institut Teknologi Sepuluh Nopember Kampus ITS Sukolilo, 60111, Surabaya e-mail:
[email protected]),
[email protected])
ABSTRAK Stroke merupakan pembunuh nomor tiga di dunia, namun hanya sedikit metode tentang deteksi dini. Oleh karena itu dibutuhkan metode untuk mendeteksi hal tersebut. Penelitian ini mengusulkan sebuah metode gabungan untuk mendeteksi dua jenis stroke secara simultan. Haar wavelets untuk mendeteksi stroke hemoragik dan Laplacian pyramid untuk mendeteksi stroke iskemik. Tahapan dalam penelitian ini terdiri dari pra proses tahap 1 dan 2, Haar wavelets, Laplacian pyramid, dan perbaikan kualitas citra. Pra proses adalah menghilangkan bagian tulang tengkorak, reduksi derau, perbaikan kontras, dan menghilangkan bagian selain citra otak. Kemudian dilakukan perbaikan citra. Selanjutnya Haar wavelet digunakan untuk ekstraksi daerah hemoragik sedangkan Laplacian pyramid untuk ekstraksi daerah iskemik. Tahapan terakhir adalah menghitung fitur Grey Level Cooccurrence Matrix (GLCM) sebagai fitur untuk proses klasifikasi. Hasil visualisasi diproses lanjut untuk ekstrasi fitur menggunakan GLCM dengan 12 fitur dan kemudian GLCM dengan 4 fitur. Untuk proses klasifikasi digunakan SVM dan KNN, sedangkan pengukuran performa menggunakan akurasi. Jumlah data hemoragik dan iskemik adalah 45 citra yang dibagi menjadi 2 bagian, 28 citra untuk pengujian dan 17 citra untuk pelatihan. Hasil akhir menunjukkan akurasi tertinggi yang dicapai menggunakan SVM adalah 82% dan KNN adalah 88%. Kata Kunci: Combined-enhancement, Haar-Wavelets, Hemoragik, Iskemik dan Laplacian-Pyramid.
ABSTRACT Stroke is the third leading killer disease in the world, this is due to few methods’ ability to detect it at early stages. This research proposes an improved unified method to detect the two types of strokes simultaneously. Haar wavelets for detection of hemorrhagic stroke and Laplacian Pyramid for detection of ischemic stroke. The main steps involved are: preprocessing phase 1 and phase 2 for skull bone removal, noise reduction, contrast enhancement as well as elimination of all elements outside the intracranial region. The image is then taken through enhancing using combined enhancement methods intensity, contrast and pixel modification. After this, Haar wavelets transforms are applied to extract the hemorrhagic region while Laplacian pyramid is applied to extract the Ischemic region for visual output. The result from visual output is further taken through feature extraction using 12-GLCM and 4-GLCM features respectively. These features are used for classification analysis with SVM and KNN classifiers after which quantitative analysis is done using accuracy. A total number of 45 brain slices of both ischemic and hemorrhagic stroke were used as data, with 28 for testing and 17 for training. The system final result achieved a highest classification accuracy of 82% and 88% with SVM and KNN classifiers respectively. Keywords: Combined-enhancement, Haar-Wavelets Hemorrhagic, Ischemic and LaplacianPyramid I. INTRODUCTION
S
TROKE,
also known as cerebrovascular attack (CVA) is a disease which affects vessels that supply blood to the brain. The stroke occurs when a blood vessel either bursts or when there is a blockage of the blood vessel. Due to loss of oxygen, nerve cells in the affected brain area are not able to perform basic functions. This eventually leads to the death of the brain tissue. Strokes are mainly
37
JUTI - Volume 12, Number 2, July 2014: 37 – 47
classified into two categories: Ischemic stroke or infarct (caused by blood clotting) appears as a dark region (hypo dense) well contrasted against its surrounds. It accounts for about 80% of all strokes. Hemorrhagic stroke (caused by bleeding inside the brain) appears as a bright region (hyper dense) well contrasted against its surroundings. It accounts for 10–30% all strokes [1]. Due to their difference in nature of occurrence and cause these two types have different symptoms and also require opposite treatments. Stroke is the third leading cause of death in most industrialized countries after heart disease and cancer. Its detection in the early stages is difficult, a result of which out of 15 million people infected with stroke, 5 million die while another 5 million are permanently disabled [2]. This shows that an early and rapid diagnosis of stroke is critical for proper treatment of the patients. Several methods in the past have been proposed for early detection of different types of stroke. In 2007, [3] Chan proposed a computer aided detection system that improves diagnostic accuracy of small acute intracranial hemorrhage (AIH) on brain CT. The method segmented the intracranial contents by thresholding and morphological operations, and then used denoising and adjustment for CT cupping artifacts. After this, it realigned the brain automatically into normal position before extracting the AIH candidates using top-hat transformation and left–right asymmetry. Two years later [4] Cawla proposed another approach for automatic detection and classification of stroke from brain CT images. This method detected and classified an abnormality into ischemic (either acute or chronic), and hemorrhagic CT brain-image-slices. This was done with image enhancement, detection of mid-line symmetry and classification of abnormal slices. A windowing operation was performed on the intensity distribution to enhance the region of interest. In 2011, [5] Tang proposed a computeraided detection (CAD) scheme for early detection of ischemic stroke with small lesions using image feature characteristics. This used Circular Adaptive Region of Interest (CAROI) method to analyze the Computed Tomography (CT) images of the brain. The result obtained indicated significant improvement in sensitivity and specificity when using CAD. In 2013, [2] Rajini proposed an approach for automated detection of ischemic stroke using segmentation, midline shift and image feature characteristics, to separate the ischemic stroke region from healthy tissues in computed tomography (CT) images. The method for early detection of ischemic stroke demonstrated improved efficiency and accuracy of clinical practice. Our Improved stroke detection at early stages method combines Haar wavelets and Laplacian pyramid, together with four combined-enhancement methods to simultaneously identify and extract both hemorrhage and ischemic strokes at their early stages in an image. The extracted stroke region is evaluated using texture feature analysis with GLCM and later classified. This method helps improve the accuracy of identification of the stroke region and facilitates improved clinical diagnosis of both ischemic and hemorrhagic strokes simultaneously. Unlike most methods, which can only for detecting one type of stroke, it does not rely on the midline shift to identify the stroke region. II. DATA The evaluation involves the training and testing of data in form of brain scan slices of CT and MRI images. The data used is obtained from brain images of 25 patients all suffering either from ischemic or hemorrhagic stroke, all obtained from http://www.strokecenter.org/radiology and http://www.med.harvard.edu/aanlib/home.html. Although a single CT scan session can yield up to 20 slices per person, we use selected slices, and since not all scan slices exhibit characteristics of early onsets of stroke, only a total of 45 brain scan slices are used. Of these, 28 are used for training and 17 for testing. The images are all resized to a standard dimension of 256 x 256 for processing efficiency. III. METHODOLOGY Our method is implemented in a Matlab R2012a environment. It is divided into 5 main steps: First there is preprocessing (phase 1 and 2) for removal of skull brain region and irrelevant elements not
38
Ndung’u and Tjandrasa— Improved Stroke Detection at Early Stages Using Haar Wavelets and Laplacian Pyramid
within the intracranial region. The Second step is the combined-enhancement process. Here, a user can choose all or several of the enhancement methods to be applied on the image. Third is the application of Haar wavelets and Laplacian pyramid for the detection of the hemorrhagic stroke and ischemic stroke regions. After the detection, the fourth step involves extraction and analysis of features from the images using GLCM. Finally, the extracted features are classified using SVM and KNN classifiers. A. Preprocessing This stage is divided into two phases. Phase 1 is made up of three main steps: First step is thresholding of the input image and converting it into grayscale and then to binary image. This is followed by skull bone removal using morphological processes or erosion. And finally we apply image de-noising and contrast enhancement. The Phase 2 is also made up of three main steps which remove all elements outside the intracranial region: The first step is thresholding of the image once more and converting the image to a binary image, followed by filling in the holes in the threshold image. Secondly, we use connected component labeling to pick out parts relevant for processing and the final step is creating the image mask and applying it to image result of phase 1 to filter out the unwanted parts. B. Combined-enhancement processing On completion of the preprocessing and skull bone removal phases, we used enhancement methods to improve the image pixel information and quality. These help to bring out specific features of an image for effective visual output analysis as well as feature extraction for classification. In application, the combined enhancement processing is based on four enhancement methods: quantization with 128 bins, median filtering, mean filtering and sharpening. Each of the enhancement methods creates an effect on an image based on specific characteristics of the method this is either in edge enhancement, noise filtering, contrast and intensity enhancement as well as the pixel detail or information modification. C. Quantization with 128 bins Quantization in image processing refers to compressing a range of values to a specific (mainly single) quantum value. We use quantization here because of its ability to help determining the number of grey levels in a digitized image. After quantization, the sampled image is expressed as a digital value known as bins or quantization level. According to [6] it is always advisable to use quantization levels that are high enough for human perception of fine shading details in the image. This is in order to avoid occurrence of false contours, which happens when the number of brightness levels is lower than that which humans can easily distinguish. For this reason we use 128 bins so that the resulting image can also be used with the other subsequent methods. D. Median filter Median filtering is a nonlinear process commonly used in reducing impulsive, or salt-and-pepper type of noise in an image. In addition to reduce salt and pepper noise, [6] notes that it is also useful in preserving edges in an image while reducing random noise. In a median filter, a window slides along the image, and the median intensity value of the pixels within the window becomes the output intensity of the pixel being processed. E. Averaging filter or mean filter Mean filter, or average filter is a windowed filter of linear class that is used to smoothen images. The filter works as low-pass and replaces each pixel value in an image with the mean value of its neighbors, including itself. This in turn results in the elimination of pixel values which are unrepresentative of their surroundings [6]. Being based on a kernel, there are two options for use; the 3x3 kernel or 5x5 kernel. The 3x3 kernel is the commonly used one while the 5x5 kernel is used when there is need for sharp smoothening. In this case we use the 3x3 kernel.
39
JUTI - Volume 12, Number 2, July 2014: 37 – 47
F. Sharpening Human perception is highly sensitive to edges and fine details of an image. These details are primarily composed by high frequency components of which if completely removed or weakened, the visual quality of an image becomes degraded. On the contrary, enhancing the high-frequency components of an image leads to an improvement in the visual quality. We apply Image sharpening to highlight the edges and fine details in an image. It also helps in increasing the local contrast. G. Haar wavelets The Discrete Wavelet Transform uses the Haar functions in image coding, edge extraction and binary logic design to make one of the most promising techniques today. The non–sinusoidal Haar transform is the complete unitary transform. It is local, thus can be used for data compression of non– stationary signals. The digital images may be treated as signals. In [7] the signals in Haar wavelets are discrete signals expressed as f = (f1 , f2. . . fN) where N is a positive integer which represents the length of f. The values of f are the N real numbers f1, f2, . . . , fN. These values are typically measured values of an analog signal g, measured at the time values t = t1, t2, . . . , tN. That is, the values of f are = g (t ), = g (t ) … = g (t ) (1) Like all wavelet transforms, the Haar transform decomposes a discrete signal into two subsignals of half its length. One subsignal is a running average or trend; the other subsignal is a running difference or fluctuation [7]. The first trend sub-signal, a1 = (a1, a2. . . . aN/2), for the signal f is computed by taking a running average. Its first value, a1, is computed by taking the average of the first pair of values of f: (f1 + f2)/2, and then multiplying it by √2. That is, a1= (f1 +f2)/√2. Similarly the next value of a2 is computed by taking the average of the next pair of values of f and multiplying it by √2. The formula for the values of a1 is:
=
√
(2)
For m = 1, 2, 3….N/2 For instance, if f has 8 values f = (1, 3, 6, 4, 5, 3, 2, 8) then the first trend sub-signal a1 = (2√2, 5√2, 4√2, 5√2). The other sub-signal, first fluctuation of the signal f is denoted by d1 = (d1 , d2…dN/2). It is computed by taking the running difference. Whereby, its first value, d1, is calculated by taking half the difference of the first pair of values of f: (f1−f2)/2, and multiplying it by √2, and similarly the next pair. The formula used is:
=
√
(3)
After obtaining the sub-signals, the signal is taken through transformation, which involves the conservation and compaction of the signal’s energy. For better visual results of the hemorrhagic region, we reduce the intensity of the gray matter by subtracting the mean of the gray matter in the image. This is done before processing with Haar wavelets. It serves the need of the stage well since intensity is our main concern compared to other features; as the point of interest is the hemorrhages (homogeneous intensity region). In this stage, the image is decomposed two times using Haar wavelet transforms and the signal reconstructed. Where the decomposition automatically enhances the intensity of the bright region.
40
Ndung’u and Tjandrasa— Improved Stroke Detection at Early Stages Using Haar Wavelets and Laplacian Pyramid
H. Laplacian pyramid Different scenes are made up of objects of varying sizes, where these objects can also contain features of various sizes. In relation to this, an analysis procedure applied only at a single scale may miss information at other scales. The better option is carrying out analyses at all scales simultaneously. Andelson notes that the task of detecting a target pattern that may appear at any scale can be done in two main ways [8]: Constructing several copies of the pattern at increasing scales, then convolving each copy with the image, or convolving a pattern of fixed size with several copies of the image represented at correspondingly reduced resolutions. An image pyramid is a data structure designed to support efficient scaled convolution through reduced image representation. It consists of a sequence of copies of an original image in which both sample density and resolution are decreased in regular steps. These reduced resolution levels of the pyramid are themselves obtained through a highly efficient iterative algorithm [8]. The bottom or zero level of the pyramid, G0, is equal to the original image. This is lowpass-filtered and subsampled by a factor of two to obtain the next pyramid level, G1. G1 is then filtered in the same way and subsampled to obtain G2.
The levels of the pyramid are obtained iteratively using: ( , ) ( , )∑ ∑ (2 + . 2 + ) (4) This is known as a low-pass or reduce operation and is written as Gl = REDUCE [G l, 1], where w(m,n) is the generated kernel. To construct convolutions at increasing scales or band-pass which expands an image, interpolation is done by reversing the reduced operation. This gives the EXPAND operation, written as Ll = Gl – EXPAND [Gl+1].
It is represented as Gl, 0= Gl, and for k > 0 using: where k is the number of times for expansion ,
(. )=4 ∑
∑
,
,
(5)
The expand operation doubles the size of the image with each iteration. So that Gl,0, is the size of Gl,1, and Gl,1 is the same size as that of the original image. With an expansion at 5 scales, the first two scales give back an image with high noise content, the image at the third scale does not have much noise but it is not clear. Image at scale 4 gives the optimal result where the pixel enhancement does not have noise and is not over enhanced. At scale 5, the pixels of the image are over enhanced thus distorting the edges visibility. It is due to this ability to extract the edge information of the original image at the various scales, that we use Laplacian Pyramid for the extraction or detection of the ischemic hypodense area. Whereby, since the preferred features are stroke sensitive parts of the brain, these parts will be enhanced by proper modification of decomposition coefficients. I. Gray Level Co-occurrence Matrix The Gray Level Co-occurrence Matrix, one of the common statistical methods, is used to analyse the texture of images. It is obtained from the image by estimating the pair wise statistics of pixel intensity [9]. This matrix contains the probability value of two pixels with gray-level intensity and gray-level intensity, respectively. The two are separated by distance and direction θ. The matrix is written as P ( , , , θ). We use GLCM to detect 12 features over four directions (horizontal, vertical, and two diagonals) which are 00, 450, 900 and 1350 respectively. A second evaluation is done using 4 features to evaluate which set of features gives the best result. Therefore, for 12 features, a total of 48 feature values is returned, while 16 features values are returned in the case of 4 features used.
41
JUTI - Volume 12, Number 2, July 2014: 37 – 47
Since GLCM is a second order statistics measurement, it considers the relationship between groups of two (usually neighboring) pixels in the original image and stores the information of spatial relationship of image pixels [9]. Various useful textural parameters, ranging between 18 and 22 in total, can be used to evaluate and highlight details about an image. The higher the number of parameters and textural properties calculated, the higher the reliability and accuracy rates are likely to be. This is however dependent on the features to be extracted and the method of extraction used, whether the use of the co-occurrence matrix, sum and difference of the histograms or sum and difference of the image [10]. Though the use of many parameters is likely to give an improved performance, the calculation of GLCM is computationally intensive and time consuming [11]. In addition, some of the parameters are interdependent while others are closely related. In some cases the output of one parameter can influence that of another, or be used to predict the output of another. For instance, homogeneity is inversely related to inverse difference motion (IDM), while directly related to energy and angular second moment. A high entropy also indicates low homogeneity which in turn indicates low energy as well as high variance. Based on these, we use 4 features, which are considered to be able to represent most of the other parameters [11] while comparing them with 12 features to evaluate the performance on accuracy results. The following GLCM features are extracted in this paper, for the 12 features: contrast, correlation, cluster shade, cluster prominence, dissimilarity, energy, entropy, homogeneity, sum of squares or variance, difference entropy, difference in variance and inverse difference moment (IDM). For the 4 features: homogeneity, energy, entropy, correlation. The 12 features use sum and difference of histograms and of sum of difference of images, while the 4 features use the matrix. J. Test scenarios To evaluate the best set of methods for enhancement and processing of the images, we divided the test scenarios into three modes. The result in terms of accuracy from each of the modes will indicate the performance of each combination set. These modes are: mode 0, mode 1 and mode 2. Mode 0: represents a set combination of preprocessing (phase 1 and 2) and the four enhancement methods. This is without the inclusion of either Haar wavelets or Laplacian pyramid. Mode 1: represents the set combination of mode 0 in addition to Haar wavelets, without the inclusion of Laplacian pyramid. Mode 2: represents the set combination of Mode 0 in addition to Laplacian pyramid, without the inclusion of Haar wavelets. The evaluation is done by testing Haar wavelets and Laplacian pyramid with each enhancement method individually, and then as a group to read the performance accuracy. For example, mode 1 could have a combination set of Haar wavelets and quantization with 128 bins and median filter. The performance accuracy of this combination in detecting the stroke region will be recorded and then compared to other combination sets. Each mode has 31 combinations which are tested individually to evaluate the effect on classification accuracy as well as enhancement of the image output. The combinations are later iterated twice; first iteration with Haar wavelets as the method of focus, with subtraction of graymatter intensity and the second time with Laplacian Pyramid as the method of focus without subtraction of gray-matter intensity. This gives a total number of 192 iterations (i.e. 31 x 3 x 2). The main reason for the separation of the iterations is because Haar wavelet transforms in this experience relies on reduction of the gray matter intensity using subtraction of the background mean to enhance the intensity of the hemorrhagic region. IV. RESULT AND DISCUSSION For testing purposes, an image is taken through preprocessing and the various combined
42
Ndung’u and Tjandrasa— Improved Stroke Detection at Early Stages Using Haar Wavelets and Laplacian Pyramid
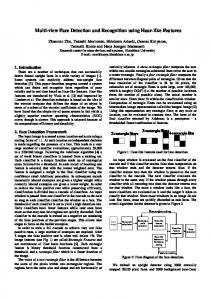
(a)
(b) Fig.1 A sample illustration of preprocessing stage (phase 1 and 2)
(c)
enhancement methods before being processed with Haar wavelets and Laplacian pyramid. After processing with the Laplacian pyramid and Haar wavelets, extraction of features from the resulting image is done using GLCM. Which are used in return for training data, for classification and evaluation of accuracy. The preprocessing phase is divided into two phases: the first phase deals with removal of the skull bone coupled with noise filtering and contrast enhancement. However on some images the result of preprocess phase 1 has some unconnected parts. Phase 2 is introduced using connected components function, and thresholding to remove the unnecessary parts and further enhance the image. Apart from visual effects, the classification shows some improvements in accuracy as a result of the use of preprocess 2. Fig.1 illustrates a sample image after being taken through the preprocessing phases (a) Original image (b) after pre-processing 1 (c) after pre-processing 2. The Combined enhancement methods, may appear to have negligible effect on the visualization output or on the classification results when evaluated individually. However, when combined, they have a significant effect on the results of an image. The main methods; Laplacian pyramid and Haar wavelets, perform well on their own with their classification achieving results above 50 % accuracy. However, on being combined with the various enhancement methods, the performance of both
Fig.2 A sample of a hemorrhagic image (a) original image (b) after Haar wavelets transform.
43
JUTI - Volume 12, Number 2, July 2014: 37 – 47
Fig.3 A sample of Ischemic stroke (a) original image (b) after processing with Laplacian pyramid increased. The notable highest accuracy in classification for both Laplacian pyramid and Haar wavelets is obtained from a combination with quantization with 128 bins, and averaging filter, which achieved an accuracy of 88% with KNN classifier, using 4 GLCM features as shown in Table I. The SVM classifier showed a constant accuracy of 82% with various combinations, with both 12 GLCM as shown in Table II and 4 GLCM features as shown Table III. Haar wavelets achieves good performance on both the visual analysis and classification analysis. Subtraction of the gray matter intensity when using Haar wavelets, works to improve the visual output. However, when it comes to classification, the image without gray matter intensity subtracted gave a higher performance accuracy. With subtraction of gray matter intensity, Haar wavelets achieved a highest accuracy of 71% on SVM and 65 % with KNN when tested both with 12 GLCM and 4 GLCM features. However, without subtraction of gray intensity matter, there is a significant observable change, the accuracy of SVM remains constant at 71% while that of KNN improves to 76 % with both 12 and 4 GLCM features. Fig. 2 shows an illustration of detection of the hemorrhagic stroke using Haar wavelets, this is shown by the conspicuous bright region compared to its dark surrounding in the second image. The same effect is observed on Laplacian pyramid. Since Laplacian pyramid concentrates on the dark intensity of the ischemic stroke region compared to its surrounding gray matter, subtracting the intensity of the brighter gray matter only works to the disadvantage of Laplacian Pyramid. With subtraction of gray matter intensity, the enhanced scale-4 image output is not satisfactory. However there is an improvement in the image output without the subtraction of gray matter intensity. On the classification analysis, with subtraction of gray matter, Laplacian pyramid: without combination of the enhancement methods, achieved a highest classification accuracy of 59 % for KNN and 76% for SVM with both 12 and 4 GLCM features. However, without subtraction of the gray matter intensity, classification accuracy with KNN improved significantly to 76% for KNN with both 12 and 4 GLCM features. The highest accuracy of SVM classifier however dropped from 76% to 71% with both 12 and 4 GLCM features. Fig. 3 illustrates a scale-4 enhanced image with Laplacian pyramid showing an ischemic region the dark region on the slightly upper left side and the right side of the second image.
44
Ndung’u and Tjandrasa— Improved Stroke Detection at Early Stages Using Haar Wavelets and Laplacian Pyramid
Table. I KNN table for classification accuracy with 4-GLCM. Mode
Mode 0
Mode 1
Mode 2
With gray matter
Without gray matter
intensity subtraction
intensity subtraction
Highest accuracy
0.82
0.71
Lowest accuracy
0.47
0.41
Difference
0.35
0.30
Highest accuracy
0.82
0.88
Lowest accuracy
0.47
0.59
Difference
0.35
0.29
Highest accuracy
0.71
0.88
Lowest accuracy
0.47
0.59
Difference
0.25
0.29
A. GLCM feature extraction and classification With the results obtained from the test scenarios, the 4-GLCM feature extraction provides higher classification results as compared to 12-GLCM feature extraction. This could be attributed to the fact that within the 12 GLCM features, some of the features are strongly correlated and interdependent, this makes the overall classification error to vary based on changes of the correlated features as each feature is evaluated across the interspacing distance of the four directions. On the other hand, the classification error of 4-GLCM feature extraction reduces as the image features are evaluated in various distances of the four directions. This can be attributed to the fact that though the four Table. II SVM table for classification accuracy with 12-GLCM Mode
Mode 0
Mode 1
Mode 2
With gray matter
Without gray matter intensity
intensity subtraction
subtraction
Highest accuracy
0.76
0.76
Lowest accuracy
0.53
0.53
Difference
0.23
0.23
Highest accuracy
0.76
0.82
Lowest accuracy
0.53
0.53
Difference
0.23
0.24
Highest accuracy
0.65
0.82
Lowest accuracy
0.47
0.53
Difference
0.18
0.29
45
JUTI - Volume 12, Number 2, July 2014: 37 – 47
Table. III SVM table for classification accuracy with 4-GLCM. Mode
Mode 0
Mode 1
Mode 2
With gray matter
Without gray matter intensity
intensity subtraction
subtraction
Highest accuracy
0.82
0.71
Lowest accuracy
0.59
0.53
Difference
0.23
o.18
Highest accuracy
0.82
0.82
Lowest accuracy
0.59
0.65
Difference
0.23
0.17
Highest accuracy
0.82
0.82
Lowest accuracy
0.59
0.65
Difference
0.23
0.17
parameters are minimally correlated, each is largely independent in evaluating different features in an image. In such case, the classification accuracy increases with increase in the interspacing distance. Though the result and evaluation may be case specific in different experiments, depending on what features are being tested, this research indicates that the 4-GLCM feature extraction gives an improved classification accuracy. B. SVM and KNN The SVM classifier depicts a stable performance, giving an overall high and better result as compared to KNN classifier. This is shown in its highest rates of accuracies as well as its lowest rates of accuracies. It achieves a highest accuracy of 82% and a lowest of 47 % across the classification results, as shown in Tables II and III. Even though KNN achieves the highest accuracy of 88%, its performance is not stable, it varies across the evaluation with a lowest accuracy of 35% as shown in Tables I and IV. V. CONCLUSION This research deals with improved detection of stroke at early stages using Haar wavelets and Laplacian pyramids. The research’s main aim was identifying a stroke region in a brain scan image. Making use of Laplacian pyramid and Haar wavelets transform together with combined enhancement methods, the method was able to capitalize on different features in an image. Since it possesses different processing approaches, the method is able to detect both hemorrhagic and or ischemic strokes in an image. From the experiment result, the Haar wavelet function proved to be very successful in identification of hemorrhagic types of strokes, both on the visualization output and classification analysis. As of Laplacian pyramid, results were slightly below satisfactory level. Being based on pixel enhancement to capture image details at different scales, the visual output for the optimal scale 4 used in this experiment showed blurred result which reduced the visual output clarity. However, on the classification analysis it appears to achieve high accuracies when tested. This leads us to conclude that computers infer pixel information differently from human perception; where though blurred, the image was classified accurately. On GLCM performance, the 4 features; homogeneity, contrast, energy and entropy recorded a high
46
Ndung’u and Tjandrasa— Improved Stroke Detection at Early Stages Using Haar Wavelets and Laplacian Pyramid
Table. IV KNN table for classification accuracy with 12-GLCM. Mode
Mode 0
Mode 1
Mode 2
With gray matter
Without gray matter intensity
intensity subtraction
subtraction
Highest accuracy
0.76
0.65
Lowest accuracy
0.35
0.41
Difference
0.41
0.24
Highest accuracy
0.76
0.76
Lowest accuracy
0.35
0.53
Difference
0.41
0.23
Highest accuracy
0.71
0.76
Lowest accuracy
0.41
0.53
Difference
0.30
0.23
performance compared to their twelve counterpart features used in all the modes and test scenarios. This leads to the conclusion that it is more efficient to use the four features, though the opposite could also be true based on the case in study and what features need to be extracted. Finally, use of Haar wavelets and Laplacian pyramid together with combined enhancements proved successful in detecting stroke at early stages. The Haar wavelets indicated a high performance especially on visual output, with several cases indicating potential in detecting ischemic stroke. The accuracy results of our method are satisfactory at this level, though other previous methods have higher accuracy records, our method may not be directly compared to them. This is because unlike the other methods of stroke detection, our method deals with (1) detection of stroke at early stages, and (2) detection of both hemorrhagic and ischemic strokes simultaneously. The previous methods only deal with one type of stroke (either hemorrhagic or ischemic). REFERENCES [1] I. Rekik, S. Allassonnière, T. K. Carpenter and J. M. Wardlaw, "Medical image analysis methods in MR/CT-imaged acutesubacute ischemic stroke lesion: Segmentation, prediction and insights into dynamic evolution simulation models. A critical appraisal," NeuroImage: Clinical, p. 164 –178, 2012. [2] N. H. Rajini and R.Bhavani, "Computer Aided Detection of Ischemic Stroke using Segmentation and Texture Features," Measurement, vol. 46, p. 1865–1874, 2013. [3] T. Chan, "Computer Aided Detection of Small Acute Intracranial Hemorrhage on Computer Tomography of Brain," Computerized Medical Imaging and Graphics, vol. 31, p. 285–298, 2007. [4] M. Chawla, S. Sharma, J. Sivaswamy and K. L.T, "A method for automatic detection and classification of stroke from brain CT images," in 31st Annual International Conference of the IEEE EMBS, Minneapolis, Minnesota, USA,, 2009. [5] F.-h. Tang, D. K. Ng and D. H. Chow, "An image feature approach for computer-aided detection of ischemic stroke," Computers in Biology and Medicine, vol. 41, p. 529–536, 2011. [6] L. G. Shapiro and G. C. Stockman, "Filtering and Enhancing Images," in Computer Vision , New Jersey, Prentice Hall , 2001, pp. 1-57. [7] J. S. Walker, "Haar Wavelets," in A Primer on Wavelets and Their Scientific Application , Chapman and Hall/CRC press , 1996, pp. 1-28. [8] E. H. Adelson, C. H. Anderson, J. R. Bergen, P. J. Burt and J. M. Ogden, "Pyramid methods in image processing," RCA Engineer , vol. 29, no. 6 , pp. 1-9, 1984. [9] R. M. Haralick, K. Shanmugman and I. Dinstein, "Textural Features For Image Classification," in IEEE Transactions on Systems, Man and Cybernetics, 1973. [10] F. Albregtsen, "Statistical Texture Measures Computed from Gray Level Coocurrence Matrices," November 5, 2008. [11] H. Hebbar, S. Mushigeri and N. U.C., "Medical Image Retrieval - Performance Comparison using Texture Features," International Journal of Engineering Research and Development, vol. 9, no. 9 , pp. 30-34, 2014.
47