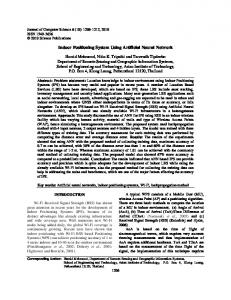
Improved VLC-Based Indoor Positioning System Using a Regression Approach with Conventional RSS Techniques Sherine Shawky, Mohamed A. El-Shimy, Ziad A. El-Sahn, Mohamed R M Rizk Electrical Engineering Department Faculty of Engineering, Alexandria University, Egypt Alexandria, Egypt
[email protected],
[email protected],
[email protected],
[email protected] Abstract – There is a recent interest to develop an indoor positioning system using visible light communications technology. Based on received signal strength (RSS), this paper combines a simple regression-based approach with linear and nonlinear least square estimations (LLS & NLS). The performance of regression approach is evaluated by different metrics such as the average, standard deviation, and cumulative distribution function of the localization error. In the system analysis, first reflection from plaster walls (high reflectivity 0.8), thermal noise, and shot noise are considered. The simulation results show that almost all the room (99.4%) has error less than 0.6 m by using regression approach instead of (72.19%) by using the classical approaches. The maximum error decreases from 1.15 m to 0.73 m, the average error from 0.37 m to 0.22 m, and the standard deviation from 0.28 m to 0.15 m. Thus, maximum error is improved by (36.5%), average error by (41%), and standard deviation by (46%). A key conclusion of this work is that, using the regression method enhances the performance of VLC indoor positioning system.
compared to the GPS, they still have a relatively high location error and may suffer from the need of additional infrastructure. VLC-based indoor positioning system (IPS) is a promising technology that can locate a receiver position more accurately using the lighting infrastructure already installed inside the buildings. Based on VLC, many algorithms can be used to determine a receiver position such as trilateration, triangulation, proximity detection, and scene analysis [9]. Trilateration based on the received signal strength (RSS) is the most common used localization techniques due to its simplicity. It uses the light intensity levels received from at least three LED bulbs to determine a location of a point [12]. This method requires a prior knowledge of the lamps locations, the transmitter and receiver parameters, and the propagation link model. Typically, positioning accuracy suffers from the receiver noise and from complicated indoor environments. Most of the previous work on VLC-based IPS using RSS technique has considered only a line-of-sight (LOS) link between the LED bulb and the receiver. In reality, reflections from different objects should be taken into account and thus non-line-of-sight (NLOS) links should be considered in the measurements. It has been shown in [13] that 45% of the total received power is coming from NLOS links. In [13], linear least square method has been employed to estimate the position which causes large error and no solution was proposed in order to reduce the reflection effects. In [14], nonlinear least square estimator has been introduced which improves the accuracy by 2.7% only.
Index Terms – Indoor positioning, received signal strength, RSS, regression, visible light communication.
I. INTRODUCTION Visible light communication (VLC) is a technology that uses the visible light emitting diodes (LEDs) for illumination and data transmission simultaneously. VLC has been an attractive research field for academia and industry due to its motivated features. These include high security, simple deployment, low implementation cost, no radio-frequency interference, and license-free operation [1]-[7]. VLC technology is of great interest in many potential applications. One possible scenario for such a technology is to be integrated with the existing lighting infrastructure to locate a receiver in indoor environments. That would be beneficial in places with large areas such as in hospitals, mining fields, museums, and shopping malls [8].
In order to further reduce the effect of the NLOS links on the RSS measurements, in this paper we introduce for the first time the use of a simple regression-based approach to the VLCbased IPS. It is used with the classical RSS technique. It does not need complicated calculations or long processing time to implement [15]. Considering only a first reflection, the regression approach has introduced a great improvement in the localization accuracy by 41%.
Generally, the global positioning satellite-based system (GPS) is not an applicable technology to be used in indoor environments because of its low positioning accuracy which reaches up to several meters. This is due to the difficulty of the satellite microwave signals to penetrate the walls of the buildings [9]. Thus, alternative technologies have been considered for indoor positioning based on radio-frequency systems such as Wi-Fi and other techniques [10], [11]. Although, these techniques provide better position accuracy
978-1-5090-4372-9/17/$31.00 ©2017 IEEE
Moustafa H. Aly College of Engineering and Technology, AAST Alexandria, Egypt
[email protected]
The rest of the paper is organized as follows. Section II describes the indoor VLC propagation link model. Section III mentions the RSS-based positioning algorithm with linear and nonlinear estimators. Section IV presents the proposed regression-based algorithm. Section V shows the results and discussions. Finally, section VI provides the conclusions.
904
II. INDOOR VLC LINK MODEL
It should be noticed that only the first reflection from the four walls is considered in this paper. In addition to the NLOS power, the noise power N at the receiver also contributes to the total power such that 2 2 N thermal shot , (5)
A. Link Model Figure 1 presents a general example of LOS and NLOS indoor VLC links. The optical power received from the LOS link can be obtained from [17] as ( m 1) A cos m ( )Ts ( ) g ( ) cos( ) , FOV Pt 2 d 02 PLOS , (1) 0 , FOV where Pt is the transmitted power, m is the mode number of LED pattern, A is the receiver physical area, Ts() is the optical filter gain, and g() is the concentrator gain. As shown in Fig. 1, is the radiation angle with respect to the transmitter normal axis, is incidence angle with respect to the receiver normal axis, d0 is the Euclidean distance between the transmitter and receiver, and FOV is the receiver field of view. Assuming that the normal axis to the transmitter is parallel to that of the receiver, thus the received power can be written as ( m 1) Ah m 1 Ts ( ) g ( ) , FOV Pt m3 (2) PLOS 2 d 0 , 0 , FOV where h is the vertical distance between the transmitter and the receiver as shown in Fig. 1. Define R as the receiver responsivity, then the output electrical power is obtained from Pele ( RPLOS )2 . Solving (2) for d0, we get d0 2m6
( RPt (m 1) ATs ( ) g ( )h m 1 ) 2 . 4 2 Pelec
2 2 where thermal is the thermal noise variance, and shot is the shot noise variance [20].
Therefore, because of the fluctuations in Pelec, we get dest instead of d0 where dest is the estimated direct distance between the transmitter and receiver taking into accounts the effect of noise and the NLOS component of the channel. The goal of the paper is to get dest close to d0 by minimizing the effects of noise and NLOS power. B. Link Geometry For comparison with previous work, an empty room with dimensions 5 m 5 m 3 m is chosen, shown in Fig. 2. Four LED luminaires are used as the transmitters (access points) mounted at 2.5 m height where each is considered to have a unique ID to differentiate between them. The luminaires are located at positions (1.25, 1.25, 2.5), (1.25, 3.75, 2.5), (3.75, 1.25, 2.5), and (3.75, 3.75, 2.5) m. The number of LEDs in each luminaire is 100 (10 10) where each LED is transmitted a power of 0.45 W with mode number m=1. A single photodiode is used as a receiver at the desk level of 0.85 m height with area 1 cm 2 and field of view 70°. The responsivity of the receiver is R=0.4, the concentration gain is g()=1, and the filter gain is Ts()=1. The walls are assumed to be made of plaster with 0.8 reflectivity where they are divided into small squares of area (0.2 m × 0.2 m) and each acts as a source. These values provide both convenient lighting and communication functions [16].
(3)
Since the total received power Pelec comes from both the LOS and NLOS links, therefore, an error arises in the calculation of d0 when considering only LOS link. This has been studied before in [13], [14]. The received NLOS power can be obtained analytically [17] by
PNLOS
Nref (k ) ( L1 L2 ..Lk 1 ) dA , k 1 FOV (4) k 0 s 0 , k 1 FOV
(3.75, 3.75) (3.75, 1.25)
where Nref is the number of reflections, S is the reflector surface area, L is the path-loss, and Γ(k) is the power of the reflected rays after k reflections [18].
2.5
θ1
5
Fig. 2. The proposed VLC indoor positioning system.
h
d0 θ2
3
5
LOS link
NLOS link (First reflection)
(1.25, 1.25)
Receiver 0.85
LED luminaire
(1.25, 3.75)
III. RSS-BASED INDOOR POSITIONING ALGORITHM θ FOV
To get the receiver position, the conventional trilateration technique is employed based on the measured RSS from at least three luminaires. Two estimation approaches are used: linear and nonlinear least square methods [21].
Receiver Fig. 1. LOS and NLOS links between the transmitter and receiver.
905
A. Linear Least Square Approach.
E (a0 , a1 ,..., an )
Let (xi, yi, zi) be the coordinates of the ith LED luminaire, (xR, yR, zR) be the coordinates of the receiver positions, and desti be the estimated distance between the receiver and the luminaire. Thus, we have 2 (6) ( xR xi ) 2 ( y R yi ) 2 ( z R zi ) 2 d est , i
i
( xR xi )2 ( yR yi )2 ( z R zi ) 2 desti
M
d
a0 a1d estk an d
0k
n estk
. 2
(14)
0, where j= 0, 1, ..., n. Rearranging (15), we get M
k 1
d estj k d 0 k a0
M
k 1
d esj tk an
M
d k 1
j n estk
.
(16)
Finally, by using the Gaussian elimination, the coefficients can be directly obtained.
(9)
In this paper, regression method has been studied for two cases named class A (Reg A) and class B (Reg B). In class A, the regression method is applied on all the room where the coefficients are calculated using 676 training points. However, in class B, the regression method is applied on the outer region only, shown in Fig. 3, where the coefficients are calculated using 352 training points. It should be noticed that the effect of reflections increases near the walls which causes large localization error. Thus, the outer region is considered in the study. For both classes, second order degree n=2 is used in (11) to determine dREG.
, (10) 2
This approach has shown in [7] to give a better performance but it is more complicated and takes more processing time than LLS.
Y-axis
5 4.2
IV. REGRESSION-BASED LOCALIZATION ALGORITHM
0.8
This section aims to explore the use of regression technique in order to get an estimated distance dREG closer to the real one d0. Regression approach is a predictive technique which investigates the relationship between a dependent (target) and one or multiple independent variables (predictor). It can be classified into different types [15]. Here, a polynomial regression is applied that describes the relation between dREG and d0. First, M training data points {destk} are measured and fit into a curve [23] such that 2 n (11) d REGk a0 a1d estk a2 d est an d est , k k
0
0 0.8
4.2 5 X-axis
Fig. 3 The outer region used in Regression class B.
V. RESULTS AND DISCUSSION In this section, we evaluate the effectiveness of our proposed regression approach on the localization error and compare it to the classical approach using both LLS and NLS. Starting with the localization error distribution around the room followed by its histogram, then a table shows some statistical parameters, and finally the cumulative distribution function of the localization error.
where k = 1, ..., M, and n is the degree number. Second, by knowing the exact distance {d0k} for the measured training data, then the error function is given by ek d 0 k d R EGk , (12) n ek d 0 k a0 a1d estk a2 d e2stk an d est . k
2
Then, taking the partial derivatives to zero with respect to the coefficient aj, we get M 2 E 2 d estj k d 0 k a0 a1d estk an d enstk (15) a j k 1
Although LLS estimation is considered a direct way to determine the receiver position, it causes large localization error. Another approach is to use NLS estimation by minimizing the measurement error function [22] given by
k
k 1
B. Nonlinear Least Square Approach.
e
(e ) , k 1
where i = 1, 2, or 3. The distance desti can be obtained from the measured RSS from the ith luminaire. Solving at least three equations of the luminaries with highest RSS [15], the receiver position can be obtained using LLS estimation as X ( AT A)1 AT B, (7) where xR x x y2 y1 (8) A 2 1 , X , x3 x1 y2 y1 yR 2 2 (d est d est x22 y22 x12 y12 ) / 2 1 2 . B 2 2 (d est d est x32 y32 x12 y12 ) / 2 1 3
M
(13)
Fig. 4 shows the localization error distribution around the room by linear least square method without regression, with regression class A, and class B respectively. It is shown that the localization error at the center of the room is minimum and increases gradually as moving towards the walls without using regression. This is due to the reflections beside the walls is
To obtain the a’s coefficients, least squares approximation is used which minimizes the sum of the error squares, such that
906
higher than that at the center of the room. Classical curve has localization errors higher than that in the Reg A and B curves. This is because an optimization formula (11) is used in Reg A and B unlike the classical approach which find the position without any optimization. Looking at Reg B, it is observed that the inner region of the room is similar to the classical and the outer region has a behavior like the Reg A. This is because it is a combination between the classical and Reg A as the regression optimization method applied only on the outer region but the inner remains without optimization. Figure 5 represents the histogram of localization error using the classical, Reg A, and Reg B LLS respectively. It shows that most of the errors are lower than 0.6 m in the case of using regression either A or B but they are distributed till 1 m in the case of the classical.
NLS respectively. It is cleared that most of the errors are below 0.6 m in case of Reg A and below 0.5 m in case of Reg B while climb up to 0.9 m in case of not using regression. We further evaluate the accuracy of the proposed regression algorithm using a set of statistical parameters as shown in Table I. It reduces the localization error largely, i.e., the maximum error achieves an improvement of 29.7%, 36.5%, 25.4%, and 34.4% using LLS Reg A, LLS Reg B, NLS Reg A, and NLS Reg B respectively. It can be observed that the average localization error in case of Reg A LLS outperforms classical LLS by 36% and in the case of Reg B LLS is 40.5%. Reg A NLS improves the average error by 35% and Reg B NLS improves it by 33.3%. In addition, the improvement on standard deviation (STD_DEV) is 41%, 46.4%, 32%, and 46.2% using LLS Reg A, LLS Reg B, NLS Reg A, and NLS Reg B respectively. These statistical parameters demonstrate that regression approach enhances the localization error due to using an optimization equation (11) for the estimated distance between the transmitter and receiver in order to make it close to the real one.
The localization error distribution around the room by nonlinear least square method without regression, with regression class A, and with regression class B is shown in Fig. 6 respectively. The behavior of NLS is similar to LLS, the only difference is that localization errors in the case of NLS are slightly lower. Figure 7 represents the corresponding histogram of the localization error using the classical, Reg A, and Reg B
Regression class B
Regression class A
Classical
5
0.3
3 0.1
Y-axis [m]
4
2 1 0
140
1
. 2 3 4 5 0 1 2 3 X-axis [m] X-axis [m] Fig. 4 Localization error distribution around the room using LLS only (classical), LLS with regression class A and B respectively [m]. 2 3 X-axis [m]
4
5
0
350
Number of occurance
Number of occurance
100 80 60 40 20 0 0.1 0.2 0.3 0.4 0.5 0.6 0.7 0.8 0.9 1 Localization error [m]
300 250 200 150 100 50 0
4
5
250
400
120
0
1
Number of occurance
0
0 0.1 0.2 0.3 0.4 0.5 0.6 0.7 0.8 0.9 1 Localization error [m]
200 150 100 50 0
0 0.1 0.2 0.3 0.4 0.5 0.6 0.7 0.8 0.9 1 Localization error [m]
(b) Fig. 5 Histogram of localization error using LLS only (classical), LLS with regression class A and B respectively.
907
Regression class B
Regression class A
Classical
5
3
0.4
Y-axis [m]
4
2 1 0
0
1
2 3 X-axis [m]
4
5
0
1
2 3 X-axis [m]
4
5
0
1
2 3 X-axis [m]
4
5
Fig. 6 Localization error distribution around the room using NLS only (classical), NLS with regression class A and B respectively [m]. 140
140
100 80 60 40 20 0 0.1 0.2 0.3 0.4 0.5 0.6 0.7 0.8 0.9 1 Localization error [m]
200
Number of occurance
Number of occurance
Number of occurance
120
0
160
250
150 100 50 0
120 100 80 60 40 20 0
0 0.1 0.2 0.3 0.4 0.5 0.6 0.7 0.8 0.9 1 Localization error [m]
0 0.1 0.2 0.3 0.4 0.5 0.6 0.7 0.8 0.9 1 Localization error [m]
Fig. 7 Histogram of localization error using NLS only (classical), NLS with regression class A and B respectively.
Maximum Average STD_DEV
Classical
Reg A
Reg B
Classical
Reg A
Reg B
1.1532 0.3721 0.2896
0.8112 0.2383 0.1713
0.7336 0.2243 0.1581
0.9067 0.3620 0.2620
0.6767 0.2340 0.1774
0.5907 0.2467 0.1439
DC F
TABLE I MAXIMUM, ROOT MEAN SQUARE AND STANDARD DEVIATION OF LOCALIZATION ERROR IN METER [m] LLS NLS
Fig. 8 demonstrates a comparison between all methods using LLS and NLS respectively by measuring the cumulative distribution function of the localization error. It can be shown that the proposed regression approach significantly outperforms the other classical methods. This is because getting a distance between the transmitter and receiver close to the real one by using an optimization relation between them (11). This distance is used to get the receiver position either by LLS (7) or NLS (10). Thus, decreasing the difference between the real distance and the estimated one will improve the localization accuracy. Regression class A and B have a similar performance either by LLS or by NLS but Reg B has lower processing time and less training points as the optimization process occurs only on the outer region.
1 0.9 0.8 0.7 0.6 0.5 0.4 0.3 0.2 0.1 0
LLS without Regression. LLS with Regression, Class A. LLS with Regression, Class B.
0
0.2
0.4
0.6 0.8 Error [m] (a)
908
1
1.2
DC F
1 0.9 0.8 0.7 0.6 0.5 0.4 0.3 0.2 0.1 0
[12] A. Boukerche, H. A. B. Oliveira, E. F. Nakamura and . A. A. F. Loureiro;, "Localization systems for wireless sensor networks," Wireless Communication, vol. 14, no. 6, p. 6–12, 2007. [13] N. A. Mohammed and M. Abd Elkarim, "Exploring the effect of diffuse reflection on indoor localization systems based on RSSI-VLC," Optics Express, vol. 23, pp. 20297-20313, 2015. [14] W. Gu, M. Aminikashani and M. Kavehrad, "Indoor visible light positioning system with multipath reflection analysis," in IEEE International Conference on Consumer Electronics ICCE, Berlin, 2016. [15] J. L. Buchanan and P. R. Turner, Numerical Methods and Analysis, New York: McGraw-Hill, 1992. [16] T. Komine, J. H. Lee, S. Haruyama and M. Nakagawa, "Adaptive equalization system for visible light wireless communication utilizing multiple white LED lighting equipment," EEE Trans. Wirel. Communication, vol. 8, no. 6, p. 2892–2900, 2009. [17] J. M. Kahn and J. R. Barry, "Wireless infrared communications," Proc. IEEE, vol. 85, no. 2, p. 265–298, 1997. [18] K. Lee, H. Park and . J. R. Barry, "Indoor channel characteristics for visible light communications," IEEE Communication Letter, vol. 15, no. 2, p. 217– 219, 2011. [19] T. Komine and M. Nakagawa, "Fundamental analysis for visible-light communication system using LED lights," IEEE Trans. Consum. Electron, vol. 50, no. 1, p. 100–107, 2004. [20] Z. Xueli, D. Jingyuan, F. Yuegang and S. Ancun, "Theoretical accuracy analysis of indoor visible light communication positioning system based on received signal strength indicator," Journal of Lightwave Technology, vol. 32, no. 21, p. 4180–4186, 2014. [21] K. Hyun-Seung, K. Deok-Rae, Y. Se-Hoon, S. Yong-Hwan and H. SangKook, "An Indoor Visible Light Communication Positioning System Using a RF Carrier Allocation Technique," Journal of Lightwave Technology, vol. 31, no. 1, pp. 134-144, 2013. [22] J. J. Mor and D. C. Sorensen, "Computing a trust region step," SIAM Journal on Scientific and Statistical Computing, vol. 4, no. 3, pp. 553-572, 1983. [23] C. C. Steven and P. C. Raymond, , Numerical methods for engineerS, McGraw-Hill, 2012.
NLS without Regression. NLS with Regression, Class A. NLS with Regression, Class B.
0
0.2
0.4
0.6 0.8 Error [m]
1
1.2
(b) Fig. 8 Comparison between different approaches using a) LLS and b) NLS.
VI. CONCLUSION In this paper, an indoor visible light positioning system taking account of multipath reflections has been investigated for a typical room where the localization error is obtained employing a novel regression-based approach. The positioning error is compared with traditional solutions employing the classical lateration method. Comparison has shown that the regression-based approach significantly improves the localization accuracy. Regression approach achieves an average error of only 22 cm with 99.4% of the room having localization errors less than 0.6 m. REFERENCES [1] A. Jovicic, J. Li and T. Richardson, "Visible light communication: opportunities, challenges and the path to market," IEEE Communication Magazin, vol. 51, no. 12, p. 26–32, 2013. [2] P. Pathak, X. Feng, P. Hu and P. Mohapatra, "Visible light communication, networking, and sensing: A survey, potential and challenges," IEEE Communication Surveys Tutorials, vol. 17, no. 4, p. 2047–2077, 2015. [3] H. Burchardt, N. Serafimovski, D. Tsonev, S. Videv and H. Haas, "VLC: Beyond point-to-point communication," IEEE Communication Magazine, vol. 52, no. 7, p. 98–105, 2014. [4] J. Armstrong, Y. Sekercioglu and A. Neild, "Visible light positioning: A roadmap for international standardization," IEEE Communication Magazine, vol. 51, no. 12, p. 68–73, 2013. [5] H. Elgala, R. Mesleh and H. Haas, "ndoor broadcasting via white LEDs and OFDM," IEEE Trans. Consum. Electron, vol. 55, no. 3, p. 1127–1134, 2009. [6] G. Cossu, W. Ali, R. Corsini and E. Ciaramella, "Gigabit-class optical wireless communication system at indoor distances (1.5 ÷ 4 m)," Optics Express, vol. 23, no. 12, p. 15700–15705, 2015. [7] A. Sewaiwar, S. V. Tiwari and Y. H. Chung, "Smart LED allocation scheme for efficient multiuser visible light communication networks," Optics Express, vol. 23, no. 10, p. 13015–13024, 2015. [8] L. Grobe, A. Paraskevopoulos, J. Hilt, D. Schulz, F. Lassak, F. Hartlieb, C. Kottke, V. Jungnickel and . K. D. Langer, "High-speed visible light communication systems," IEEE Communication Magazine, vol. 51, no. 12, p. 60–66, 2013. [9] L. Hui, H. Darabi, P. Banerjee and L. Jing, "Survey of wireless indoor positioning techniques and systems," IEEE Trans. Syst., Man, Cybern, vol. 37, p. 1067–1080, 2007. [10] Y. Gu, A. Lo and I. Niemegeers, "A survey of indoor positioning systems for wireless personal networks," Communication Surveys Tutorials, vol. 11, no. 1, p. 13–32, 2009. [11] J. Hightower and G. Borriello, "Location systems for ubiquitous computing," Computer, vol. 34, no. 8, p. 57–66, 2001.
909