Improvements in the self and peer assessment tool SPARK: Do they improve learning outcomes?
Keith Willey Faculty of Engineering and IT, University of Technology, Sydney,
[email protected] Anne Gardner Faculty of Engineering and IT, University of Technology, Sydney,
[email protected]
As a way of focusing curriculum development and learning outcomes Universities have introduced graduate attributes which their students should develop during the course of is their degree. Some of these attributes are discipline specific, others are generic to all professions. The development of these attributes can be promoted by the careful use of self and peer assessment. The authors have previously reported using the self and peer assessment software tool SPARK in various contexts to facilitate opportunities to practise, develop, assess and provide feedback on these attributes. This research and that of the other developers identified the need for the addition of features to SPARK, to increase its flexibility and capacity to provide feedback. This paper reports the results of the first trials of these new features to investigate their potential to improve learning outcomes.
Keywords: self and peer assessment, graduate attributes, SPARK. Introduction Freeman and McKenzie (2002) reported the development of a confidential online tool called SPARK (Self and Peer Assessment Resource Kit), to both collect self and peer ratings and calculate an adjustment factor to convert group marks into an individual mark for a project. SPARK had four main benefits: 1. It solved most of the administrative issues associated with paper-based approaches such as data collection and analysis. 2. It enabled students to confidentially rate their own and their peers' contributions to a team project against criteria which can be written to include specific project tasks and/or good team practices. 3. SPARK automatically generated both formative and summative assessment factors. The Self and Peer Assessment or SPA factor (see Equation 1) is a weighting factor that can be used to determine an individual's contribution to a team project as indicated in Equation 2. A SPA factor of 1 indicates a student’s contribution was rated as being equal to the average contribution of their team. SPA Factor =
Total ratings for individual team member Average of total ratings for all team members
Individual mark = team mark * Individual’s SPA
(1) (2)
The second factor is the self assessment to peer assessment or SAPA factor calculated as shown in Equation 3. It is the ratio of a participant’s own rating of themselves compared to the average rating of their contribution by their peers. The SAPA factor has strong feedback
ATN Assessment 08: Engaging Students with Assessment
value. For example, a SAPA factor less than 1 means that a student has rated their own performance lower than they were rated by their peers. SAPA Factor =
Self ratings for individual team member Average of ratings for individual by peer team members
(3)
As a result of research by the authors and other developers (see acknowledgement) we identified a number of features to increase SPARK’s flexibility and capacity to provide feedback. This paper reports the results of the first trials of these new features to investigate their potential to improve learning outcomes. Background It is often difficult for an academic to fairly assess the contribution of individual students to a team project since most of the work may have occurred outside of scheduled lecture or tutorial times. Self and peer assessment is often used as a means of handing over assessment of an individual’s contribution to a team task to the team members themselves (Johnston & Miles, 2004). In addition to providing fairer assessment, self and peer assessment is reported as assisting students to develop important professional skills including reflection and critical thinking (Mello, 1993, Somervell, 1993). The literature also examines different methods of using self and peer assessment to derive individual grades for team assessments (Lejk et al, 1996; Goldfinch, 1994; Goldfinch & Raeside, 1990). Typically team members evaluate themselves and each other. These evaluations are then incorporated into an individual student’s assessment, either as an addition to the team assignment mark, or by adjusting the team assignment mark to produce an individual mark. Falchikov and Goldfinch (2000) compared peer and teacher marks and found that peer assessments more closely resemble teacher assessments when global judgements based on well understood criteria were used compared to marking that involved assessing several individual dimensions. They also reported a link between high quality design of assessment tasks and more valid peer assessments, a view supported by Freeman and McKenzie (2002). A great deal of the published research has focused on using self and peer assessment for discouraging group free riders, promoting team collaboration and for summative purposes. More recently Willey & Freeman (2006a) report using it to produce formative learning-oriented feedback to complete the learning cycle, promote academic honesty, encourage the ongoing development of skills and improve the quality of subsequent contributions, while Boud and Falchikov (2007) discuss its use for developing students’ skills for lifelong learning. As a way of focusing curriculum development and learning outcomes Universities have introduced graduate attributes which their students should develop during the course of their degree. Some of these attributes are discipline specific, others are generic to all professions. Similarly attributes are generally required by professional organisations to obtain degree program accreditation or for their members to obtain professional accreditation. For example Engineers Australia Accreditation Policy (Engineers Australia, 2004) lists attributes divided into three Units of Competency: • Unit 1: Knowledge Base • Unit 2: Engineering Ability • Unit 3: Professional Attributes Willey and Gardner (2008a) report the potential for using self and peer assessment to both assess and track graduate attribute development not only within a subject but potentially
ATN Assessment 08: Engaging Students with Assessment
ATN Assessment 08: Engaging Students with Assessment
throughout a whole degree program. The fact that SPARK is a criteria-based tool allows academics the flexibility to choose or create specifically targeted criteria to allow any task or attribute development to be assessed. In addition, using common categories (like the three described above) throughout a degree program, to which academics link their chosen criteria, allows the results to be recorded, for example in an e-portfolio, providing a means for both academics and students to track students’ development as they progress through their degree. An essential component of any learning process should include students receiving feedback on their development. For feedback to be productive and useful for student reflection, it must be both timely and focused. The thoughtful integration of SPARK allows feedback to be provided efficiently, even in large classes, by enabling students to receive feedback from their team peers. The authors have used SPARK to both assess and provide feedback regarding a team member’s contribution to a group project, and also to provide assessment and feedback to students on individual assignments assessed by themselves and their peers. The SPARK metrics are shared between all group members in feedback sessions to assist learning. Students are guided on how to both reflect on their own performance and learning, and to give constructive feedback to their team peers (Willey & Gardner, 2008b; Willey K, & Freeman M, 2006b). The process focuses on improving students’ judgment (Boud & Falchikov, 2007) moving them to be more expert in their ability to engage with subject learning outcomes. In addition, students are providing feedback, an essential ingredient of peer learning, with only a comparatively small implementation effort required by the coordinating academic. As a result of research by the authors and the other developers a number of features were identified that would increase SPARK’s flexibility, capacity to provide feedback and improve student learning outcomes. These features include: • the ability for students to anonymously provide written feedback to their peers. • the ability for both the SPA and SAPA factors to be either overall (assessment of the students’ overall contribution or grade) or category based where the assessment and feedback is reported over a number of different categories or attributes. • a graphical interface to assist interpretation of results • provision for feedback on all assessment criteria so students can see how they rated themselves compared to the average rating they received from their team peers. • the addition of different formulas and rating scales to increase SPARK’s flexibility to facilitate assessment tasks with different objectives. SPARK improvements SPARK V2 allows students to provide anonymous written feedback comments to their peers. An example of this feature can be seen in Figure 1 which shows a partial screen shot of the results screen for a student named George. This screen shot also displays the overall assessment factors and the assessment factors for the three Engineers Australia categories previously described (note the assessment criteria within each category are hidden behind the radar diagram). These factors not only allow students to identify their strengths and weaknesses but enables academics to provide specific coaching to assist students to improve their performance in identified areas of weakness.
ATN Assessment 08: Engaging Students with Assessment
ATN Assessment 08: Engaging Students with Assessment
For example referring to Figure 1 where the three categories used (in the order they appear in the Figure) were knowledge base, engineering ability and professional skills and the assessment rating key was WB - well below average to WA- well above average:
Figure 1: Screen shot showing overall and category feedback (SAPA) and performance (SPA) factors, radar diagram and feedback comments.
The overall (aggregate) performance factor (0.97) indicates that George is performing well, contributing only slightly lower than the average performance of his team peers. The formative feedback or SAPA factor of 1.18 indicates that the George’s opinion of his own performance is significantly greater than the average opinion of his performance by his team peers. More insight is gained by looking at the individual factors for each attribute category. These report that: George's contribution to the team’s required engineering knowledge is only slightly below the average of his team peers (SPA = 0.96). Perhaps more importantly the SAPA factor of 1.27 indicates that George does not share his peers’ opinion of his performance, believing he has contributed much more to this category. The reasons for this difference in opinion would generally be explored in a feedback session, and maybe attributed to a number of factors including: • George’s real contribution has not been fairly assessed by his peers. • George’s peers have not provided feedback to George in regard to his performance and hence he is unaware of the differences between his self and his team peers perceptions. • George may be aware of his performance level but deliberately chose to inflate his ratings to increase his overall mark.
ATN Assessment 08: Engaging Students with Assessment
ATN Assessment 08: Engaging Students with Assessment
Conversely George's contribution to the team in regard to engineering ability is equivalent to the average of his team peers (SPA = 1). Furthermore the SAPA factor of 0.99 indicates that George’s assessment of his contribution is shared by his peers. Hence analysis of the category factors indicates that George's strength in this project was his engineering ability, while his weaker areas of contribution were his engineering knowledge and professional skills. Furthermore prior to receiving this feedback George may have been unaware that he was underperforming in these areas. The factors provide feedback for George to reflect on his performance and for the whole team to reflect on their assessments. Early stage students are guided in the interpretation of their results during tutor facilitated feedback sessions. In these sessions students are guided through a feedback process to assist them in identifying their strengths and weaknesses, encourage feedback between team members and reaching an agreement on how the team can improve their performance for the remaining assessment tasks (Willey & Gardner, 2008b; Willey K, & Freeman M. 2006b).
Figure 2: Screen shot showing overall feedback (SAPA) and performance (SPA) factors and bar chart. Note only one category was used in this assessment.
The two different options for graphical feedback of the assessment factors are shown in Figures 1 and 2. In Figure 1 the factors are displayed as a radar diagram which clearly identifies a student’s strengths and weaknesses (the position of the SPA factor envelope compared to 1 - while the SAPA envelope identifies any discrepancies between a student’s self perceptions and the perceptions of their performances by their peers). When only one category of criteria is used this feedback is provided by a bar graph as shown in Figure 2. An instructor can also choose to provide students with feedback in regard to the differences between their own self assessments and the average assessment of their performance by their peers for each individual criterion. In Figures 1 and 2 the upper (blue) triangle shows the students self rating for each individual criteria, while the lower (orange) triangle shows the student’s average rating for each criteria received from their team peers. Hence students can
ATN Assessment 08: Engaging Students with Assessment
ATN Assessment 08: Engaging Students with Assessment
receive detailed formative feedback on their performance in regard to each individual criterion. 2 1.8 1.6
SPA Factors
1.4 1.2
Linear
1
Knee Original
0.8 0.6 0.4 0.2 0 0
0.2 0.4 0.6 0.8
1
1.2 1.4 1.6 1.8
2
Individual's Assessment / Average of all Team Members Assessment
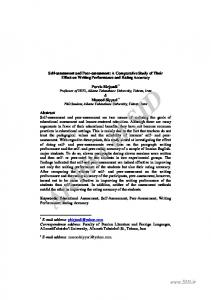
Figure 3: The relationship between the two new and original method of calculating the SPA factor. Note the Knee plot has been slightly offset to increase readability.
SPARK V2 also allows the use of different formulas and rating scales to accommodate the design of assessment tasks with different objectives. For example Figure 3 shows the relationship between the two new and original (Equation 1) method of calculating the SPA factor: Linear SPA = (Equation 1) 2, Knee SPA = (Equation 1) 2 if ≤ 1 or Equation 1 if > 1. Subject Implementations In this paper we report the results from two implementations, Design Fundamentals and an international short course run by the International Institute of Women in Engineering (IIWE), in which self and peer assessment was used to assess, assign marks and provide feedback on a combination of both discipline specific and generic professional attributes with which students must engage as part of a group project. Design Fundamentals is a second year subject taken by all engineering students at UTS. The subject’s primary aim is to develop students’ understanding of the engineering design process and to provide them with the skills to develop a small engineering project from initial concept through the design stages of requirements analysis, system design, and detailed design to the development of an alpha prototype. A secondary, but just as important, aim of the subject is to build on students’ skill and generic attribute development begun in the first year of their degree. Students are required to work in teams of four to produce a prototype product, two reports and make an oral presentation. The group assessment represents 50% of a student’s overall grade. The annual short course (three weeks duration) run by the IIWE is aimed at recently graduated, or soon to graduate, engineers of all disciplines (Hazelton et al, 2008). There were 32 participants (31 female and 1 male) from 16 countries. The course aims to prepare participants for the diverse cultural context within which modern engineering is often practiced. Participants are graded based on their performance in several assessment tasks including two group presentations (six students per group and representing a total of 40% of a
ATN Assessment 08: Engaging Students with Assessment
ATN Assessment 08: Engaging Students with Assessment
student’s grade): one with peers from their geographic area, and one with peers from a mix of geographic areas and cultures. Results In this paper we present the relevant results from post-subject surveys for both implementations. The survey questions were either free response or written in 4-point Likert format. The results of these surveys are summarised in Table 1. The table reports the combined percentage of the two positive and the two negative response options. In Design Fundamentals there were 123 respondents from a cohort of 288, while in the IIWE shortcourse there were 29 respondents from a cohort of 32. Table 1: Post survey results for Design Fundamentals and IIWE short course
SA/A
D/SD
No Answer
The feedback I received from my assessment factors will help me to build on my strengths and/or address my weaknesses.
61.5
30.8
7.7
The graphical (Bar Graph) representation of the SPARK factors was easier to interpret than the numbers only.
57.7
19.2
23.1
The feedback sliders showing the blue and orange triangles on each criteria made it easy for me to identify my strengths and weaknesses.
53.8
15.4
26.9
The written feedback I received from SPARK helped me to identify my strengths and weaknesses.
57.7
26.9
15.4
SA/A
D/SD
No Answer
The provision of feedback factors (SPA & SAPA) for each of the Engineers Australia's competency categories (as opposed to just aggregate factors) helped me to identify my strengths and weaknesses.
61.0
39.0
0.0
The feedback I received from the SAPA and SPA factors and my team will assist me to improve my skills.
57.7
41.5
0.8
Questions (from IIWE short course)
Questions (from Design Fundamentals)
Discussion Given the fact that the IIWE short course was less than an ideal context for testing the new features of SPARK V2, being only three weeks in duration and having group membership change for each assessment task, the results were surprisingly positive. Fifty seven per cent of respondents reported that the bar chart (only one criteria category was used) made it easier for them to interpret their results than using the numbers alone. This is particularly encouraging given that the IIWE short-course only used one category so each student only received two assessment factors. This suggests that the benefits should be greater in subjects where multiple categories and hence multiple assessment factors are used. Students reported (57.7%) that both the written feedback comments and the feedback triangles on each criteria (53.8%) helped students identify their individual strengths and weaknesses. Respondents in Design Fundamentals (61%) reported that the addition of category factors also helped them to identify their strength and weaknesses. While far from conclusive because of the different contexts and cohorts the results also suggest that category SPA and SAPA factors (61% Design Fundamentals) were more effective than the criteria feedback triangles (53.8%
ATN Assessment 08: Engaging Students with Assessment
ATN Assessment 08: Engaging Students with Assessment
IIWE short course) in helping students to identify their competency levels in different attribute categories. Both cohorts (57.7% Design Fundamentals, 61.5% IIWE) reported that the feedback they receive from their assessment factors will assist them in their skill development. The academic coordinators for both implementations felt the knee formula for calculating a student’s SPA factor provided them with the most desirable option, combining the best features of the original and linear calculation methods. Table 2 shows the SPA factors for a team of four students where initially Student A only contributes half of the work contributed by his three team peers. In the second instance Student A contributes twice as much work as his team peers. The coordinators reported that the knee formula helped promote teamwork and fair division of the assessment task between team members. The knee formula does not reward students who might be tempted to do most of the work (Table 2 shows a student who did twice as much work as their peers would only get an SPA factor of 1.26) while providing incentive for those who are tempted to under perform (Table 2 shows a student who did half as much work as their peers would get an SPA factor of 0.57). Table 2: SPA factors using different formulae for groups with over and under performing team members. Assessor Student A Student B, C & D Student A Student B, C & D
Student Student Student Student SPA SPA Knee A B C D Original Student A Contribution Half that of other Team Peer's 1 1 1 1 0.76 0.57 2 2 1
2
1.14
Student A Contribution Twice that of other Team Peer's 2 2 2 1.26 1.26
1.60
1
2
1
1.07
0.57
1.07
1
2
SPA Linear
0.89
0.80
0.80
Design Fundamentals students also reported that they liked the knee formula as it provided a fairer distribution of marks and sent a stronger feedback message to underperforming students than with the factors calculated using the original formula. Some students had previously expressed concern that, using the original formula, underperforming students received an inflated mark that they were satisfied with, and hence were not motivated to improve their performance for the remaining parts of a project (Willey & Freeman, 2006b). For example Table 2 shows using the original formula a student who only did half as much work as their team peers would get an SPA factor of 0.76 and hence receive 76% of the group mark. Using the knee formula this student’s mark would be reduced to 57% of the group mark, a figure that more closely reflects their true contribution. Conclusion In this paper we discuss the new features of the online tool SPARK. These include the ability for students to provide written feedback to team peers, the capacity to use either overall and/or category based assessment and feedback factors, a graphical representation of these factors, the ability to provide feedback on all assessment criteria and the inclusion of different formulae and rating scales. The preliminary trials suggest that these new features will be effective in providing more detailed and easier to interpret feedback to students in regard to their performance, assisting
ATN Assessment 08: Engaging Students with Assessment
ATN Assessment 08: Engaging Students with Assessment
students to identify their strengths and weaknesses and facilitate the tracking of their graduate attribute development. Acknowledgements SPARK V2 is a joint research project between the University of Technology, Sydney and the University of Sydney. The main developers are Dr Keith Willey UTS, A/Prof Mark Freeman USyd, Mr Darrall Thompson UTS and Mr Mike Howard.
References Boud D., & Falchikov, N.( 2007) Rethinking assessment in higher education learning for the longer term. Routledge, 2007 Engineers Australia (2004), Australia Engineering Competency Standards – Stage 1 Competency Standards for Professional Engineers, (retrieved from 30 June 2007) http://www.engineersaustralia.org.au Falchikov, N., & Goldfinch, J. (2000). Student Peer Assessment in Higher Education: A Meta-Analysis Comparing Peer and Teacher Marks. Review of Educational Research, 70(3), 287-322. Freeman M. & McKenzie J. (2002), SPARK, A Confidential Web-Based Template for Self and Peer Assessment of Student Teamwork: Benefits of Evaluating across Different Subjects, British Journal of Educational Technology, 33, 551-69. Goldfinch, J. (1994). Further developments in peer assessment of group projects. Assessment & Evaluation in Higher Education 19, 29. Goldfinch, J., & Raeside, R. (1990). Development of a peer assessment technique for obtaining individual marks on a group project. Assessment and Evaluation in Higher Education, 15(3), 210- 231. Hazelton, P., Malone, M., & Gardner, A (2008) A multicultural, multidisciplinary short course to introduce recently graduated engineers to the global nature of professional practice. Proceedings of the 36th Annual Conference of the European Society for Engineering Education, 2-5th July, 2008, Aalborg, Denmark. Lejk M, Wyvill M, & S. Farrow (1996). A survey of methods of deriving individual grades from group assessments, Assessment & Evaluation in Higher Education, 21, 267–280. Johnston, L & Miles, L, (2004). Assessing contributions to group assignments, Assessment and Evaluation in Higher Education, 29, 751. Mello J. A. (1993). Improving individual member accountability in small work group settings, Journal of Management Education, 17(2), 253-259. Somervell H. (1993). Issues in assessment, enterprise and higher education: the case for self-, peer and collaborative assessment, Assessment & Evaluation in Higher Education, 18, 221–233. Willey, K. & Freeman M. (2006a), Completing the learning cycle: The role of formative feedback when using self and peer assessment to improve teamwork and engagement. Proceedings of the 17th Annual Conference of the Australasian Association for Engineering Education, 10 -13th December 2006, Auckland, New Zealand. Willey K, & Freeman M. (2006b), “Improving teamwork and engagement: the case for self and peer assessment”, Australasian Journal of Engineering Education. Online publication 2006-02 http://www.aaee.com.au/journal/2006/willey0106.pdf Willey, K & Gardner, A. (2008a) Using self assessment to integrate graduate attribute development with discipline content delivery. Proceedings of the 36th Annual Conference of the European Association of Engineering Education (SEFI) 2-5 July, Aalborg, Denmark. Willey, K. & Gardner, A. (in press) Using self and peer assessment for professional and team skill development: Do well functioning teams experience the benefits?
ATN Assessment 08: Engaging Students with Assessment