Self and Peer Assessment in Software Engineering Projects Nicole Clark, Pamela Davies, Rebecca Skeers School of Computing University of Tasmania GPO Box 252-100, Tasmania, 7001, Australia
[email protected],
[email protected],
[email protected]
Abstract Team software engineering projects can enhance student learning and commitment, but it is challenging to determine a method of assessment that assesses the intended learning outcomes; particularly when assessing teamwork and an individual’s contribution to the team’s work. The students themselves are often the best source of meaningful data, and self and peer assessment is a valuable part of the whole assessment scheme. To ensure the integrity of the final grade it is necessary to use a variety of tools and to check the correlation between data from different sources. To increase the learning opportunities it is useful to repeat some assessment tasks during the course. However, this can be time-consuming for the lecturer to collate and analyse, and providing timely feedback to the students is difficult. Web-based peer assessment offers an opportunity to provide quality, timely feedback in a way that is manageable by the lecturer.
ensure that the quality of the assessment process is maintained. As pointed out by Fisher (1999) “Assessment drives student learning. Workloads drive assessment … with increasing workload demands being placed upon academics, assessment may suffer. The consequences of this may be reduced quality of student learning.” A webbased system is used as it enables the use of assessment tools that provide timely feedback to larger and more diverse student cohorts in a manageable way. Students can see aggregated feedback from their team members, while maintaining the anonymity of the author. This paper describes a suite of tools for self and peer feedback and assessment used in Software Engineering Project to gather information on quantity and quality of individual contributions to the team’s work and the individual’s performance as a team member. The paper documents several years of experimentation with approaches described in the literature, including both failures and refinements to successful approaches.
Keywords: Software Engineering, Education, Peer Assessment.
2
1
Gates et al (2000) identified the importance of structuring individual accountability to ensure that all members of a team contribute to the project, and along with Hayes et al (2003) consider that, for assessment to be fair and to ensure an equitable distribution of grades, the assessment scheme must reflect the individual’s contribution to the overall project. Wilkins and Lawhead (2000) believe that many lecturers shy away from team project situations, partly because of the challenge to devise a way to assign grades to individual team members.
Introduction
Evidence of the ability to work in a team is often required or considered desirable by employers (Hagan 2004). Many universities offer project-based courses to provide students with both the opportunity to develop their skills and to gain experience working in a team. Providing an authentic experience for students where they work in small teams, typically means that each team undertakes a different project. Performing a fair and accurate assessment of individual student contributions to the work produced by a team as well as assessing teamwork itself presents numerous challenges; particularly when the projects themselves are significantly different. Software Engineering Project is a full-year, capstone program undertaken by third year students in the threeyear Bachelor of Computing degree at the University of Tasmania. The aim of the program is to provide students with experience developing a medium-sized computing project in a small team of four or five students. The students gain real world experience by undertaking projects proposed by local ICT businesses with the team interacting directly with the ‘client’ for their project. The student’s final grade is based on a team mark and an individual mark for the contribution to the team’s work. While timely, individual feedback throughout the course is central to facilitating learning, providing detailed, quality feedback to a large number of students is an extremely time-consuming task. It is a challenge to
Rationale for Self and Peer Assessment
A number of authors, Biggs (1999), Lister and Leaney (2003), Hayes et al (2003), Box (2004), have emphasised the need to ensure that assessment tasks do actually assess the intended learning outcomes. If an intended learning outcome of a course is that students are able to work as a member of a small team to produce a quality software product then assessment should involve assessing both how well the team works and the quality of the product. The dilemma, particularly in large classes, is often how to assess the individual contribution to the team’s work and ensure that students receive quality feedback in a timely fashion. In addition to ensuring that assessment is clearly linked to the intended learning outcomes it is also important that it is based on data from appropriate people, McGourty et al. (2000). For example, there is little point having the lecturer assess how the students in a team interact with each other if they are not present at the meetings or if, when they are present, the students radically change their
behaviour. The students will learn more by having feedback on this from their peers. McGourty et al. (1998) stated: “In a cooperative learning environment, students themselves are often in the best position to provide one another with meaningful feedback regarding both their technical and interpersonal performance.”
can also provide the lecturer with enough evidence to assign the final grade with confidence or, where the feedback is conflicting, to pinpoint issues that need further investigation.
Biggs (1999) argues that self and peer assessment can also provide a close link between the assessment and the intended learning outcomes especially for team-based work where teamwork is one of the intended learning outcomes, and that it can facilitate greater learning as it encourages students to reflect more on their own learning. Furthermore, it has the potential to support the team in taking more responsibility for their project – a motivational factor for some students. It can be a source of feedback for both students and the lecturer about how well students work in their teams, as well as what they are individually contributing to the team project, and can contribute to final grade for each student. Sanders (1984) considers that well designed peer reviews can point out both the exceptional and the weak performers but raised concerns about whether the data provided by the students could be relied on for assessment.
Software Engineering Project is a 26-week program offered on two campuses, 200 km apart. It is 25% of a full third-year load. Students work in teams of four or five students on their own team project. The lecturer supervises all of the teams. Since 2002 the Software Engineering Project has been broken into two 13-week units (2 semesters). The student gets a grade for each unit and they must be completed in consecutive semesters. Prior to 2002 it was a single 26-week unit offered on one campus only. Table 1 shows the numbers of students in Software Engineering Project from 2000-2004.
Most self and peer assessment tools require the students to fill in forms to report on some aspect of either their own or their team members’ contribution. In an approach, advocated by Brown (1995) and modified by Kaufmann (2000) and Layton and Ohland (2001), students use a prescribed list of terms such as ‘excellent’, ‘very good’, ‘satisfactory’ and so forth to describe the overall performance of a team member. Another approach, described by Ohland and Layton (2000), Sanders (1984) and Clear (2002), has students assign numerical ratings to different team behaviour characteristics for each team member, such as contribution at meetings and approach to work. With the approach of Clear (2002) the lecturer discusses the ratings at team meetings to facilitate greater learning for the students. There are many examples where students write a report or keep records about their contribution to either the project as a whole or their individual work products, Hayes et al (2003), Gates et al (2000), Brown and Dobbie (1999), Humphrey (1997). Records can include minutes of meetings, timesheets, task assignment, and written answers to questions about individual contribution. Other team members may be required to indicate agreement or disagreement on the accuracy of the records. Wilkins and Lawhead (2000) describe several different peer assessment tools. They advise that when using peer assessment a variety of techniques should be used to reduce the possibility of a student intentionally ‘damaging’ the score of another student and to allow students to describe the contributions of individual team members without feeling they are ‘ratting’ on them. McGourty et al (2000) recommended that assessment is provided by several sources such as peers, self and lecturers. This multi-source assessment provides critical information and perspectives from the different sources, on student competencies, and specific behaviours and skills. This can provide the student with a better understanding of personal strengths and weaknesses. It
3
Description of the Program
All teams are formed and projects allocated on day one during a 6-hour workshop/lecture. The students can choose their own teams – a lot of guidance is given on how to choose appropriate team members (Clark 2002). Teams then choose which project they would like to do from the list of available projects. There are more projects than teams to enable teams to choose a project that fits with their interests and skills (Clark 2005). Each team collaborates with a different industry client to produce a major piece of software. The team works on the same project for the entire program. The projects are in one or more of the following domains: software applications, virtual reality systems, online content systems, systems administration software, mobile device software, or systems that use artificial intelligence. The projects give the students an opportunity to work together on parts of the development and to work independently on other parts. In the first semester teams complete an analysis, design, implementation and documentation phase to produce Release One of their project. Formal testing is included in each phase. Release One is about a third of the final product. In second semester they repeat the phases and produce Release Two (the final product). As the teams gain experience in the process and spend time learning the development tools in first semester, they are able to work more effectively in the second semester. The second iteration allows them to gain confidence in their abilities, develop greater knowledge of the domain and tackle the more challenging aspects of the project. At the end of the program each team should have produced a useable piece of software. Each student’s result is based partly on the successful implementation of a working product and partly on how they perform on the project process as a whole. Importance is placed on the students' ability to interact with the client, the ability to present and demonstrate their work and produce appropriate documentation. They are assessed in six areas: Design, Software, Documentation, Presentation, Professionalism, and Personal Software Process (PSP). These six areas are assessed using a variety of methods, and by a number of different people (Clark 2005).
Year
Number of Campuses
Number of Students
Number of Teams
2000
1
40
9
2001
1
24
6
2002
2
108
24
2003
2
136
33
2004
2
130
27
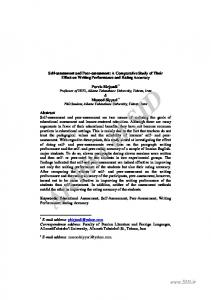
different aspects of their project. Each team member enters their times using the form shown in Figure 1. Students can view team member’s timesheets as well as a summary of how much each team member contributed to a particular job code. Students can also compare how much time their team has spent on their project with other teams in the class. Students can also see class statistics for a specific week, or over the semester, such as the average number of hours worked by students in the class, and the maximum hours worked by any student in the class as well as the minimum.
Table 1: Software Engineering Project student data Self and peer assessment is used in Software Engineering Project; sometimes it is used for formative feedback only, and at other times it is used to determine a grade as well as to provide feedback. Peer assessment is repeated at several times throughout the year. This allows for early identification of under (and over) performing students and gives the students an opportunity to change and to receive feedback on the effect of their changes.
The second tool, the Self/Peer Evaluation Survey, was based on ideas presented by Sanders (1984) and Ohland and Layton (2000). The students rate each team member (including self) on a list of behavioural characteristics of good teamwork. The characteristics are divided into two groups: Meetings and Work Habits. The form contains a list of statements about teamwork characteristics such as: attendance at team meetings, contributing to the ideas and discussion at the meetings, completing work by deadlines, and the team member’s ability to work with the other team members. For each statement the student indicates how often the team member behaved according to the statement using the scale: Always (worth 2), Usually (1), Sometimes (0), Rarely (-1), Never (-2). In addition two short answer questions are included on the survey form for formative feedback only. They are:
Students know from the start of the program that their individual contribution will be assessed, and that they cannot rely on the team to carry them. Each student’s grade consists of an individual component that is marked out of 40 and a team component that is marked out of 60. To pass a student must achieve at least 50% overall with a minimum of 40% for both parts. Students are aware that self and peer assessment is the major source of data used for the individual component of their final grade.
4
•
Self and Peer Assessment
•
In Software Engineering Project a range of self and peer assessment tools are used for students to record the individual contributions made by themselves and the other team members, and to provide information about how well they are working in the team. The information submitted is used to provide formative feedback. It is also used to help determine the individual component of their final marks. All tools are web-based with the data stored in a database. They are: • • • •
Students complete the online Self/Peer Evaluation Survey form several times during the semester. Once the due date has passed students can view aggregated feedback from their team members together with the responses to the questions (displayed anonymously). Figure 2 shows the type of feedback that a student can see using this tool. The third tool, Individual Contribution Report, is similar to approaches described by many others (e.g. Gates et al (2000), Hayes et al (2003)). Students submit an online report detailing their individual contribution to the work products for each phase of the project. Once submitted each of their team members reads the report privately and indicates whether they agree or disagree with the report. They are encouraged to add a comment and must provide detailed reasons if they disagree. Only the lecturer sees the feedback about the other team members’ reports.
Timesheet Self/Peer Evaluation Survey Individual Contribution Report Quantity Report
Each week all students submit an online timesheet where they enter how much time they have spent working on Date
Start (hh:mm)
Finish (hh:mm)
Describe one of the highlights of the student’s performance; Suggest one area where the student could improve.
Interruptions (mins)
Job code
Comments
Mon 26 Jul
09:15
10:00
Team Meeting
Formal team meetin
Tue 27 Jul
11:05
11:45
Requirement Documen
Wrote section 4
Tue 27 Jul
14:45
17:35
RTM
Convert RD to RTM
Wed 28 Jul
16:00
17:00
Scenarios
Wrote Scenario 16
Thu 29 Jul
9:45
11:00
Prototypes
Design GUI for 16
40
15
Figure 1: Timesheet Entry Page
This table shows the rating that the students gave themselves – indicated by a 'Y' and the average rating assigned to them by the rest of their team members indicated by a 'T'. The ratings are: A –Always, U –Usually, S –Sometimes, R –Rarely, N –Never Meetings
A
U
I arrived on time for meetings
Y
T
I showed a cooperative attitude during meetings
Y
T
I was prepared for meetings
Y
T
I made meaningful contributions at meetings
Y
T
S
I wasted time with irrelevant conversation I identified and raised important issues
Y
N
T
Y
T
I was inattentive at meetings
Y
I listened to others at meetings
T
I brought my individual work to the meetings
R
T
Y
YT
I gave suggestions about other people’s work at the meetings Work Habits
Y
T
A
U
S
T
Y
I used time effectively I cooperated with team members
Y
T
I was willing to share information with team members
Y
T
I spent time working with other team members on their tasks
T
I was willing to train team members
Y
I showed initiative by doing library or internet research
R
N
Y
T YT
I undertook tasks that required significant research
YT
I was able to complete individual subtasks with little or no assistance
YT
My individual subtasks were fully completed
Y
T
My individual subtasks were completed on time
Y
T
My individual subtasks were of a high quality
Y
T
I reviewed design documents
YT
I reviewed drafts of the manual
YT
I tested software developed by other team members
YT
I carried out the duties of his/her management role
Y
T
Comments Describe one of the highlights of the student’s performance. 1.
Keeps meetings on track
2.
Good at keeping control of meetings, and keeping them moving along when they became stuck at some point, or were getting off track of the main agenda.
3.
Proactive in the semester 1 role of Project leader, showing leadership, motivational and organisational skills.
Suggest one area where the student could improve. 1.
Communicate more, let team members know what is happening
2.
Improve by asking for help more when he’s having difficulty with completing some task, rather than saying it will get done and continue to struggle with the work. More research into things may be of help with this too if no one is around at the time (internet resources search etc).
3.
It was hard to grade his work, he talked about it a great deal, but did not actually show the completed work. He can only be graded on what I saw, rather than heard. This also detracted from his leadership role (he talked the talk, but didn't walk the walk). He showed little interest in learning new skills.
Figure 2: Peer Survey Feedback Form (Semester 2, 2004)
Pay Pat
$30
Clive
$25
Tom
$15
John
$10
Jeff
$20
Total
$100
Bonus
Comments Jeff put considerable effort into developing an installation disk that was an extra feature, not allocated to anyone.
Yes
Figure 3: Work Product Pay Packet Entry Form With the final tool, Quantity Report, students are asked to quantify the relative contribution of each team member to the work products produced in each phase of the project. This approach is similar to the one described by Hayes et al (2003) and the numbers entered are used in a way similar to the one Brown (1995) used with the Autorating system. For the Quantity Report, students distribute dollars using a web-based ‘Work Product Pay Packet’ form (see Figure 3). Each student distributes $100 amongst the team members based on their opinion of the quality and quantity of work produced by each member of their team. A bonus of $5 can be given to one other team member if they believe that team member has done above and beyond what was required. Once the due date for submission has passed students can view the average amount given to them by their team members and compare it to the amount they gave themselves. They can use this information as a guide to how their team members think they are performing. This is useful for the students who are under performing as they realise that they are not hiding their lack of contribution from their team members. It is also useful for the team members spending excessive hours on project to see that they have not been compensated for their efforts, and maybe they need to balance their project work with their other studies. Each of the tools provides some built-in checking to provide a degree of validation for the data collected. Timesheet data is viewable by all members of the team and any issues about the validity of the data entered by another team member can be discussed. For both the self/peer evaluation survey and the quantity report variations between the ratings given by different members of a team can be followed up with students. The other team members read the Individual Contribution Report and concerns about the validity of the information provided can be raised confidentially with the lecturer when the student provides the response to the report. While there is value in using any one of these tools, the real benefit comes from the integrated use of all of the tools. The data provided by each tool should be consistent with the data provided by the other tools. If it is not consistent then the validity of the data is in question and is followed up with the students. If the data provided using this suite of tools is consistent then it can be used with a degree of confidence to determine marks towards the individual component of a student’s final grade.
Each major work product is assessed on the basis on quantity, quality and difficulty using the process described in Clark (2005) and a team mark is assigned. The lecturer then checks that the Quantity Report for each student in the team is consistent with the data collected using the other tools. If it is consistent this data is used to assign the relative contribution of each team member as a percentage, and if not it is adjusted. If team members have received any bonuses then the sum of these values for the team will be >100%. Each member of a team then has a % value representing their contribution. This ‘% Contribution’ and the team mark are used to calculate the individual component mark for that work product. For example in semester 1 each student receives a mark out of 15 for a work product submitted at the end of the design phase. The submitted work product is marked out of 10 and this becomes the team mark. A student’s mark [TotalMark] is made up of the team mark [TeamMark] plus the individual component mark [IndivMark]. 1. 2.
IndivMark = (TeamMark / 10) * %Contribution * TeamSize * 5 TotalMark = IndivMark + TeamMark
If the individual contribution of a student in a team of 5 is 30% and the team mark is 7/10 then the individual mark for the work product is 5.25/5 and the student’s total mark is 12.25/15. A student with a 10% individual contribution would have an individual mark of 1.75/5 and a total mark of 8.75/15. Calculating the final grade is a detailed process, given that there are six assessed components and numerous assessors; the complete formula is described in Clark (2005). Of the 40 possible marks for the individual component of their final grade only 10 of these do not use self or peer assessment tools as the basis of the mark. The individual component of the assessment includes: 1.
An individual mark for each work product produced by the team for each phase of the project. For example, in Release One there are four work products: analysis report (5%), design report (5%), software (8%), manual (2%). Each individual mark is determined using the process described above.
2.
A mark for an individual’s contribution to the way the team works – part of Professionalism. The average of the ratings given to a student by all the team members for the self/peer evaluation surveys is used to calculate the individual component mark for Professionalism (5%).
3.
A mark for PSP which includes a participation mark of 5% for both timesheets and testing. Participation in the timesheet activity is assessed to encourage the students to complete the task.
4.
A mark for the individual contribution to the team website and presentation. These are marked by the lecturer. (5%)
5
Rationale for the Design of the Tools
The approach described in this paper has been informed by the research of others in the field and by action research. Apart from unsolicited feedback and informal
feedback from students about the program, at the end of each semester formal feedback is sought. Up until semester 2 2002 this ‘program feedback’ was achieved through face-to-face meetings with students and/or written feedback. However due to the increased numbers of students, from semester 2 2002 students were asked to provide feedback by filling in an anonymous survey. In 2002 and 2003 the surveys were paper based with close to a 100% response rate. In 2004 the survey was web-based with a 75% response rate.
Prior to 2004 the timesheet system was paper-based. The students would submit a hand-written timesheet each week, and the lecturer would store it for reference later. There was minimal useful, timely feedback for the students or the lecturer as the time to collate this information was excessive. In 2004 students completed web-based timesheets with their entries stored in an online database. This has enabled prompt feedback for both students and the lecturer. There is now an obvious benefit to students in completing the timesheets.
In 2000 and 2001 when the number of students was low, the lecturer was able to spend time identifying individual contributions to the work products produced by a team through a one-on-one interview with each student at the end of the program. This was not possible from 2002 when the program was extended to two campuses as there was a substantial increase in student numbers (see Table 1). Given the size of the class some changes were needed to enable assessment to be managed by one lecturer.
Having this web-based system is improving the accuracy of the times recorded; peer pressure is having an impact, as is being able to demonstrate to students how the times they enter are used. In a lecture, it was possible to demonstrate quickly how much time each student spent working on a particular work product, such as the user manual. This demonstration shocked some students; they suddenly realised they needed to take their time recording seriously and enter all the times they spent working on their project. They also saw that they needed to enter data accurately and ensure that their team members were entering valid data.
This section reflects on the reasons behind the design of each self and peer assessment tool described earlier.
5.1
Timesheets
Each student is required to spend at least eight hours each week on the project. Judging from the timesheets that the students submit each week, 95% of the students spend considerably more than that. Many students complain about excessive workloads. The importance of monitoring their time is emphasised throughout the program so that students do not spend too much time on their project at the expense of their other studies, and to ensure they spend an appropriate spread of time on the different facets of the project. The time monitoring approach used mirrors Humphrey’s (1997) personal software process. Since 1998 the students have been required to complete weekly timesheets and weekly activity summaries. The weekly timesheets can provide valuable information about an individual contribution but quantity cannot be measured by hours alone, as the efficiency and productivity of individuals varies. In addition the quality of work cannot be determined by hours worked, nor the value of a contribution to the overall final product. Timesheets, in isolation, are not used to determine a student’s contribution to the team’s project however it is made clear to the students that the data they provide will be taken into account in determining their individual contribution to a work product; for example if they say they wrote a particular document, their timesheets should confirm this. The timesheets are also invaluable for resolving disputes about contributions in a team, but can cause disputes if team members are not recording their time accurately. Student attitude to filling in timesheets has tended to be negative; similar to that reported by Carrington (1998). In the 2002 program feedback survey, while 55% of the students thought the timesheets were useful, some did not see the point of them, and some openly stated their records were not accurate and that they only participated because it was a requirement of the course.
In the program feedback survey conducted at the end of semester 1 2004, 68% of students indicated that their time recordings were > 90% accurate, and a further 27% thought they were > 70% accurate. Over 90% of students found it useful to see how much time they were spending on their project and over 85% of students thought it was useful to see where their team members were spending their time. Over 80% found it useful to compare their team hours with other teams. This represented a marked change in attitude to the value of monitoring time.
5.2
Self/Peer Evaluation Surveys
In 2003 an assessment component ‘Professionalism’ was introduced. It included marks for: • • •
Interacting with the client (up to 3 marks) Team diary (up to 2 marks) Teamwork (up to 5 marks)
The client and lecturer assessed the first two of these and the process used is described in (Clark 2005). In semester 1 2003 a student’s teamwork component was assessed by the lecturer. Many students indicated this was a problem as they felt they could not discuss team management issues with the lecturer, the person most likely to be able to help them, without it affecting their assessment; even though they were told many times it would not. In semester 2 2003 peer evaluation forms were introduced to assess teamwork. These were used by the lecturer to discuss each student’s level of professionalism at the meetings between the team and the lecturer, where guidance could be given on how to improve. Two different forms were used: a ‘Peer Rating’ form and ‘Self/Peer Evaluation’ form. On the basis that team members are best placed to provide authentic feedback and assess how well a student was working in their team, the teamwork mark was based on the responses given about team members on the forms.
The first form, the Peer Rating form, was advocated by Brown (1995). It asked the students to rate the overall performance of each team member (including self) against a prescribed list of terms such as ‘excellent’, ‘very good’, ‘satisfactory’ down to ‘superficial’ and ‘no show’. The form also included a reference list of behavioural characteristics of good teamwork, such as attending meetings and contributing to discussion, for students to take into account when rating the overall performance – a modification described by Layton and Ohland (2001). As proposed by Kaufmann (2000) the form included the instruction that the rating should reflect the individual’s level of participation and not academic ability. The students completed the forms when they submitted the work products for each phase of the project. Most students were comfortable with using these forms however many students gave the top rating to everyone. Some students complained that there were not enough positive ratings – one team kept inventing ratings that were better than ‘excellent’, such as ‘superb’. Another more common complaint was that they did not find the team behaviour characteristics useful in deciding on the rating, as a team member might be excellent at some but not all. The second form, the Self/Peer Evaluation form was similar to the one currently in use but the ratings used were different. They were: Strongly Agree (2), Agree (1), Neutral (0), Disagree (-1), Strongly Disagree (-2). In semester 2 2004 the ratings on the Self/Peer Evaluation forms were changed because students expressed concern about interpreting the difference between Strongly Agree and Agree. Two short answer questions were added to the survey, based on a suggestion from a student. Student feedback and lecturer observation indicated the Self/Peer Evaluation forms were better for evaluating teamwork performance than the Peer Rating form and so the Peer Rating form was discontinued at the end of 2003. In 2003 the system was paper-based the results were extremely time-consuming for the lecturer to collate, as there were 136 students and each student completed a form for each team member (4 to 5 forms per student) and each form had 24 statements. As a result, the students only completed the forms twice per unit, once early in the semester and once at the end. They could not receive timely feedback and only a handful of students took up the opportunity to see the feedback when it was available. In 2004 the peer survey form was web-based which eliminated the need for the lecturer to collate the responses. This meant that the number of times students completed the survey forms could be, and have been, increased. Students can view aggregated feedback from their team members in a timely manner. In the semester 1 2004 feedback survey students were asked if the peer survey forms were a good way to give feedback on a team member’s performance – 88% agreed. They were also asked whether they had made changes as a result of reading the peer survey feedback: 7% said they changed a lot, 63% felt they made slight changes, 28% looked at it but felt that it had had no effect, and 2% had not looked at the feedback page.
Survey Number
Self Average
Peer Average
1
1.46
1.46
2
1.48
1.40
3
1.52
1.46
4
1.48
1.38
5
1.43
1.36
6
1.47
1.42
7
1.48
1.44
8
1.56
1.43
Table 2: 2004 Peer Survey Data In 2003 the average peer score at the end of the year was 1.08 (maximum 2.00), the average self score was 1.26. In 2004 students completed the peer survey form four times each semester. Table 2 shows the average results for 2004. It is interesting that the average scores were higher at the end of 2004 than at the end of 2003. This could be for a number of reasons: • • • •
the students had access to regular feedback from their team members on their performance; the lecturer drew attention to areas where they got low scores at the team meeting; the students knew what most questions would be and could focus on these aspects of teamwork; there were more lectures given on teamwork.
It is also interesting that the peer averages did not improve over the year. This could be because the expectations that students have of themselves and their other team members increase as they improve. It could also be due to the fact that at the start of year everyone is keen and working conscientiously in project, but as the year progresses that drops off for some students. There is steady improvement in the peer averages over second semester, and the self averages are also improving, indicating that students believe they are getting better and to a certain extent their team members agree. While the Self/Peer Evaluation Survey is usually used for assessment, at the start of second semester in 2003 and 2004 it was only used for feedback. Students were told that on this occasion their responses would not influence their grade and they were encouraged to be honest in their feedback for a number of reasons: •
•
The student needed to know what areas to improve in or their poor performance would continue to affect the rest of the team; If the student became aware of what they needed to improve the student might become a better contributor to the team and the team mark might improve and/or the student’s individual mark might go up (rather than down).
It is interesting that in 2004 there was little difference in the scores between Survey 4 (used for assessment) and Survey 5 conducted in the first week of semester 2 (used for feedback only). The students had just been on the semester break for six weeks and not been working on
project although they had received their grade for the first semester unit. There was a small decrease (0.05) in the average self assessed ratings which is a little larger than the 0.02 decrease in the average peer assessed ratings.
provided by all team members were averaged, to give each student a percentage contribution for that work product. Feedback from students was that they did not like this for the following reasons:
5.3
•
Individual Contribution Reports
In 2000 the team project manager was responsible for submitting reports describing what each person had contributed to each work product. In some teams, team members complained that these reports were not always accurate, and that the project manager did not take the process seriously enough, such as by writing the report just before it was due with no time for other members to confirm its accuracy. In 2001 & 2002 the team was responsible as a group for producing the reports describing what each person had contributed to each work product. These reports had to be agreed to by the entire team. This latter condition often caused so many problems that many teams did not produce a team report, but rather submitted 2 or 3 different reports for each work product. In the review of the 2002 program, 72% of students felt the reports were a fair way of indicating individual contributions. At the end of semester 2 2002 each individual wrote a report describing what they had contributed to the overall project. Some students were concerned that their team members reports were not accurate. In 2003, each student submitted a report describing what he or she had contributed to each major work product. Each report had to be agreed to by other team members. The agreement was given verbally at a meeting with the lecturer (semester 1) or via a signature (semester 2). In the review of the 2003 program, 85% of students felt the individual contribution reports were a fair way of indicating their contributions but many found it confrontational to indicate disagreement when the author was present. In 2004 students submitted their individual reports for each work product online. Once submitted the other team members read the reports privately and indicate whether they agree or disagree with them. If they disagree they must add a comment to explain why. Student feedback on the individual contribution reports of their team members is only available to the lecturer. As students know that their team members will read and comment on their reports it means that the claims they make must be able to be substantiated. This approach also eliminates the confronting aspect of disagreeing with a report with the author present. Similar to the approach described by Clear (2002) when a significant disagreement arises (such as majority disagreement and disputes over who did what) this is discussed at the meetings with the lecturer. In 2004 the students were again asked whether the individual contribution reports were a fair way of indicating their contributions, 90% agreed.
5.4
Quantity Reports
From 2000-2003 students gave a percentage figure for how much they felt each team member contributed to each work product. For each student the percentages
•
•
•
It was hard to judge the amount of work a person had done, particularly for team members who worked mainly at home; The percentage seemed to be a quantity assessment, and did not take into account the quality (or value) of the work that a person may have done; Some individual’s measured quantity by hours spent, which did not take into account that some students worked more productively than others; Some students completed work that was not included in the final work product, e.g. two versions of an algorithm may have been developed.
In semester 1 2004 each student completed a web-based ‘Work Product Mark Allocation’ form where they distributed marks amongst their team members based on their opinion of the value of the contribution. They were told to consider both the quantity and quality of the contribution. For example, for the software work product each student had five marks to distribute between their team members (including themselves). If a student believed everyone contributed equally then they would give equal marks, or if they believed that someone did more work, they would give that person a higher mark, and others a lower mark. Students could only give whole marks, half marks or quarter marks and they had to distribute all the marks. This approach did not appear to reduce the number of complaints. Furthermore in the semester 1 2004 feedback survey when the students were asked whether the Work Product Mark Allocation forms were an acceptable way to indicate how much each person contributed to a submission, only 64% agreed. Whereas when the students were distributing percentages in 2003, 74% agreed. Many students saw the mark allocation system as a negative process. They felt that they were punishing a person if they did not distribute the marks equally, rather than viewing it as rewarding the person who did more work. Some common problems with the scheme were: •
•
•
Students often commented that there were not enough differences in contributions to warrant taking marks from a person when there were so few marks. Students wanted a finer gradation. If someone did work over and above what was required students felt it should not result in others losing marks. Some students did not want to give out all five marks, e.g. taking 0.25 off a person meant they had to add it to someone else, when they wanted all the others to be equal.
This feedback suggested that this approach to get the students’ quantitative opinion of how much each team member had contributed to a work product could be improved. As a result, in semester 2 2004, instead of allocating 5 marks the students distributed $100 and had the opportunity to also give a bonus.
Both Brown (1995) and Hayes et al (2003) reported success when they used a similar process where students quantify the contribution of team members, although they also expressed some concerns about teams ganging up on a member or covering for an idle one. Both recommended that this tool is not used in isolation. In Software Engineering Project the lecturer examines the values allocated by looking at parts of the work produced by the individuals, and by reading the contribution reports and studying the timesheets. If they don’t accurately reflect the individual contribution the numbers are adjusted. This process is particularly important where there is wide variation in allocations, or where the individual allocates themselves significantly more than their team members. As with the ‘Self/Peer Evaluation Form’ the advantage of a database driven web-based system for the lecturer is that the collation and summarising of the student feedback can be displayed and downloaded resulting in a significant reduction in the lecturer’s time. An example of the aggregated data for a team that can be viewed by the lecturer is shown in Figure 4. The introduction of these quantitative reports has a number of potential issues: •
•
•
6
Students may be concerned about letting the lecturer know that another student was not working effectively. Remedy: How reports are used in assessing an individual is clearly explained. Students doing all the work are unlikely to give the lazy people an equal amount. Students attempt to manipulate the numbers to their benefit. Remedy: Students are told that numbers considerably different from those given by the rest of the team will not be used. The lecturer can identify who enters the values. (Prior to 2002 the input was anonymous.) Some team members apply pressure on other team members to record the same information as they do. Remedy: It is clearly stated every time forms have to be filled in, that they are confidential and values should not be discussed.
Conclusion
The challenge of assessing individual contributions is not a reason to avoid providing project courses with a strong emphasis on developing teamwork skills and authentic projects, such as where students work in small teams and each team is allocated a different project with a different external client. Students are capable of providing valuable data to inform assessment. When students are involved in assessing their own and their team’s work it is possible to provide a close link between the intended learning outcomes and assessment. It is essential to use a variety of tools to ensure the integrity of the assessment and it is also important to provide formative assessment and feedback to students throughout the course to increase opportunities for student learning. Web-based peer assessment can provide timely feedback to students and enables the lecturer to manage the assessment of larger and more diverse student cohorts.
Clive
Tom
John
Pat
Name
Pat 30
25
30
30
Jeff 25
Pay 140
% 28
Clive
25
20
25
25
25
120
24
Tom
15
20
15
10
15
75
15
John
10
15
15
10
15
65
13
Jeff
25
20
15
25
20
105
21
Figure 4: Work Product Pay Packet Summary
7
Acknowledgements
We would like to acknowledge the contribution of the students who studied this program from 1998-2004.
8
References
BIGGS, J. (1999): Teaching for Quality Learning at University. Buckingham, England, Society for Research into Higher Education and Open University. BOX, I. (2004): Object-Oriented Analysis, CriterionReferencing and Bloom. Proceedings of the sixth Australasian Conference on Computing Education. Dunedin, NZ, 30:1 – 8 BROWN, J., DOBBIE, G. (1999) Supporting and Evaluating Team Dynamics in group projects. Proceedings of the 30th SIGCSE Technical Symposium on Computer Science education, New Orleans, Lousiana, 31(1):281-285 BROWN, R. (1995): Autorating: Getting Individual Marks from Team Marks and Enhancing Teamwork. Proceedings of Frontiers in Education Conference. CARRINGTON, D. (1998): Time Monitoring for Students. Proceedings of Frontiers in Education Conference, Tempe, Arizona, 8-13 CLARK, N. (2002): Software Engineering Projects: Working in Teams. Proceedings of the sixth IASTED International Conference: Software Engineering and Applications, Cambridge USA, 698-703 CLARK, N. (2005): Evaluating student teams developing unique industry projects. Proceedings of the seventh Australasian Conference on Computing Education. Newcastle, Australia CLEAR, T. (2002): A Diagnostic Technique for Addressing Group Performance in Capstone Projects. Proceedings of Annual Joint Conference Integrating Technology into Computer Science Education, Aarhus, Denmark, 196 FISHER, R. (1999): Academic Workloads and Assessment. Retrieved 29 July 2004 from http://www.tedi.uq.edu.au/conferences/teach_conferenc e99/papers/fisher.html GATES, A.Q., DELGADO, N., MONDRAGON, O. (2000): A Structured Approach for Managing a Practical Software Engineering Course. ASEE/IEEE Frontiers in Education Conference, October, Kansas City. 1:21-26
HAGAN, D. (2004): Employer Satisfaction with ICT graduates. Proceedings of the sixth Australasian Conference on Computing Education., NZ, 30:119-124 HAYES, J.H., LETHBRIDGE, T.C., PORT, D. (2003): Evaluating Individual Contribution Toward Group Software Engineering Projects. Proceedings of International Conference on Software Engineering, Portland, Oregon. 622-627 HUMPHREY, W. (1997): Introduction to the Personal Software Process. Addison-Wesley. KAUFMANN, D.B., FELDER, R.M., FULLER, H. (2000): Accounting for individual effort in cooperative learning teams. Journal of Engineering Education. 89 (2), 133-140. LAYTON, R.A., OHLAND, M.W. (2001): Peer Ratings Revisited: Focus on Teamwork, Not Ability. Proceedings of American Society for Engineering Education Annual Conference, Albuquerque. LISTER, R., LEANEY, J. (2003): Introductory programming, criterion-referencing, and Bloom. Proceedings of the 34th SIGCSE Technical Symposium on Computer Science Education, Nevada, 20:143-147 MCGOURTY, J., DOMINICK, P., REILLY, R. (1998): Incorporating Student Peer Review and Feedback into the Assessment Process. Proceedings of Frontiers in Education Conference, Tempe, Arizona, 14-18 MCGOURTY, J., DOMINICK, P., BESTERFIELDSACRE, M., SHUMAN, L., WOLFE, H. (2000): Improving Student Learning through the use of Multisource Assessment and Feedback. ASEE/IEEE Frontiers in Education Conference, Kansas City. 1:2126 OHLAND, M.W., LAYTON, R.A. (2000): Comparing the Reliability of Two Peer Evaluation Instruments. Proceedings of American Society for Engineering Education Annual Conference, St Louis. SANDERS, D. (1984): Managing and Evaluating Students in a Directed Project Course. SIGCSE Bulletin, 16(1): 15-18 WILKINS, D.E., LAWHEAD, P.B. (2000): Evaluating Individuals in Team Projects. Proceedings of the 31st SIGCSE Technical Symposium on Computer Science Education, Austin, Texas, 172-175