IEEE TRANSACTIONS ON KNOWLEDGE AND DATA ENGINEERING, VOL. X, NO. X, AUGUST XXXX
1
Improving Bitmap Index Compression by Data Reorganization
Guadalupe Canahuate, Hakan Ferhatosmanoglu, Member, IEEE, Ali Pinar, Member, IEEE
Manuscript received August X, 2006; revised August X, XXXX. G. Canahuate is with the Department of Computer Science and Engineering, The Ohio State University. E-mail:
[email protected]. H. Ferhatosmanoglu is with the Department of Computer Science and Engineering, The Ohio State University. E-mail:
[email protected]. A. Pinar is with the High Performance Computing Research Department, Lawrence Berkeley National Laboratory. E-mail:
[email protected]. August 24, 2006
DRAFT
IEEE TRANSACTIONS ON KNOWLEDGE AND DATA ENGINEERING, VOL. X, NO. X, AUGUST XXXX
2
Abstract The volume of data generated by scientific applications through observations or computer simulations can reach to the order of the petabytes. This brings up the need for effective and compact indexing methods for efficient storage and retrieval of scientific data. Bitmap indexing has been successfully applied in this domain by exploiting the fact that scientific data are mostly read-only and enumerated or numerical. Bitmap indices can be compressed for efficient storage. In this paper, we study how to reorganize bitmap tables for improved compression rates. Our algorithms are used as a preprocessing step, thus there is no need to revise the current indexing techniques and the query processing algorithms. We propose Gray code ordering algorithm for this NP-Complete problem, which is an in-place algorithm, and runs in linear time in the order of the size of the database. We explore the effect of the order in which columns are evaluated in the Gray code ordering, to further improve the query execution time. Our experimental results on real data sets show that the compression ratio can be improved by a factor of 2 to 10 and the query execution times by a factor of 4 to 7.
Index Terms Data compaction and compression, database design, scientific databases, modeling and management, performance
I. I NTRODUCTION The volume of data generated by scientific applications through observations or computer simulations can reach to the order of the petabytes. These scientific applications are core applications in biology, high-energy physics, climate modeling, and astrophysics. In computational high-energy physics, simulations are continuously run, and events that are notable for physicists are stored with all the details. The number of events that need to be stored in one year is in the order of several millions [28]. In astrophysics, technological advances enabled devoting several telescopes for observations, results of which need to be stored for later query processing [30]. Genomic and proteomic technologies are now capable of generating terabytes of data in a single day’s experimentation [37]. These new data sets and the associated queries are significantly different from those of the traditional database systems, most importantly due to their enormous size and high-dimensionality. Compared with conventional databases, a data record in a scientific database involves many more attributes, up to order of hundreds. And the number of tuples is huge due to the technological advances that make it possible to generate huge volumes of data August 24, 2006
DRAFT
IEEE TRANSACTIONS ON KNOWLEDGE AND DATA ENGINEERING, VOL. X, NO. X, AUGUST XXXX
3
on a daily basis. High energy physics simulations generate millions of events to be stored in a single year. Due to such large volume of data, even simple queries are extremely slow without an effective index structure in place. However, neither the well-known multi-dimensional indexing techniques [27], [11] nor their extensions [18], [17], [6], [8], [7] have been successful in scientific database systems, partly due to the effects of the infamous dimensionality problems [5], [32] and the massive scales of these systems. Bitmap indexing, which has been effectively utilized in many major commercial database management systems, e.g., Oracle [2], [4], IBM [23], Informix [12], Sybase [10], [13], has also been the most popular approach for scientific databases [29], [20], [33], [34], [31]. The reason is that bitmap indices exploit the fact that each attribute is numeric or enumerated, and are not exponentially affected by the dimensionality of the data since each dimension is indexed independently. The topic of bitmap indices was introduced in [19]. The basic idea is that data are partitioned or quantized into several bins, where the number of bins per each attribute could vary, and each bin is represented by a bitmap vector. Several bitmap encoding schemes have been developed, such as equality [19], range [9], interval [9], and workload and attribute distribution oriented [16]. However, due to the amount of space they require, bitmap indices need to be compressed in order to be effectively utilized. Several compression techniques have been developed in order to reduce bitmap index size and retain the advantages of fast bit operations [3], [34], [1], [31]. Most bitmap compression techniques are run-length based. These techniques exploit uniform segments of a sequence, thus their performances depend directly on the presence of such uniform segments. Their effectiveness varies for different organizations of the database tuples, since ordering of tuples affect uniform segments in the columns. In this paper, we study how to reorder database tuples to achieve higher compression rates. Our techniques are used as a preprocessing step before compression, only to improve the performance, without affecting algorithms used for compression and query processing. We state this tuple reordering problem as a combinatorial optimization problem and propose heuristics for effective solutions for this NPComplete problem [21]. We show a reduction of the tuple reordering problem to the traveling salesperson problem, which is a well-studied combinatorial optimization problem. However, given the enormous sizes of the databases, we are only restricted to memory and time efficient heuristics, which takes away the applicability of most frequently used techniques for solving August 24, 2006
DRAFT
IEEE TRANSACTIONS ON KNOWLEDGE AND DATA ENGINEERING, VOL. X, NO. X, AUGUST XXXX
4
traveling salesperson problem such as simulated annealing. We propose Gray code sorting to order the rows of a bitmap table to produce larger segments of uniform 1’s. In addition, we propose column ordering techniques that improves query runtime performances beyond the gains due reduced total table size, by favoring frequently acccessed columns during the Gray code oredering process. Our algorithm is linear in the size of the database, and an in-place algorithm, which means it does not require any auxiliary memory allocation. Theoretically, we prove that our algorithm is optimal when all cells of a bitmap table are full. In practice, our experiments on scientific data showed significant improvements in compression rates. In many instances, compressed index size for the reordered file is less than half the compressed size of the original file. We have also observed a 9.60 times reduction in compressed index size on data set HEP3, bitmap table for which has 110 columns and 2,000,000 rows. These improvements in compression rates translate directly into improved query execution times. In our experiements, the query execution time is reduced by a factor of 4 to 7. This paper is a significantly extended version of the earlier work in which we introduced the tuple reordering problem and proposed an in-place Gray code sorting algorithm to reorganize the data [22]. Our main contributions in this paper can be summarized as follows: 1) We present a comprehensive study for data reorganization, which covers column ordering as well as tuple ordering. We demonstrate the effect of reorganizing the data using Gray codes by presenting results for the whole dataset and each bitmap column independently. 2) We apply Gray code ordering to both equality and range encoded bitmaps and perform experiments showing that our technique is effective for both of them. 3) We compare the reordering time and the compression time. We show that reordering takes little time when compared to WAH compression time and therefore, Gray code ordering should be considered as a natural preprocessing step for run-length encoding based compression algorithms. 4) We present a thorough experimental study that includes comparisons on index sizes and query runtimes. The paper is organized as follows. In the next section, we present the related work. Section III presents compression algorithms for bitmap tables. Section IV discusses the tuple reordering problem. We first define the problem, and show a reduction to traveling salesperson problem.
August 24, 2006
DRAFT
IEEE TRANSACTIONS ON KNOWLEDGE AND DATA ENGINEERING, VOL. X, NO. X, AUGUST XXXX
5
Next, we introduce Gray code ordering tailored for the tuple reordering problem and several metrics to decide the order in which the columns should be evaluated. Experimental results are presented in Section V. Finally, we discuss future work and conclude with Section VI. II. R ELATED W ORK TSP is a very well-studied problem and has been a testbed to demonstrate the effectiveness of optimization methods such as simulated annealing and genetic algorithms. A survey of the literature on TSP solution methods can be found in [24]. In the context of increasing memory performance of sparse matrix-vector multiplication, a reordering method was proposed to reorder rows to align nonzeros of the matrix to consecutive positions in columns [21]. Conventional data structures for sparse matrices require one memory indirection (extra load operation), during matrix-vector product operations. Pinar and Heath described how to reduce the number of memory indirections by exploiting nonzeros in consecutive positions in a column. Their method is based on a graph model that reduces the problem to TSP. Tuple reordering problem is similar, since a bitmap can be considered as a sparse matrix, with tuples corresponding to rows and bins for all attributes corresponding to columns. For equality encoded bitmaps, we have a nonzero at row i and column j iff ith tuple is in bin j. However, the practical aspects of these two problems are significantly different, hence require different solution techniques. Sparse matrices arising in many applications define systems of linear equations and are square. Rectangular matrices arise especially in optimization, but even then the number of columns and the number of rows are close, at least in the same order. In databases however, the number of tuples, which corresponds to rows in a sparse matrix, is several orders of magnitude larger than the number bins, which corresponds to number of columns in a sparse matrix. Sparse matrices are much smaller in dimension compared to number of tuples in a database. Recently, traveling salesperson problem solutions have been applied to the reordering of boolean matrices [14]. This approach adapts classical TSP heuristics by means of instancepartitioning and sampling. The work by Richards [25] discusses data compression and gray-code sorting. We proposed the use of Gray code ordering to reorganize the data in order to improve the bitmap indices compression ratio [22].
August 24, 2006
DRAFT
IEEE TRANSACTIONS ON KNOWLEDGE AND DATA ENGINEERING, VOL. X, NO. X, AUGUST XXXX
Attribute 1
Attribute 2
Attribute 2
Tuple
b1
b2
b3
b1
b2
b3
b1
b2
b3
b1
b2
b3
t1
1
0
0
0
0
1
1
1
1
0
0
1
t2
0
1
0
1
0
0
0
1
1
1
1
1
t3
1
0
0
1
0
0
1
1
1
1
1
1
t4
0
0
1
0
0
1
0
0
1
0
0
1
t5
0
1
0
0
1
0
0
1
1
0
1
1
t6
0
0
1
1
0
0
0
0
1
1
1
1
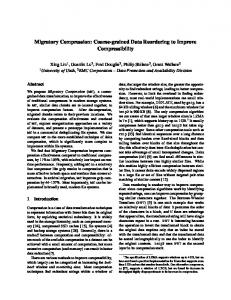
(a) Basic (Equality) Encoding Fig. 1.
Attribute 1
6
(b) Range Encoding
Bitmap examples for a table with two attributes and three bins per attribute.
III. C OMPRESSING B ITMAP TABLES Bitmap tables are a special type of bit matrices. Each binary row in the bitmap table represents one tuple in the database. The bitmap columns are produced by quantizing the attributes in the database into categories or bins. Each tuple in the database is then encoded based on which bin each attribute value falls into. For the simple bitmap encoding (also called equality encoding) [19], if a value falls into a bin, this bin is marked “1”, otherwise “0”. Since a value can only fall into a single bin, only a single “1” can exist for each row of each attribute. After binning, the whole database is converted into a huge 0-1 bitmap, where rows correspond to tuples and columns correspond to bins. Figure 1 shows an example using a table with two attributes, each partitioned into three bins. Figure 1(a) shows the equality encoded bitmap for this table. The first tuple t1 falls into the first bin in attribute 1, and the third bin in attribute 2. Note that after binning we can treat each tuple as a binary number. For instance t1 = 100001 and t2 = 010100. For range encoding bitmaps [9], a bin is marked “1” if the value falls into it or a smaller bin, and “0” otherwise. Figure 1(b) shows the range encoded bitmap corresponding to the same example. Using this encoding, the last bin for each attribute is all 1s. Thus, we do not explicitly store this column. Since bin 3 is not stored for any of the attributes, the first tuple t 1 is represented by the binary number 1100. Bitmap indices can provide very efficient performance for point and range queries thanks to fast AND and OR bit operations over the bitmaps. August 24, 2006
DRAFT
IEEE TRANSACTIONS ON KNOWLEDGE AND DATA ENGINEERING, VOL. X, NO. X, AUGUST XXXX
7
With equality encoded bitmaps a point query is executed by ANDing together the bit vectors corresponding to the values specified in the search key. For example, finding the data points that correspond to a query where Attribute 1 is equal to 3 and Attribute 2 is equal to 5 is only a matter of ANDing the two bitmaps together. Bitmap Equality Encoded are optimal for point queries [9]. Range queries are executed by first ORing together all bit vectors specified by each range in the search key and then ANDing the answers together. If the query range for an attribute queried includes more than half of the cardinality then we execute the query by taking the complement of the ORed bitmaps that are not included in the range query. With range encoded bitmaps the columns used and the operations performed to execute a query depend on the range being queried. No matter which bitmap encoding we use, the bitmap index table is a 0-1 table. This table needs to be compressed to be effective on a large database. General purpose text compression techniques are clearly not suitable for this purpose since they significantly reduce the efficiency of queries [15], [33]. Specialized bitmap compression schemes have been proposed to overcome this problem. These schemes are based on run-length encoding, i.e., they replace repeated runs of 0’s or 1’s in the columns by a single instance of the symbol and a run count. These methods not only compress the data but also enable fast bitwise logical operations, which translates into faster query processing. Run length encoding [26] can therefore be used over every column to compress the data when long runs of “0” or “1” blocks become available. Pure run length encoding is not a good strategy because of its accessing inefficiency. The two most popular compression techniques for bitmaps are the Byte-aligned Bitmap Code (BBC) [3] and the Word-Aligned Hybrid (WAH) code [34]. Unlike traditional run length encoding, these schemes mix run length encoding and direct storags. BBC stores the compressed data in Bytes while WAH stores it in Words. WAH is simpler because it only has two types of words: literal words and fill words. In our implementation it is the most significant bit that indicates the type of word we are dealing with. Let w denote the number of bits in a word, the lower (w-1) bits of a literal word contain the bit values from the bitmap. If the word is a fill, then the second most significant bit is the fill bit, and the remaining (w-2) bits store the fill length. WAH imposes the word-alignment requirement on the fills. This requirement is key to ensure that logical operations only access words. Figure 2 shows a WAH compressed bit vector representing 128 bits. The first line is the August 24, 2006
DRAFT
IEEE TRANSACTIONS ON KNOWLEDGE AND DATA ENGINEERING, VOL. X, NO. X, AUGUST XXXX
Fig. 2.
8
128 bits
1,20*0,4*1,78*0,30*1
31-bit groups
1,20*0,4*1,6*0
62*0
10*0,21*1
9*1
groups in hex
400003C0
00000000 00000000
001FFFFF
000001FF
WAH (hex)
400003C0
80000002
001FFFFF
000001FF
An example of a WAH compressed bit vector.
original bit vector. The vector starts with one 1, followed by twenty 0’s, four 1’s seventy eight 0’s, and thirty 1’s. In this example, we assume 32 bit words. Under this assumption, each literal word stores 31 bits from the bitmap, and each fill word represents a multiple of 31 bits. The second line in Figure 2 shows how the bit vector is divided into 31-bit groups, and the third line shows the hexadecimal representation of the groups. The last line shows the values of WAH words. Since the first and third groups do not contain greater than a multiple of 31 of a single bit value, they are represented as literal words (a 0 followed by the actual bit representation of the group). The fourth group is less than 31 bits and thus is stored as a literal. The second group contains a multiple of 31 0’s and therefore is represented as a fill word (a 1, followed by the 0 fill value, followed by the number of fills in the last 30 bits). The first three words are regular words, two literal words and one fill word. The fill word 80000002 indicates a 0-fill of two-word long (containing 62 consecutive zero bits). The fourth word is the active word, and it stores the last few bits that could not be stored in a regular word. Another word with the value nine, not shown, is needed to store the number of useful bits in the active word. Logical operations are performed over the compressed bitmaps resulting in another compressed bitmap. IV. I MPROVING B ITMAP C OMPRESSION
BY
T UPLE R EORDERING
Run-length encoding and its variants compress the bitmap by replacing a sequence of 0’s or 1’s by a single instance of the symbol and a run count. The performance of these encodings depend on the presence of such uniform sequences. By reorganizing the data we can produce longer uniform segments, therefore, improve the performance of the compression scheme. In this section, we study the problem of reorganizing bitmap tuples for more efficient run-length encoding, which we call the tuple reordering problem. First we define the problem formally, and then show a reduction to the traveling salesperson problem. We continue with proposed August 24, 2006
DRAFT
IEEE TRANSACTIONS ON KNOWLEDGE AND DATA ENGINEERING, VOL. X, NO. X, AUGUST XXXX
t1
t2 t3 t4 t5 t6 Fig. 3.
1 0
1 0
0 1
0 1
1 0
0 1
1 0
1 0
1 0
1 0
0 1
0 1
(a) Original table
0 1
0 1 1 0 0 1 1 0 1 0
t1
t2
t3
t4
t5
t6
3
1
1
3
2
t5
1
3
1
1
t4
0
2
2
t3
2
2
t2
2 (b) Difference values
t1
t4 t5 t3 t6 t2
9
1 0
1 0
1 0
1 0
1 0
1 0
1 0
0 1
0 1
0 1
0 1
0 1
(c) Reordered table
0 1
0 1 1 0 1 0 1 0 0 1
Example for tuple reordering
solutions. A. Problem Formulation The goal is to increase the performance of run-length encoding by reordering tuples so that longer uniform segments, and thus fewer number of blocks are generated. Run-length encoding packs each uniform segment into a block and stores the length of the block. Thus the storage size is determined by the number of such blocks. Consider two consecutive tuples in the bitmap table. If the tuples are on the same bin for an attribute, they will be packed to the same block. If not, a new block should start. Efficiency can be enhanced by reordering tuples so that they fall into the same bins as much as possible. An example is illustrated in Figure 3. In this example, the original table has 12 blocks, whereas the reordered table in Figure 3(c), requires only 7 blocks. Let diff(ti , tj ) denote the number of attributes that tuple ti and tuple tj fall in different bins, and let πi denote the ith tuple in ordering π. Observe that diff(πi , πi+1 ) gives how many new blocks start after the ith tuple in the reordered file when run-length encoding is used. An example for computing the diff values is illustrated in Figure 3(b). For example diff(t 1 , t2 ) = 2, since tuples t1 and t2 fall into different bins for the first two attributes. We can now formally define the tuple reordering problem. Definition 4.1 (Tuple reordering problem): Let π be an ordering of m tuples so that π i denotes the ith tuple in the ordering. Tuple reordering problem is the problem of finding an ordering π that minimizes
m−1 X
diff(πi , πi+1 ).
(1)
i=1
August 24, 2006
DRAFT
IEEE TRANSACTIONS ON KNOWLEDGE AND DATA ENGINEERING, VOL. X, NO. X, AUGUST XXXX
10
In Equation 1, we sum diff values over all consecutive tuples to attain the number of new runs that start for the whole table. The first tuple requires starting a run for each attribute, therefore the number of blocks can be computed as A +
m−1 X
diff(πi , πi+1 ), where A is the number of
i=1
attributes. Thus an ordering that minimizes Equation 1 also minimizes the number of blocks in the reordered table. For instance, Equation 1 returns 2 + 2 + 2 + 1 + 2 = 9 for the initial ordering in Figure 3(a), which means with the addition of the number of attributes, there will be 9 + 3 = 12 blocks in the compressed table. For the reordered table in the same figure however, Equation 1 returns 0 + 1 + 1 + 1 + 1 = 4, which means the reordered table will have only 7 blocks after compression. 1) Reduction to the Traveling Salesperson Problem: Given a graph with weights on edges between all pairs of vertices, the traveling salesperson problem (TSP) tries to find an ordering of the vertices that minimizes the sum of weights between consecutive vertices in the ordering. Intuitively, we can consider TSP as finding a shortest path that visits all cities in a given map. Here, cities correspond to vertices of a graph, and the weight of an edge is assigned as the distance between the associated vertices. Below, we describe a graph model to reduce the tuple reordering problem to the TSP. In our reduction, we have vertices to represent tuples, since we are seeking an ordering of the tuples. We define a weight function on edges, so that an optimal solution to the TSP problem minimizes the number of runs in the run-length encoding of the reorganized bitmap. Given a bitmap B as a set of tuples, define its graph GB = (V, E) so that each tuple ti in B is represented by a vertex vi , and each pair of vertices vi and vj is connected by an edge (vi , vj ) in E. Define the weight of an edge (vi , vj ) as diff(ti , tj ) as defined in Section IV-A. This graph definition reduces the tuple reordering problem to the TSP, as we formalize below. Theorem 4.2: Given a bitmap B, define graph GB = (V, E) so that each tuple ti is represented by a vertex vi ∈ V . All pairs of vertices vi and vj are connected by an edge with weight diff(ti , tj ). An optimal TSP solution on GB , gives an optimal solution to the tuple reordering problem. Proof: A solution to the TSP gives an ordering of vertices that minimizes the sum of edge weights between consecutive vertices. When we replace vertices with tuples, we get an ordering of tuples that minimizes the sum of diff values between consecutive tuples. Minimizing the total edge weight corresponds to minimizing Equation 1, thus the number of runs in the run-length encoding of the reorganized bitmap table. August 24, 2006
DRAFT
IEEE TRANSACTIONS ON KNOWLEDGE AND DATA ENGINEERING, VOL. X, NO. X, AUGUST XXXX
2
t1
t2 2
3 2
11
1
2
1 3
3
t3
t4 1
1 1
3
t5 Fig. 4.
2
t6
TSP graph for the bitmap table in Figure 3. Dark arrowed edges indicate an optimal TSP solution as t1 , t4 , t5 , t3 , t6 ,
and t2 .
B. Heuristics for Tuple Reordering In this section we first discuss feasibility of reorganizing a database and necessary conditions for an ordering algorithm to be effective. Then we describe how to adopt Gray codes for tuple reordering, and show that this technique is optimal under certain conditions. Given the fact that Gray codes favor the first bitmap columns, i.e. the impact of Gray code decreases with the number of columns, we provide several criteria to choose the order in which the columns should be evaluated. Finally, we discuss using conventional TSP heuristics for tuple reordering. Due to the enormous cost of merely moving the data to implement a reorganization, databases are seldom physically reorganized in practice. Thus we need to be careful while designing algorithms to find such reorderings. For an ordering algorithm to be applicable to reorganizing a database, it needs to be memory efficient. The memory requirement needs to be at most linear in the order of the number of tuples. Preferably, the algorithm should be in-place, i.e., it should not use any auxiliary memory. An effective technique should also be local, i.e., it must be sufficient to apply our techniques to portions of the database to improve compression rates, since it will be computationally inefficient, if not infeasible, to apply a technique to the whole database. This locality provides scalability, since the method can be applied to databases of arbitrary sizes. Reordering database tuples has only local effects, thus it is easy to localize reordering algorithms to only portions of the database. Even when an algorithm is local, it is still essential to keep the memory requirements low, since the effectiveness of the algorithm will
August 24, 2006
DRAFT
IEEE TRANSACTIONS ON KNOWLEDGE AND DATA ENGINEERING, VOL. X, NO. X, AUGUST XXXX
12
increase if it can be applied to larger portions of the database. The Gray code ordering proposed in the subsequent section is an in-place algorithm and thus optimal in terms of memory requirement. It can even be applied to the whole database, since it has a regular access pattern and requires a small number of passes over the bitmap table. Alternatively, conventional TSP solution techniques can be adopted for the tuple reordering problem. However, these techniques almost invariably require additional storage, which is often superlinear in the number of tuples. 1) Gray code ordering: A Gray code is an encoding of binary numbers so that adjacent numbers differ only by a single digit. For instance (000, 001, 011, 010, 110, 111, 101, 100) is a binary Gray code. Binary Gray code is often referred to as the “reflected” code, because it can be generated by the reflection technique, as we describe below. 1) Let S = (s1 , s2 , . . . , sn ) be a Gray code. 2) First write S forwards and then append the same code S by writing it backwards, so that we have (s1 , s2 , . . . , sn , sn , . . . , s2 , s1 ). 3) Append 0 at the beginning of the first n binary numbers, and 1 at the beginning of the last n binary numbers. As an example, take the Gray code (0, 1). Write it forwards, then add the same sequence backwards, and we get: (0, 1, 1, 0). Then we add 0’s and 1’s to get: (00, 01, 11, 10). We can use this new sequence as an input to our algorithm. After the reflection step we get (00, 01, 11, 10, 10, 11, 01, 00). We add the first digits to attain: (000, 001, 011, 010, 110, 111, 101, 100). It is important to note that Gray codes are not unique, and different orders on the same group of numbers might satisfy the Gray code property. We use the term fundamental Gray code to refer to a Gray code generated by the reflection technique described above with using (0, 1) as the initial sequence. We refer to ordering a set of numbers with respect to the fundamental Gray codes as Gray code ordering, which we describe next. We first define the Gray code rank of a number. Definition 4.3 (Gray code rank): The Gray code rank g(s) of an n-bit binary number s is the rank of this number in an n-bit fundamental Gray code. For example, g(0000) = 1, since it is the first number in the 4-bit fundamental Gray code. And g(0001) = 2, since it follows 0000 in the fundamental Gray code.
August 24, 2006
DRAFT
IEEE TRANSACTIONS ON KNOWLEDGE AND DATA ENGINEERING, VOL. X, NO. X, AUGUST XXXX
13
Definition 4.4 (Gray code sorting): A sequence S = (s1 , s2 , . . . , sm ) is Gray code sorted iff g(si ) ≤ g(si+1 ) for i = 1, 2, . . . m − 1, where g(si ) denotes the Gray code rank of si . As an example, the sequence (0001, 0010, 0101, 1100, 1110, 1011) is Gray code sorted because g(0001) = 2 < g(0010) = 4 < g(0101) = 7 < g(1100) = 9 < g(1110) = 12 < g(1011) = 14. This brings the question of how to efficiently order a set of numbers to be Gray code sorted. We reverse the fundamental Gray code generation process, to sort numbers with respect to the fundamental Gray code. As the first step, we divide numbers as those that start with 0 and those that start with 1. Clearly those that start with 0 will precede others in the ordering. Then we recursively order those that start with 0. The same is applied to the second group of numbers that start with 1, but we need to reverse their ordering due to the reflective property of the Gray code. In Algorithm 1, we present the pseudo-code of this algorithm. In this algorithm, S(A, i, j) denotes the jth significant bit of the ith tuple in table A. The reversion does not need to be a separate step in the algorithm, but we present it separately for clarity of the presentation. Lemma 4.5: Algorithm 1 orders numbers in A to be Gray code sorted, when initially invoked with GC-sort (A, 1, m, n), where m is the number of tuples, and n is the number of bits. Proof: The proof is based on induction on the number of bits. First observe that recursive calls respect the previous orderings, since after one pass, the recursive calls only operate on the segment of tuples that all start with the same bit prefix. The inductive basis is for n = 1, when the correctness of the algorithm is trivial. It is also easy to see that numbers that start with 0 should precede those that start with 1 for Gray code sorting. By the inductive hypothesis, the numbers that start with 0 are sorted correctly by the algorithm according to their last n − 1 bits, and adding 0 does not affect their Gray code precedence. Similarly, numbers that start with 1 are Gray code sorted recursively according to their last n − 1 bits, however putting 1 at the beginning requires the reflected order, which we achieve by the Reverse (j + 1, end) operation. Figure 5illustrates this algorithm. It is worth stressing that Algorithm 1 is an in-place algorithm, which is critical while dealing with large data sets.
August 24, 2006
DRAFT
IEEE TRANSACTIONS ON KNOWLEDGE AND DATA ENGINEERING, VOL. X, NO. X, AUGUST XXXX
14
GC-sort (A, start, end, b) 1:
i ← start
2:
j ← end
3:
while i < j
4:
Decrement j until S(j, b) = 0
5:
Increment i until S(i, b) = 1
6:
if i < j then Swap the ith and jth tuples on the table
7: 8:
end if
9:
end while
10: if b then 11:
GC-sort (A, start, j, b + 1)
12:
GC-sort (A, j + 1, end, b + 1)
13:
Reverse (j + 1, end)
14: end if Algorithm 1: An in-place Gray code sorting algorithm. GC-sort (A, start, end, b) sorts numbers between indices start–end in A according to their least significant b bits in Gray code order. S(A, i, j) denotes the jth significant bit of the ith number in table A.
Since consecutive numbers differ only at one bit, Gray code numbers have maximum bitlevel similarity between consecutive numbers. This property can be effectively used for ordering database tuples, since every tuple in the database can be considered as an n-bit binary number. By Gray code sorting, we can impose similarity between consecutive numbers. And if all distinct tuples exist, i.e., if all cells of the bitmap table are full, Gray code sorting will produce an optimal ordering. We formalize this claim with the following theorem. Theorem 4.6: Gray code ordering provides an optimal solution for the tuple reordering problem, if all cells of the bitmap table are full. Proof: The algorithm orders identical tuples consecutively. Thus by the definition of Gray codes, at most one bit differs between two consecutive tuples, since all cells of the database
August 24, 2006
DRAFT
IEEE TRANSACTIONS ON KNOWLEDGE AND DATA ENGINEERING, VOL. X, NO. X, AUGUST XXXX
Fig. 5.
15
Illustration of Algorithm 1.
table are full, which implies optimality. By the result of Theorem 4.6, Algorithm 1 gives an optimal solution when all cells are full, however in practice all cells will be full very rarely, and the solution may not be optimal. Gray code ordering is more effective when most of the cells are full, which means its effectiveness increases with increasing number of rows, i.e., larger databases. Its performance also depends on the number of columns, which depends on the number of attributes, and the number of bins per attribute. Increasing these terms increases the number of cells in the bitmap table, making the table more sparse. Nevertheless, even when the bitmap table has a lot of empty cells, Gray code ordering imposes bit-level similarity between consecutive tuples very effectively as evidenced by our experimental results. In Figure 6, we illustrate how Gray code ordering reorganizes the database tuples. In this figure, each bar represents one column in the bitmap. Shown are the first 4 columns of the bitmap table. The white portion of the bar represents the continuos sequence of 0s while the black portion represents the continuos sequence of 1s. The left part of the figure represents the numerical (lexicographic) sorting of the tuples, the same organization we would achieve by physically ordering the tuples by all the attributes at the same time. The right part represents the Gray code ordering. It can be seen that with Gray code ordering many runs concatenate to form longer runs than using numeric/lexicographic ordering, making Gray code ordering more effective. Note that the number of runs in each column increases as we go further to the right of August 24, 2006
DRAFT
IEEE TRANSACTIONS ON KNOWLEDGE AND DATA ENGINEERING, VOL. X, NO. X, AUGUST XXXX
Fig. 6.
16
Illustration of Gray code ordering effectiveness. On the left is the lexicographic (numeric) order of a boolean
table of 4 columns. On the right is the Gray code ordering of the same table. White and black blocks represent runs of 0s and 1s, respectively. Gray code produces less and longer runs than lexicographic order.
the bitmap table. This means that the first columns evaluated would have a very small number of runs, compressing better, but the last columns would potentially have a large number of runs. For this reason, we consider different criteria to select the order in which the columns should be evaluated. C. Criteria for Column Ordering An optimal solution for the TSP formulation of the tuple reordering problem will not be affected by the ordering of the columns. However, since the Gray code ordering algorithm proposed here orders one column at a time, its performance is affected by the order in which the columns are processed. As can be seen in Figure 6, Gray code ordering aligns the rows so that the runs in the first few columns are perfect, but its performance deteriorates as we move towards the end. This naturally raises the question of how to order the columns for maximum compression rates and/or faster query execution times. August 24, 2006
DRAFT
IEEE TRANSACTIONS ON KNOWLEDGE AND DATA ENGINEERING, VOL. X, NO. X, AUGUST XXXX
17
In this section we explore two approaches for deciding in which order to evaluate the bitmap columns in the Gray code ordering algorithm. For the first approach, we use the bitmap data itself to decide which column to evaluate first. For the second approach, we evaluate the columns by their access frequency extracted from the query history files. 1) Reordering by Bitmap Data: Here we investigate the column ordering problem in the absence of query histories. For efficiency considerations, we have to restrict our column selection criteria to only those that remain invariant during the ordering process. The most prominent property is the set bits, i.e., the number of 1s in the column denoted by s. We use s i to refer to the set bits in column i. Consider the set of columns that correspond to the bins for an attribute. For the basic bitmap encoding, only one of these columns would have a set bit for each tuple, the rest would be 0s. As a consequence, a run of 1s in a column corresponds to runs of 0s in all other columns for the same attribute. Therefore, selecting the columns with more set bits first would be a nice greedy strategy for equality encoding bitmaps. For range encoded bitmaps on the other hand, all columns have a set bit for tuples that fall to the smallest bin. In this case, ordering by column for the smallest bin, say column i, generates runs of s i tuples on all columns for this attribute. Therefore, one can anticipate that selecting the columns with fewer set bits (which are most likely the smaller values) would produce better results. As another criterion, we define compressibility as a function of the set bits in the column. The intuition is that the more even the number of 0s and 1s in the column, the harder it would be to compress, since there would be more chances of having interrupted, short runs. Intuitively, putting the harder to compress columns in the beginning makes sense, since the later columns, which are easier to compress, would compress well because the majority of the bits have the same value. Compressibility of a column can be expressed as: Ci = |
n − si | 2
where n is the number of tuples or bits in the column. Therefore, the bigger the number C i , the easier it is to compress the column. Using any of these criteria, we can evaluate the columns in two directions: increasing and decreasing order. When we order the columns by the number of set bits in decreasing order we evaluate the columns with more number of set bits first. When we order the columns by their compressibility in increasing order we evaluate the columns that are potentially harder to August 24, 2006
DRAFT
IEEE TRANSACTIONS ON KNOWLEDGE AND DATA ENGINEERING, VOL. X, NO. X, AUGUST XXXX
18
compress first. Note that this ordering would not necessarily improve the overall compression. The average run length after Gray code ordering will decrease exponentially if the bits are uniformly distributed. In this case, the first few difficult columns will compress well but the remaining columns would be forced to have more segments. Nevertheless, this evaluation order would decrease the maximum compressed column size of the bitmap table, since the harder to compress columns would be first. This lower bound on the maximum compressed bitmap column size would translate into better query performance since the worse-case query, i.e. one querying the biggest columns, would perform faster since the query time depends on the size of the columns involved in the query. Similarly, ordering the columns by compressibility in decreasing order, would evaluate the easier to compress columns first, extending the clustering power of Gray code ordering to the later columns. Since the bitmap encoding is done by attribute, one could think that reordering of the columns would be more effective if it was done by attribute, i.e. order the attributes and then the columns within the attributes. However, by using this criterion the clustering power of Gray code is drained faster than considering each column independently. For this reason, the experiments reported in the paper are using column ordering without considering the attributes to which the columns belong to. The Gray code algorithm described in the previous section, effectively divides the columns into segments and orders each segment independently in place. Trying to fit our column ordering criteria to improve the performance of the reordering algorithm, we should decide which column to evaluate next based on the the segments produced by the Gray code order itself instead of the whole column. We generalize the previous criteria and define them over the segments produced by the Gray code ordering. We denote by si (x, y) the number of 1s in column i between rows x and y. We denote by Ci (x, y) = |
(y − x + 1) − si (x, y)| 2
the compressibility of column i between rows x and y. We call static column ordering, to the scheme where the order of the columns is predetermined based on the chosen criterion. We call dynamic column ordering, to the scheme where the next column is selected based on the current order of the rows, i.e. based on the chosen criterion
August 24, 2006
DRAFT
IEEE TRANSACTIONS ON KNOWLEDGE AND DATA ENGINEERING, VOL. X, NO. X, AUGUST XXXX
19
over the segments produced by the Gray code performed so far. The dynamic scheme produces the same results as the static scheme when the segment considered is always the whole data set (x = 0 and y = rows − 1). Note that, in order to be able to implement the dynamic scheme, the Gray code algorithm cannot be recursive since we need the boundary positions for each segment of the current column in order to decide which column to order next. GC-sort-no-recur (A, start, end) 1:
i ← start
2:
j ← end
3:
b←0
4:
splitP oints[start] ← 1
5:
splitP oints[end] ← 1
6:
colOrder[b] ← getN extCol(b)
7:
while b < stop
8:
reverse ← f alse
9:
i ← start
10:
while i < end
11:
j ← getEndP oint(i)
12:
p ← order(i, j, b, reverse)
13:
splitP oints[p] ← 1
14:
reverse ← not reverse
15:
i←j+1
16:
end while
17:
b ←b+1
18:
colOrder[b] ← getN extCol(b)
19: end while Algorithm 2: The non-recursive version of Algorithm 1 including column ordering.
Algorithm 2 presents the pseudocode for the non-recursive version of the reordering algorithm. August 24, 2006
DRAFT
IEEE TRANSACTIONS ON KNOWLEDGE AND DATA ENGINEERING, VOL. X, NO. X, AUGUST XXXX
20
Even though maintaining the start and end points for each segment is exponential in the column ordered, the number of segments cannot be bigger than the number of rows. Therefore, we define an array of split points of size number of rows and initialize it to 0. We set the position of the array to 1 if it is a boundary position. Lines 4 and 5 set the start and end positions as boundary positions. Notice that as we move along in the column ordering, the split points only increase, i.e. potentially we add one split point to each segment when we order the next column. The procedure getN extCol(b) returns the (b + 1)th column in the ordering by evaluating the chosen criterion over the segments defined in splitP oints. The variable reverse is true if the Gray code should order the segment in reverse order, i.e. first the 1s and then the 0s. The procedure getEndP oint(i) returns the next index > i that is set in splitP oints. The order(i, j, b, reverse) procedure orders the rows between i and j by column colOrder[b] in reverse order, and return the split point for the segment (it returns an end point if there is no split, i.e. all the bits are the same value). For the dynamic scheme we apply the following column choosing criteria based on the segments (implemented in procedure getN extCol). For the number of set bits, we find the number of set bits in the longest segment produced by the Gray code ordering. Thus, the column ordering criterion would be si (x∗ , y ∗ ) where x∗ and y ∗ correspond to the start and end position of the longest segment in column i. For dynamic compressibility, we sum the compressibility of each segment produced by the Gray code ordering. Thus, the column ordering criterion in this case would be Σx,y
(y − x + 1) Ci (x, y) n
where the summation indices x and y are the start and end points of all the segments produced by the Gray code order executed so far. By adopting the dynamic scheme for column ordering, the time complexity of the reordering algorithm becomes O((nd) 2 ), where n is the number of rows and d is the number or columns in the bitmap table. In other words, we lose one desirable property of our Gray code ordering which is no longer linear in the size of the bitmap table. In addition, the memory requirement is O(n) to store the splitP oints array. For these reasons and because the difference in compressed size between the different Gray code orderings was
August 24, 2006
DRAFT
IEEE TRANSACTIONS ON KNOWLEDGE AND DATA ENGINEERING, VOL. X, NO. X, AUGUST XXXX
21
never more than 20% in our experiments, we do not include results from the dynamic scheme and propose only the static scheme. 2) Reordering by Query History Files: A query history file contains a cumulative history of the queries that have been executed by the users. Form this file we can derive how often each column of the bitmap index is accessed by the users. In order to achieve faster query runtimes, we want to place the frequently accessed columns early in the ordering. Therefore, in the presence of query histories, one can sort the columns based on frequencies of access to minimize average query runtimes. Generally, real world queries present a skew distribution, i.e. few columns are accessed very often while many others are rarely accessed. In order to represent this phenomenon we randomly generate a query history file that follows a Zipf distribution. The classic case of Zipf’s law is a 1/n function. Given a set distributed frequencies, sorted from most common to least common, the second most common frequency will occur 1/2 as often as the first one. The third most common frequency will occur 1/3 as often as the first one. The nt h most common frequency will occur 1/n as often as the first one. D. Conventional TSP heuristics TSP heuristics can be used to construct an ordering or improve a given ordering. However, the current approaches are not directly applicable to our target application, where the number of tuples (vertices of the TSP graph) may be easily in the order of millions, and the enormous sizes of these problems require memory- and time-efficient heuristics. Explicit construction of n the TSP graph is not feasible for reordering database tuples, since the TSP graph has 2 potential edges. We can drop edges whose weights are zero, but even then, the number of edges will be O(n2 ) for a bitmap table. The infeasibility of constructing the TSP graph restricts us to simple greedy strategies where edge weights can be computed on the air during the course of the algorithm. In our experiments, we used a 2-switch technique, which repeatedly seeks for a pair of vertices that decrease the solution value when they switch positions. To further improve efficiency, we restricted the search for pairs to only those within a specified distance. It will be worthwhile to observe performances of other TSP heuristics from the literature, but it should be noted that one can use only a limited selection due to the very large sizes of the problems, and August 24, 2006
DRAFT
IEEE TRANSACTIONS ON KNOWLEDGE AND DATA ENGINEERING, VOL. X, NO. X, AUGUST XXXX
22
more importantly Gray code is already very effective and an in-place algorithm. V. E XPERIMENTAL R ESULTS In this section we discuss our empirical work to validate our proposed methods. We applied our reordering techniques to several data sets from various applications to observe the decrease in the sizes of the compressed bitmap tables. We also present the query execution times for both point and range queries. As we will present in detail, we have observed significant improvements, which directly translate into improvements in query processing times. Remember that scientific databases, which are the main motivation for our research, are mostly read-only, thus reorganization needs to be done only once, for faster processing times in all future queries. Nevertheless, we also present the running times and scalability of our methods to prove the feasibility of application of our methods on very large databases. It is also worth noting that our methods are used as a preprocessing step before actual compression algorithms, to align 1’s in the bitmap table into consecutive positions. Thus, any compression algorithm can be employed to compress our reorganized data. In our experiments we used WAH compression algorithm [35], [36]. A. Performance of Gray Code Ordering In this section, we evaluate the performance of Gray code ordering. First, we present the extraordinary improvements in compression. Then we show that these improvements come only at a minor cost, and finally we demonstrate how our techniques can scale to larger datasets. 1) Compression Size: We present the effectiveness of our methods based on the improvement factor, which we compute as the ratio of the compressed bitmap table size of the original data to the compressed bitmap table size of the reordered data, i.e., improvement factor =
compressed size of original compressed size after reordering
Thus, an improvement factor of 5 means, compressed reordered data takes 5 times less space than the compressed original. We also present the overall improvement, which we compute as the ratio of the uncompressed bitmap table size to the compressed bitmap size of the reordered data, i.e., overall improvement = August 24, 2006
uncompressed size compressed size after reordering DRAFT
IEEE TRANSACTIONS ON KNOWLEDGE AND DATA ENGINEERING, VOL. X, NO. X, AUGUST XXXX
23
TABLE I I MPROVEMENT IN COMPRESSION OF REAL DATA SETS
Bitmap table Dataset
#cols
HEP1
Compressed size
Improv.
Improv.
(32-bit Words)
over
over
#rows
Original
Reordered
WAH
Uncompr.
122
2, 173, 762
3, 181, 057
562, 508
5.66
14.73
HEP1 RE
110
2, 173, 762
3, 302, 006
507, 034
6.51
14.74
HEP2
907
2, 173, 762
11, 482, 527
7, 008, 601
1.64
8.79
HEP3
110
2, 000, 000
2, 349, 302
244, 761
9.60
28.09
histogram1
64
112, 361
209, 066
54, 605
3.83
4.12
histogram2
192
112, 361
686, 949
257, 185
2.67
2.62
irvector16
123
19, 997
14, 858
2, 847
5.22
27.00
irvector32
230
19, 997
23, 749
7, 428
3.20
19.18
Table I reveals the effectiveness of our Gray code reordering algorithm on 8 data sets from various applications. In this table, the first three columns give the name of the problem, number of tuples, and number of columns in the bitmap tables, respectively. The next two columns present the sizes of the compressed bitmap tables for the original and reordered data, respectively. The last two columns present the improvement factor and the overall improvement, respectively. Out of the 8 data sets, the first four data sets (HEP1, HEP1 RE, HEP2, and HEP3) are from real high energy physics applications. HEP1 and HEP1 RE are the equality and range encoding bitmap tables of the same dataset, respectively. The fifth and sixth bitmap tables, histogram1 and histogram2, come from an image database with 112,361 images. Images are collected from a commercial CD-ROM and 64-dimensional color histograms are computed as feature vectors. The data set histogram is partially correlated. The last two data sets are composed of document feature vectors from 20 newsgroups based on TF/IDF (Term Frequency-Inverse Document Frequency) followed by reduction based on SVD (Singular Value Decomposition).
August 24, 2006
DRAFT
IEEE TRANSACTIONS ON KNOWLEDGE AND DATA ENGINEERING, VOL. X, NO. X, AUGUST XXXX
24
As seen in Table I, compression rates are magnified when the tuples are reordered with respect to Gray code ordering in all problem instances from all applications. For this experiment the order of the columns is the original order, i.e. no column ordering criteria is used evaluate the columns. The improvement factors are 5.66, 6.51, 1.64, and 9.60 for high energy physics data sets HEP1, HEP1 RE, HEP2, and HEP3, respectively. Comparing the results for these four data sets, we see that, as expected, improvements are more significant, when the number of columns is smaller. Fewer number of columns means closer to the optimal situation and therefore leaves more room for improvement for a reordering algorithm, since more tuples are likely to fall into the same bins, and thus it is possible to order tuples so that consecutive tuples fall into same bins in a lot of attributes. A similar trend can be observed in information retrieval data sets irvector16 and irvector32, where the improvement factors are 5.22 and 3.20, respectively. Nevertheless, improvements are significant even for larger numbers of columns. It should also be noted that the Gray code ordering technique can be applied to arbitrary data sizes, since it is an in-place algorithm. This means the effectiveness of our techniques will only get better, as we apply these techniques to larger data sets. As an alternative to Gray code ordering we have also tried the 2-switch heuristic described in Section IV-D on the TSP graphs for tuple reordering. As expected the runtimes were orders of magnitude slower compared to Gray code ordering. For instance, Gray code ordering on HEP1, which has 122 columns and 2,173,762 rows took only 37.4 seconds, whereas the 2-switch heuristic on the TSP graph took over 1,600 seconds. We have observed some improvement in the compression (around only 1%), but the huge gap in run time was daunting. We have observed similar results in the other data sets. 2) Execution time for Gray code ordering: In the next set of experiments, we looked at the affordability of Gray code ordering as a preprocessing step, and our results are presented in Figure 7. This figure shows the combined execution time of Gray code ordering and WAH compression for different number of rows. As can be seen, Gray code ordering takes only 25% of the time for compression. Therefore we claim that Gray code ordering should be considered as a natural preprocessing step for runlength encoding based compression algorithms. 3) Scalability: We tested the scalability of our algorithm by measuring the run time as a function of the bitmap table size. For these experiments we used HEP1 data. The experiments were run on a Pentium 4 PC with 2.25GHz CPU and 512MB of memory. August 24, 2006
DRAFT
IEEE TRANSACTIONS ON KNOWLEDGE AND DATA ENGINEERING, VOL. X, NO. X, AUGUST XXXX
Fig. 7.
25
Execution Time for Gray Code Reordering and WAH Compression.
Figures 8(a) and 8(b) show the average times of five runs on different problems of the same size. That is, the run time of the algorithm for 1,000 rows is reported as the average run time for 5 randomly selected row sets of size 1,000.
(a) Scalability vs. Number of Rows Fig. 8.
(b) Scalability vs. Number of Columns
Algorithm scalability (a) on the number of rows and (b) on the number of columns
Figure 8(a) studies the effect of the number of rows in the run time. For these runs, we used the first 100 columns and varied the number of rows from 1, 000 to 50, 000. In Figure 8(a), the x-axis is the number of rows, and the y-axis is the run time in milliseconds, and the results clearly show the linear relation between the number of rows, and the runtime. Similarly, the effect of the numbers of columns on the run time can be observed in Figure 8(b). Here, we fix the number of rows as 50, 000 and vary the number of columns from 10 to 80. All results confirm the linear relation between the runtime of our algorithm and the bitmap table size.
August 24, 2006
DRAFT
IEEE TRANSACTIONS ON KNOWLEDGE AND DATA ENGINEERING, VOL. X, NO. X, AUGUST XXXX
Fig. 9.
26
Performance for varying numbers of columns
We have also tested the performance of Gray code ordering in terms of solution quality for varying numbers of columns. We fixed the number of rows at 1,000,000 and tested the performance of our algorithm by varying the number of bins per attribute to change the number of columns to be 50, 100, 150, 200, 250, and 300. The results of our experiments are presented in Figure 9. In this figure original corresponds to the size of the compressed bitmap tables for the original data, whereas reordered corresponds to the size of the compressed reordered data. As observed in this figure, compressed data sizes grow with increasing number of columns. Reordering significantly decreases compressed index size in all cases. The improvement factor is 2.52, 2.08, 1.64, 1.92, 1.68, and 1.68, when the columns are 50, 100, 150, 200, 250, and 300, respectively. Fewer number of columns leaves more room for improvement for reordering due to increased likelihood of tuples in the same bins, which is nicely exploited by our Gray code ordering algorithm. B. Effects of column ordering Table II shows the average and maximum compressed column size for HEP1 and HEP1 RE datasets when using the column ordering criteria presented in the previous section. The ”Avg Size” and ”Max Size” columns correspond to the average and the maximum among the compressed column sizes. While the overall compression ratio is not significantly affected by the order in which the columns are evaluated, the maximum column size, which translates to the worst case query August 24, 2006
DRAFT
IEEE TRANSACTIONS ON KNOWLEDGE AND DATA ENGINEERING, VOL. X, NO. X, AUGUST XXXX
27
TABLE II G RAY CODE WITH COLUMN ORDERING . HEP DATA .
HEP1 Method
HEP1 RE
Avg Size
Max Size
Avg Size
Max Size
26, 072
68, 719
30, 018
69, 534
GC Alone
4, 703
35, 327
4, 609
38, 026
Set Bits - Decreasing
4, 863
18, 495
5, 211
28, 100
Set Bits - Increasing
4, 932
39, 407
3, 926
19, 044
Compressibility - Increasing
4, 863
18, 465
4, 505
21, 105
Compressibility - Decreasing
4, 932
39, 394
3, 990
37, 962
WAH
execution time, is reduced considerably. For the basic encoded bitmaps (HEP1), the maximum bitmap size is reduced to half when using the compressibility criteria in increasing order as opposed to the Gray code ordering alone and it is almost 4 times smaller when compared to the original WAH compressed bitmaps. This result will automatically translate to improved query times since it has been already reported that query run times are linearly dependent on the compressed bitmap table sizes. For range encoded bitmaps (HEP1 RE), ordering the columns by the set bits criteria in increasing order improves both average size and maximum size, and therefore overall compression ratio. Figures 10 and 11 show the number of words per column for different experiments using HEP1 and HEP1 RE data, respectively. In both figures, the first row, Figures 10(a) and 10(b), correspond to the column sizes using WAH compression and Gray code reordering, respectively. The second and third rows in the figure correspond to the compressed bitmap size when using compressibility criteria for column ordering together with Gray code reordering. The left side is using the column number in the x axis, and the right side is using the order of the column in the given column evaluation criteria. For example, using increasing compressibility as the order of the columns permutes column 34 in the original data, to the first position after reordering. August 24, 2006
DRAFT
IEEE TRANSACTIONS ON KNOWLEDGE AND DATA ENGINEERING, VOL. X, NO. X, AUGUST XXXX
28
The number of words in the uncompressed bitmap is about 70K. The maximum compressed size is decreased to half by the Gray code reordering. As can be seen, in both cases Gray code indeed favors the first columns but the degradation is distant from the theoretical worse case. In addition, when we use compressibility in increasing order as the column ordering criteria, the first and last columns compress better than the middle ones. When we use compressibility in decreasing order, the performance of Gray code is extended further than if the original order of the columns is used. The set bits criteria results are not presented since they exhibit the same trend as the compressibility criteria for these datasets. C. Improvements in Query Execution Times For the last set of experiments, we measured the impact of the improved compressed bitmaps in the execution time of the queries. For this experiment we used HEP1 which has 12 attributes and 2,173,762 rows. We generated set of 100 random queries varying the dimensionality of each set. First, we generated point queries over 1, 2, 4, 6, 8, 10, and 12 attributes. Second, we generated range queries over 12 attributes changing the number of attribute domain values in the interval to be 1, 2, 3, 4, and 5 producing queries of 12, 24, 36, 48, and 60 columns. Figures 12(a) and 12(b) show the results of executing point and range queries, respectively. In both cases the query execution time using the reordered bitmaps requires between 4 and 7 times less time than the corresponding queries using WAH compressed bitmaps over the original dataset. For point queries, ordering columns with the set bits criteria yields improvements up to 40% consistently, over using the original order of columns. For range queries, as the number of columns increases and more rows match the query criteria, the execution time for the reordered bitmaps become very close, but still remarkably faster than the compressed bitmaps that do not use reordering. D. Column Ordering by Query History Files To measure the effect of ordering the columns by query history files (QHF) on query execution time, we randomly generated a 100 queries QHF following a Zipf distribution. We compressed the bitmap table using WAH and ran the queries over the original WAH compressed bitmap and the QHF reordered bitmaps. The compressed size of the QHF reordered bitmap was 5.5 times smaller than the original WAH compressed bitmap and only 3% bigger than the Gray code August 24, 2006
DRAFT
IEEE TRANSACTIONS ON KNOWLEDGE AND DATA ENGINEERING, VOL. X, NO. X, AUGUST XXXX
29
reordered bitmap. The execution time for the 100 queries over the original WAH compressed bitmaps was 9.5 seconds and the execution time for the same queries over the QHF reordered bitmaps was 0.063 seconds. This is a speedup of over 150 times. VI. C ONCLUSIONS
AND
F UTURE W ORK
We studied the problem of improving bitmap index compression rates by reorganizing data layout. Our algorithms reorder database tuples so that consecutive tuples are likely to fall into same bins to boost the performance of run-length encoding based compression schemes. We defined the tuple reordering problem, which aims to find an ordering of tuples that maximizes the similarity (measured by the number of attributes that fall into the same bin), between consecutive tuples. We proposed Gray code ordering technique for this reordering problem combined with an evaluation order for the columns to exploit the idea of Gray codes. Our algorithm runs in linear time in the size of the database, and does not require any extra storage. This provides the applicability of our algorithm to very large data segments, even to the whole database. The performance of Gray code sorting algorithm is affected by the order in which we process the columns. We proposed two criterion for ordering the columns using the number of set bits and the compressibility of the columns. By evaluating easier to compress columns first, we extend the clustering power of Gray codes, and by evaluating the harder to compress columns first, we reduce the worse case number of runs in the bitmap table. We also presented a reduction of the tuple reordering problem to the well-known, wellstudied traveling salesperson problem (TSP). However, enormous sizes of the problems hinder applicability of frequently used TSP techniques for the tuple reordering problem. Our experiments showed that bitmap compression rates can be magnified by reordering database tuples. In many instances, compressed file size for the reordered file is less than half the compressed size of the original file. We have also observed a 9.60 times reduction in compressed index size on data set HEP3, which has 110 columns and 2,000,000 rows. Query execution time over the compressed reordered bitmaps is shown to require between 4 and 7 times less when compared with WAH compressed bitmaps. This paper shows the incontestable advantages of data reorganization for elevating bitmap index compression and introduces an important problem, which we call the tuple reordering problem. While our techniques are very effective in decreasing compressed bitmap indices, they August 24, 2006
DRAFT
IEEE TRANSACTIONS ON KNOWLEDGE AND DATA ENGINEERING, VOL. X, NO. X, AUGUST XXXX
30
are only our first steps in this direction, and leaves much for further research. The literature in TSP is extremely rich, a more detailed study on adopting TSP techniques for the tuple reordering problem is worth investigating. Although enormous problem sizes hinder most of the techniques, a thorough study into TSP literature might be able to produce techniques, which avoid explicit construction of the TSP graph and might be applied to smaller segments of the data. Finally, existing compression algorithms are tuned for unordered data, whereas our algorithms provide long uniform segments in the data. We expect significant additional improvements in compression rates by tuning existing compression algorithms to reorganized data. In general, an interesting avenue will be better integration of ordering and compression algorithms, where ordering algorithms are tuned for the compression algorithm to be used, and the compression algorithms are tuned for the reordered data. ACKNOWLEDGMENT We are grateful to John Wu from Lawrence Berkeley National Laboratory for his provision of some of the data sets, and insightful discussions. We also thank Yong Su from The Ohio State University, and Tao Tao from University of Illinois at Urbana-Champaign for their earlier involvement in the previous version of this project. This work was supported by the Director, Office of Science, Division of Mathematical, Information, and Computational Sciences of the U.S. Department of Energy (DOE) under contract DE-AC03-76SF00098, the DOE Award No. DE-FG02-03ER25573, National Science Foundation (NSF) grant CNS-0403342, and NSF Career Award IIS-0546713. However, any opinions, findings, conclusions or recommendations expressed herein are those of the authors, and do not necessarily reflect the views of DOE or NSF. R EFERENCES [1] S. Amer-Yahia and T. Johnson. Optimizing queries on compressed bitmaps. In The VLDB Journal, pages 329–338, 2000. [2] G. Antoshenkov. Byte aligned bitmap compression. Technical Report, Oracle Corp., 1994. U.S. Patent number 5,363,098. [3] G. Antoshenkov. Byte-aligned bitmap compression. In Data Compression Conference, Nashua, NH, 1995. Oracle Corp. [4] G. Antoshenkov and M. Ziauddin. Query processing and optimization in oracle rdb. The VLDB Journal, 1996. [5] S. Berchtold, C. Bohm, D. Keim, and H. Kriegel. A cost model for nearest neighbor search in high-dimensional data space. In Proc. ACM Symp. on Principles of Database Systems, pages 78–86, Tuscon, Arizona, June 1997. [6] S. Berchtold, D. Keim, and H. Kriegel. The X-tree: An index structure for high-dimensional data. In Proceedings of the Int. Conf. on Very Large Data Bases, pages 28–39, Bombay, India, 1996. August 24, 2006
DRAFT
IEEE TRANSACTIONS ON KNOWLEDGE AND DATA ENGINEERING, VOL. X, NO. X, AUGUST XXXX
31
[7] C. Bohm, S. Berchtold, and D. A. Keim. Searching in high-dimensional spaces: Index structures for improving the performance of multimedia databases. ACM Computing Surveys, 33:322–373, 2001. [8] K. Chakrabarti and S. Mehrotra. The hybrid tree: An index structure for high dimensional feature spaces. In Proc. Int. Conf. Data Engineering, pages 440–447, Sydney, Australia, 1999. [9] C.-Y Chan and Y. E. Ioannidis. An efficient bitmap encoding scheme for selection queries. In SIGMOD, pages 215–226, 1999. [10] H. Edelstein. Faster data warehouses. Information Week, December 1995. [11] V. Gaede and O. Gunther. Multidimensional access methods. ACM Computing Surveys, 30:170–231, 1998. [12] Informix
Inc.
Informix
decision
support
indexing
for
the
enterprise
data
warehouse.
http://www.informix.com/informix/corpinfo/- zines/whiteidx.htm. [13] Sybase Inc. Sybase IQ Indexes, chapter 5: Sybase IQ Release 11.2 Collection. Sybase Inc., March 1997. [14] D. S. Johnson, S. Krishnan, J. Chhugani, S. Kumar, and S. Venkatasubramanian. Compressing large boolean matrices using reordering techniques. In VLDB, pages 13–23, 2004. [15] T. Johnson. Performance measurement of compressed bitmap indices. In VLDB, pages 278–289, 1999. [16] N. Koudas. Space efficient bitmap indexing. In Proceedings of the ninth international conference on Information and knowledge management, pages 194–201. ACM Press, 2000. [17] K. Lin, H. V. Jagadish, and C. Faloutsos. The TV-tree: An index structure for high-dimensional data. VLDB Journal, 3:517–542, 1995. [18] D. B. Lomet and B. Salzberg. The hb-tree: A multi-attribute indexing method with good guaranteed performance. ACM Transactions on Database Systems, 15(4):625–658, December 1990. [19] P. O’Neil and D. Quass. Improved query performance with variant indexes. In Proceedings of the 1997 ACM SIGMOD International Conference on Management of Data, pages 38–49. ACM Press, 1997. [20] E. J. Otoo, A. Shoshani, and S. Hwang. Clustering high dimensional massive scientific dataset. In SSDBM, pages 147–157, Fairfax, Virginia, July 2001. [21] A. Pınar and M. Heath. Improving performance of sparse matrix-vector multiplication. In Proc. of Supercomputing 99, 1999. [22] A. Pinar, T. Tao, and H. Ferhatosmanoglu. Compressing bitmap indices by data reorganization. In International Conference on Data Engineering, pages 310–321, 2005. [23] M.V. Ramakrishna. In Indexing Goes a New Direction., volume 2, page 70, 1999. [24] G. Reinelt. The traveling salesman: computational solutions for TSP applications. Springer-Verlag, Lecture Notes in Computer Science, Vol: 840, 1994. [25] D. Richards. Data compression and gray-code sorting. Information Processing Letters, 22:201–205, 1986. [26] D. Salomon. Data Compression 2nd edition. Springer Verlag, New York, 2000. [27] H. Samet. The Design and Analysis of Spatial Structures. Addison Wesley Publishing Company, Inc., Massachusetts, 1989. [28] SciDAC. Scientific data management center. http://sdm.lbl.gov/sdmcenter/, 2002. [29] A. Shoshani, L.M. Bernardo, H. Nordberg, D. Rotem, and A.Sim. Multidimensinal indexing and query coordination for tertiary storage management. In SSDBM, pages 214–225, 1999. [30] SNAP. Supernova acceleration probe. http://snap.lbl.gov/, 2004. [31] K. Stockinger. Bitmap indices for speeding up high-dimensional data analysis. In DEXA, 2002.
August 24, 2006
DRAFT
IEEE TRANSACTIONS ON KNOWLEDGE AND DATA ENGINEERING, VOL. X, NO. X, AUGUST XXXX
32
[32] R. Weber, H.-J. Schek, and S. Blott. A quantitative analysis and performance study for similarity-search methods in high-dimensional spaces. In Proceedings of the Int. Conf. on Very Large Data Bases, pages 194–205, New York City, New York, August 1998. [33] K. Wu, E. J. Otoo, and A. Shoshani. A performance comparison of bitmap indexes. In Proceedings of the 2001 ACM CIKM International Conference on Information and Knowledge Management, pages 559–561, Atlanta, Georgia, November 2001. [34] K. Wu, E. J. Otoo, and A. Shoshani. Compressing bitmap indexes for faster search operations. In SSDBM, pages 99–108, Edinburgh, Scotland, UK, July 2002. [35] K. Wu, E. J. Otoo, and A. Shoshani. An efficient compression scheme for bitmap indices. Technical Report 49626, LBNL, April 2004. [36] K. Wu, E. J. Otoo, and A. Shoshani. Optimizing bitmap indexes with efficient compression. ACM Transactions on Database Systems, 2006. [37] M. J. Zaki and J. T. L. Wang. Special issue on bioinformatics and biological data management. Information Systems, 28:241–367, 2003.
August 24, 2006
DRAFT
IEEE TRANSACTIONS ON KNOWLEDGE AND DATA ENGINEERING, VOL. X, NO. X, AUGUST XXXX
(a) WAH
33
(b) Gray code (GC) reordering
(c) Columns ordered by increasing compress- (d) Columns ordered by increasing compressibility and plotted by column number
ibility and plotted by column order
(e) Columns ordered by decreasing compress- (f) Columns ordered by decreasing compressibility and plotted by column number
ibility and plotted by column order
Fig. 10. Compressed size of each column of HEP1 data for WAH Alone, Gray code reordering and Gray code reordering with column ordering.
August 24, 2006
DRAFT
IEEE TRANSACTIONS ON KNOWLEDGE AND DATA ENGINEERING, VOL. X, NO. X, AUGUST XXXX
(a) WAH
34
(b) Gray code (GC) reordering
(c) Columns ordered by increasing compress- (d) Columns ordered by increasing compressibility and plotted by column number
ibility and plotted by column order
(e) Columns ordered by decreasing compress- (f) Columns ordered by decreasing compressibility and plotted by column number Fig. 11.
ibility and plotted by column order
Compressed size of each column of HEP1 RE data for WAH Alone, Gray code reordering and Gray code reordering
with column ordering.
August 24, 2006
DRAFT
IEEE TRANSACTIONS ON KNOWLEDGE AND DATA ENGINEERING, VOL. X, NO. X, AUGUST XXXX
(a) Point Queries Fig. 12.
35
(b) Range Queries
Query execution times for (a) point queries and (b) range queries.
August 24, 2006
DRAFT