Int. J. Data Mining, Modelling and Management, Vol. 5, No. 4, 2013
Improving K-means clustering algorithm with the intelligent water drops (IWD) algorithm Hamed Shah-Hosseini Faculty of Electrical and Computer Engineering, Shahid Beheshti University, G.C., Tehran, Iran E-mail:
[email protected] E-mail:
[email protected] Abstract: In this paper, the K-means algorithm for data clustering is improved by the swarm-based nature-inspired optimisation algorithm, the intelligent water drops (IWD) algorithm. The K-means algorithm is an iterative algorithm in which the number of clusters is given in advance. Although the K-means is fast to converge, it is sensitive to the initial conditions. As a result, it is often trapped in local optimums. The IWD algorithm, which mimics the actions and reactions between natural water drops in real rivers, is modified to implicitly embed in itself the main processes of the K-means algorithm. The modified algorithm called IWD-KM is tested with several well-known datasets for clustering, and its performance is compared with the K-means algorithm. The experimental results show the superiority of the proposed IWD-KM algorithm. Keywords: clustering; K-means; metaheuristic; intelligent water drops; IWD; chaos. Reference to this paper should be made as follows: Shah-Hosseini, H. (2013) ‘Improving K-means clustering algorithm with the intelligent water drops (IWD) algorithm’, Int. J. Data Mining, Modelling and Management, Vol. 5, No. 4, pp.301–317. Biographical notes: Hamed Shah-Hosseini received his BS in Computer Engineering from the University of Tehran. He also obtained his MS and PhD both in Computer Science (AI) from the Amirkabir University of Technology, all with high honours. He is now with the Faculty of Electrical and Computer Engineering, Shahid Beheshti University, Tehran, Iran. His research interests include computational intelligence especially neural networks, evolutionary computation, swarm intelligence, and computer vision. He has introduced the Time-Adaptive Self-Organizing Map (TASOM) networks for both stationary and non-stationary environments. Moreover, he has introduced a bio-inspired swarm-based optimisation algorithm called ‘intelligent water drops’ algorithm (or IWD algorithm), which is based on actions and reactions occurring in natural rivers. In addition, he presented a Generalised Taylor’s (G-Taylor’s) theorem and a new metaheuristic called Galaxy-based Search Algorithm (GbSA) for continuous optimisation.
Copyright © 2013 Inderscience Enterprises Ltd.
301
302
1
H. Shah-Hosseini
Introduction
Data clustering has widely been used in the field of computational intelligence for applications such as pattern recognition (Theodoridis and Koutroumbas, 2003), vector quantisation (Lia et al., 2002), web mining (Eirinaki and Vazirgiannis, 2003), and knowledge discovery (Fayyad et al., 1996). Clustering algorithms may be grouped into two general categories: hierarchical and partitioning. Besides, there are other categories such as graph-based, fuzzy-based, or neural network-based clustering algorithms (see Xu and Wunsch, 2005 for a detail review). The K-means algorithm, which is also called the generalised LIoyd algorithm (GLA), is a partitioning clustering algorithm. The number of clusters, K, is given to the K-means algorithm in advance, and the K-means partitions the data points into K distinct clusters. Indeed, the K-means is first initialised with cluster centres randomly chosen from the dataset or randomly generated. Then, the cluster centres are updated in a way to reduce some objective measure. After a number of iterations, the cluster centres converge such that each cluster centre is a representative of the data points that belong to the cluster. In spite of the fact that the K-means converges fast, it often converges to local optimums (Khan and Ahmad, 2004). Moreover, the K-means is sensitive to initial conditions. This is due to the fact that the initial cluster centres are chosen randomly. Thus, each time the K-means runs, it may converge to cluster centres different from the previous run. Recently, metaheuristics have been used to improve the performance of the K-means. Metaheuristics refer to general purpose algorithms applicable to different optimisation problems, which usually need few modifications for adaptation to different problems. Particle swarm optimisation (PSO) and genetic algorithms are among the well-known metaheuristic algorithms. Metaheuristics alone may be used for clustering (Fathian et al., 2007; Karaboga and Ozturk, 2011; Shelokar et al., 2004; Pacheco, 2005). Although they usually find optimal or near-optimal solutions, they perform slowly to converge since the search space for data clustering is huge, and the clustering is an NP-complete problem (Garey et al., 1982). As a result, it is favourable to combine faster clustering algorithms with metaheuristics to have both fast convergence and better optimal cluster centres. A combination of K-means, Nelder-Mead simplex search, and PSO has been used as a hybrid method for clustering (Kao et al., 2008). Krishna and Murty (1999) introduced ‘genetic K-means algorithm’, which uses a modified mutation operator in the genetic algorithm plus the K-means, for clustering. Laszlo and Mukherjee (2007) used a novel crossover operator for selecting centres to seed the K-means method for clustering. Moreover, a quantum-inspired genetic algorithm has been introduced for the K-means (Xiao et al., 2010). In addition, metaheuristics have also been combined with other iterative clustering algorithms (Jiang et al., 2010; Güngör and Ünler, 2008). In this paper, a newly introduced metaheuristic, called ‘intelligent water drops’ (IWD) algorithm is modified to improve the performance of the K-means algorithm. The IWD algorithm was first introduced by Shah-Hosseini (2007) for the travelling salesman’s problem (TSP) (Msallam and Hamdan, 2011). It has also been used for other applications including the multi-dimensional knapsack problem (MKP) (Shah-Hosseini, 2008), n-queen puzzle (Shah-Hosseini, 2009b), trajectory planning (Duan et al., 2009), and multi-level thresholding of grey-level images (Shah-Hosseini, 2009a; 2012).
Improving K-means clustering algorithm with the IWD algorithm
303
The rest of the paper is organised as follows: next section reviews the K-means clustering algorithm. Section 3 summarises the IWD algorithm. Section 4 introduces the proposed IWD for the K-means, named ‘IWD-KM’. Experimental results are included in Section 5. The final section, Section 6, contains the concluding remarks.
2
A review on K-means clustering
Consider we have a set of M data points X = {x1, x2, …, xM} such that each data point (also called object, pattern, or input vector) is a d-dimensional vector, xj ∈ Rd where T
x j = ⎡⎣ x j1 , x j 2 ,… , x jd ⎤⎦ . The goal is to partition the data points into K distinct subsets C = {C1, C2, …, CK} such that:
•
∀i Ci ≠ ϕ
•
∪iK=1 Ci = X
•
∀i, j Ci ∩ C j = ϕ , i ≠ j
The above partitioning is obtained by minimising a criterion function. The sum of squared error function is widely used as a criterion function for partitional clustering. The K-means falls into the category of partitional clustering algorithms. The K-means may be specified in the following steps: 1
Initialise cluster centres MK = {m1, m2, …, mK} by randomly sampling K input data vectors and considering them as the cluster centres.
2
Assign each data vector xj to its nearest-cluster centre mk(j)
(
k ( j ) = arg min x j − m k k
3
)
(1)
Update the cluster centres MK as the mean vectors of their associated data vectors: mk =
1 Jk
∑x
for k = 1, 2,..., K
j
(2)
j∈J k
where Jk = {j | k(j) = k}. 4
Go to step 2 until convergence. The K-means attempts to minimise the following objective function: N
f ( X , M) =
∑x
j
− mk ( j)
(3)
j =1
where k(j) is defined in equation (1). It is mentioned that K-means converges fast but may lead to a local optimum. Therefore, the IWD algorithm is used here to reduce its drawbacks. Next section reviews on the IWD algorithm.
304
3
H. Shah-Hosseini
The IWD algorithm
The IWD algorithm tries to model the behaviour of natural water drops flowing in rivers in order to optimise an objective function of a given problem. The problem is represented by a graph G(N, E) where N denotes the nodes of the graph and E denotes its edges. Memory in the IWD algorithm is distributed and it is the amount of soil on the edges of the graph G. Generally, a number of IWDs are placed randomly on the nodes of the graph and then they travel along the edges of the graph from one node to another until they complete their solutions to the problem. In fact, each IWD constructs a solution to the problem gradually through visiting nodes while modifying the amount of soil of the edges connecting the visited nodes. As time elapses, the edges of better solutions contain less soil than other edges of the graph. Moreover, at the end of each iteration of the algorithm, the total-best solution (TBS), which is the best solution found so far, is updated by the solutions obtained by all the IWDs. Again, newly created IWDs are distributed randomly on the graph beginning a new iteration of the algorithm and the whole process mentioned above is repeated. The IWD algorithm has two types of parameters: Static parameters and Dynamic parameters. Static parameters remain constant during the process of the IWD algorithm. Dynamic parameters are reinitialised after each iteration of the IWD algorithm. The IWD algorithm (Shah-Hosseini, 2009b) is specified in the following steps: 1
2
Initialise static parameters: •
The problem is represented in a graph G(N, E) with Nc nodes.
•
The quality of the TBS TTB is initially set to the worst value: q(TTB) = –∞ (for maximisation problem).
•
The maximum number of iterations is specified by itermax.
•
The iteration count itercount is initialised with zero.
•
The number of intelligent water drops or IWDs denoted by NIWD is set to a positive integer value.
•
Velocity updating parameters are set as av = cv = 1 and bv = 0.01.
•
Soil updating parameters are set as as = cs = 1 and bs = 0.01.
•
The local soil updating parameter is set as ρn = 0.1.
•
The global soil updating parameter is set as ρIWD = 0.01.
•
The initial soil on each edge ei, j ∈ E of the graph connecting nodes i and j is set by soil(ei, j) = InitSoil where InitSoil = 100,000.
•
The initial velocity of each IWD is set as InitVel = 8.
Initialise dynamic parameters: •
For constraint handling, each IWD possesses a visited node list Vc(IWD), which is initially set to empty: Vc(IWD) = { }.
•
Each IWD’s velocity is set to InitVel.
•
All IWDs are set to have zero amount of soil.
3
Spread the IWDs on the nodes of the graph usually randomly.
4
Update the visited node list of each IWD to include the nodes just visited.
Improving K-means clustering algorithm with the IWD algorithm 5
305
Repeat steps 5.1 to 5.4 for those IWDs with partial solutions. 5.1 For the IWD currently at node i, choose the next node j by probability piIWD ( j ) :
(
f soil ( ei , j )
piIWD ( j ) =
∑
k∉vc ( IWD )
(
)
f soil ( ei , j )
)
(4)
)
(5)
such that
(
)
f soil ( ei , j ) =
(
1
ε s + g soil ( ei , j )
and
(
g soil ( ei , j )
)
(
)
⎧ soil ( ei , j ) if min soil ( ei , l ) ≥ 0 l∉vc(IWD) ⎪ =⎨ else ⎪ soil ( ei , j ) − min soil ( ei , l ) l∉vc ( IWD ) ⎩
(
)
(6)
Then, add the newly visited node j to the list vc(IWD). 5.2 For each IWD moving from node i to node j, update its velocity velIWD(t) by vel IWD (t + 1) = vel IWD (t ) +
av
bv + cv . soil 2 ( ei , j )
(7)
where velIWD(t + 1) is the updated velocity of the IWD. 5.3 For the IWD moving from node i to j, compute the soil Δsoil(ei, j) that the IWD loads from the edge ei, j by Δsoil ( ei , j ) =
as
bs + cs . time
2
( i, j; vel
IWD
(t + 1)
)
(8)
such that
(
)
time i, j; vel IWD (t + 1) =
HUD( j ) vel IWD (t + 1)
where the heuristic undesirability HUD(j) is defined appropriately for the given problem. 5.4 Update the soil soil(ei, j) of the edge ei, j traversed by the IWD, and also update the soil that the IWD carries soilIWD by soil (ei , j ) = (1 + ρ n ) . soil ( ei , j ) − ρ n . Δsoil ( ei , j ) soil IWD = soil IWD + Δsoil ( ei , j )
6
(9)
Find the iteration-best solution (IBS) TIB from all the solutions TIWD obtained by the IWDs using
306
H. Shah-Hosseini T IB = arg max q (T IWD ) IWD
(10)
∀T
where function q(.) gives the quality of the solution. 7
Update the soils on the paths that form the current IBS TIB by
soil ( ei , j ) = (1 − ρ IWD ) . soil ( ei , j ) − ρ IWD .
1
( N IB − 1)
IWD ∀ei , j ∈ T IB (11) . soilIB
where NIB is the number of nodes in solution TIB. 8
Update the total best-solution TTB using the current IBS TIB by ⎧⎪T TB T TB = ⎨ IB ⎪⎩ T
9
if q (T TB ) ≥ q (T IB ) otherwise
(12)
Increment the iteration number by Itercount ← Itercount + 1.
Then, go to step 2 if Itercount < Itermax .
10 The algorithm stops here with the TBS TTB. The constraint handling throughout the IWD algorithm may be tackled in three ways: One way is to strictly prevent IWDs from constructing solutions that violate the problem’s constraints. Another way is to let the IWDs construct solutions freely but penalise those solutions that violate constraints via reducing the quality value for such solutions. The third way to handle constraints is to let the solutions be constructed freely but they are modified to keep satisfied all the problem’s constraints. In the next section, the IWD algorithm is modified to be used for clustering while using the K-means algorithm inside itself.
4
The proposed IWD-KM algorithm for clustering
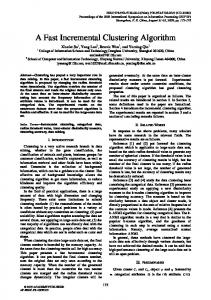
The IWD algorithm is combined with the K-means to cluster input data vectors. The hybrid clustering algorithm IWD-KM is explained in the following subsections. The flowchart of the IWD-KM is shown in Figure 1. In the following, each component of the algorithm as shown in Figure 1 is introduced. It is noted that the K-means is implicitly hidden in the proposed algorithm and it is used in Subsection 4.4 and Subsection 4.5. Moreover, the termination condition used in the IWD-KM is the maximum number of iterations.
4.1 Problem representation Consider we have M input data vectors X = {x1, x2, …xM} that is required to be partitioned into K clusters. Then, a graph with M + 1 nodes and K × M directed edges is
Improving K-means clustering algorithm with the IWD algorithm
307
created, which will be used ultimately by the IWDs to construct solutions for clustering. Figure 2 shows an example of the problem’s graph for clustering into three clusters. Figure 1
The flowchart of the proposed IWD-KM clustering algorithm
Figure 2
The problem’s graph for partitioning M data vectors into three clusters using the IWD-KM
Every IWD begins its trip from node 1 and ends it by visiting node M + 1. A directed edge ei, i + 1(k), which connects node i to node i + 1, is devoted to the cluster k. Since we have K clusters, then there will be K directed edges ei, i + 1(k) connecting i to i + 1 such that k = 1, 2, …, K.
308
H. Shah-Hosseini
There needs to be a selection mechanism for the IWD to select the edge that it will use to move to the next node. Next subsection explains this edge selection mechanism.
4.2 Edge selection Let an IWD residing at node i and wants to select one of the edges ei, i + 1(k) to visit the next node i + 1. Then, the probability PIWD(ei, i + 1(k)) for the IWD to select the edge ei, i + 1(k) is defined by P IWD ( ei , i +1 (k ) ) =
(
f soil ( ei , i +1 (k ) )
(13)
K
∑ f ( soil ( e
i , i +1 (l )
l =1
)
where f(.) has been defined in equation (5). During visiting nodes and selecting edges, the IWD updates the soil carrying by itself and removing some soil from the currently used edge. The next subsection expresses about this local soil updating.
4.3 Local soil updating When an IWD leaves node i by using edge ei, i + 1(k) to arrive at node i + 1, the soil of the IWD, soilIWD, and the soil of the used edge, soil(ei, i + 1(k)), both are updated by soil ( ei , i +1 (k ) ) = (1 + ρ n ) . soil ( ei , i +1 (k ) ) − ρ n . Δsoil ( ei , i +1 (k ) ) soil IWD = soil IWD + Δsoil ( ei , i +1 ( k ) )
(14)
where Δsoil(ei, i + 1(k)) is calculated by Δsoil ( ei , i +1 (k ) ) =
as
bs + cs . time
2
( i, i + 1; vel
IWD
(t + 1)
)
(15)
Such that
(
)
time ei , i +1 (k ); vel IWD (t + 1) =
HUD ( ei , i +1 (k ) ) vel IWD (t + 1)
(16)
where the updated velocity of the IWD denoted by velIWD(t + 1) is computed by vel IWD (t + 1) = vel IWD (t ) +
av
bv + cv . soil 2 ( ei , i +1 (k ) )
(17)
Therefore, an edge with less soil lets the IWD gain more speed than an edge with more soil. In addition, the heuristic undesirability HUD(ei, i + 1(k)) represents how much the edge ei, i + 1(k) is undesirable to be chosen by the IWD, and it is related to the problem at hand. For data clustering, HUD(ei, i + 1(k)) should be defined in a way that reflects how much the
Improving K-means clustering algorithm with the IWD algorithm
309
current data vector (denoted by node i) is preferable to be included in cluster k than the other clusters. Here, HUD(ei, i + 1(k)) is defined by HUD ( ei , i +1 (k ) ) =
d
∑( x
ij
− mkj
j =1
)
2
(18)
where xij is the jth component of the ith data vector xi = [xi1, xi2, …, xid]T. Also, mkj is the jth component of mk = [mk1, mk2, …, mkd]T. It is noted that mk is the representative vector of cluster (cluster centre) k. As a result, HUD(ei, i + 1(k)) is small when the data vector xi is close to the representative vector mk whereas HUD(ei, i + 1(k)) is great in value if xi is far from the cluster representative mk. When all the IWDs reach the last node of the problem’s graph, the global soil updating is executed on the edges of the IBS in an IWD algorithm. However, in the proposed IWD-KM, a few processes are executed before the global soil updating is performed. These processes are introduced in the next subsection.
4.4 Cluster centre calculation When all the IWDs have completed their solutions, based on the cluster assignments found by each IWD, its corresponding cluster centres are computed. Specifically, consider the solution constructed by an IWD is denoted by set
{
IWD T IWD = t1IWD , t2IWD , … , tM
} with M elements such that t
IWD i
may possess a value from
the set {1, 2, …, K}. Then, the cluster centres m kIWD for the IWD with solution TIWD are obtained as follows: m kIWD =
1
∑
J kIWD j∈J kIWD
{
(19)
xj
}
where J kIWD = j t IWD = k . In addition, the symbol | . | returns the number of elements j of its argument.
4.5 Local chaotic search When the cluster centres are calculated, then a chaotic-based modification is used to locally change the cluster centres m kIWD : Tm kIWD ← ω ⋅ m kIWD + (1 − ω ) ⋅ (Chaos − 0.5)
(20)
where ω = 0.9999 and Chaos is a chaotic variable, which is generated by the logistic map: Chaos ← 4 ⋅ Chaos ⋅ (1 − Chaos ).
Then, the objective functions for both cluster centres
{
M IWD = m1IWD , m 2IWD ,… , m IWD K
}
310
H. Shah-Hosseini
and
{
TM IWD = Tm1IWD , Tm 2IWD ,… , Tm IWD K
}
are calculated by: f ( X , M IWD ) =
N
∑x
j
− m kIWD ( j)
(21)
j =1
and f ( X , TM IWD ) =
N
∑x
j
− Tm kIWD ( j)
(22)
j =1
where
(
k ( j ) = arg min x j − m kIWD k
)
(23)
If
f ( X , TM IWD ) < f ( X , M IWD ) then M IWD ← TM IWD ,
and the solution TIWD is updated as follows:
(
t IWD = arg min x j − m kIWD j j
)
for
j = 1, 2,… , M
(24)
And the local chaotic search is terminated. Otherwise, MIWD is again changed by the chaotic-based rule of equation (20) and the whole process above is repeated for at most ten times.
4.6 Global soil updating After the local chaotic search, once more the cluster centre calculation is performed. Then, the IBS TIB is found. Afterwards, the soils of the edges forming the solution TIB are updated by:
( (
(
)
)
soil ( ei , i +1 (k ) ) = min max Tempsoil ei , i +1 (k ) , MinSoil , MaxSoil ∀ei , i +1 (k ) ∈ T IB
)
(25)
where Tempsoil ( ei , i +1 ( k ) ) = (1 − ρ IWD ) . soil ( ei , i +1 (k ) ) − ρ IWD . ∀ei ,i +1 (k ) ∈ T
IB
IWD soilIB M
(26)
Improving K-means clustering algorithm with the IWD algorithm
311
Here, the global soil updating is bounded by the interval [MinSoil, MaxSoil] to prevent underutilisation of any cluster. Experimentally, MinSoil = 50 and MaxSoil = 100,000. IWD Moreover, SoilIB represents the amount of soil that the IWD with the IBS has gathered IWD implicitly represents the quality of from the edges of the graph. In other words, SoilIB the IBS TIB. As a result, there is no need to explicitly calculate the quality of the solutions TIWD. In fact, for any IWD with solution TIWD, the soil that the IWD carries denoted by SoilIWD takes the value of function q(TIWD) in equation (12). When the global soil updating is finished, one iteration of the IWD-KM has ended and another iteration begins with new IWDs. This process continues until the maximum number of iterations is met or when the TBS does not change in consecutive iterations. Next section employs the proposed IWD-KM for data clustering of some well-known data sets.
5
Experimental results
In this section, the proposed IWD-KM is tested with six well-known datasets downloaded from the UCI machine learning dataset repository (UCI, 2010). The performance of the IWD-KM is compared to the K-means algorithm. It is noted that the experiments are conducted on a Notebook PC with Pentium 4 CPU 2.53GH and 4 GB RAM using Microsoft Windows 7 home edition. The algorithms are written using the C# language in the Microsoft Visual Studio.NET. The six datasets are introduced briefly as follows: •
Iris dataset: This dataset contains 150 data vectors of three classes. Each class holds 50 instances of the data vectors related to a certain kind of the iris plant. Every data vector excluding its class information is composed of four attributes, which are: sepal length, sepal width, petal length, and petal width, all in centimetres. The class information for each data vector holds the species of the Iris plant, which are Setosa, Versicolour, or Virginica.
•
Wine dataset: This dataset includes a chemical analysis of wines grown in the same region in Italy but taken from three different cultivars. The three classes of the wines are represented by 13 attributes, which are: 1
alcohol
2
malic acid
3
ash
4
alcalinity of ash
5
magnesium
6
total phenols
7
flavanoids
8
non-flavanoid phenols
312
H. Shah-Hosseini 9
proanthocyanins
10 colour intensity 11 hue 12 OD280/OD315 of diluted wines 13 proline. Out of the total 178 data vectors, the first class contains 59 data vectors. The second class holds 71 data vectors, and the third class holds 48 data vectors. •
Thyroid dataset: This dataset includes 150 data vectors. Each data vector is composed of five attribute values excluding the class information. The dataset is used to predict whether a patient’s thyroid belongs to the class euthyroidism, hypothyroidism, or hyperthyroidism.
•
Wisconsin Breast cancer dataset: It contains 699 instances each composed of 11 attributes. The first attribute is the id number. The last attribute holds the class information. There are two classes: malignant and benign. The value of 2 stands for benign and the value of 4 represents the malignant class. The attributes from two to ten are: 1
clump thickness
2
uniformity of cell size
3
uniformity of cell shape
4
marginal adhesion
5
single epithelial cell size
6
bare nuclei
7
bland chromatin
8
normal nucleoli
9
mitoses.
There are 16 missing attributes in 16 instances of the dataset. In the experiments, we remove these instances from the dataset. •
E. coli dataset: It contains 336 instances related to protein localisation sites in Eukaryotic cells. Each instance holds nine attributes. The first attribute is the sequence name. The rest of the attributes excluding the last one are the attributes which are used for clustering or classification. The last attribute is the symbol showing the class information, which is one of eight location sites.
•
Image segmentation dataset: it contains 2,100 instances for test and 210 instances for training. Here, the 2,100 test instances are used. Each instance is composed of 19 attributes. And there are seven classes in the instances.
For the first five datasets, the experiments with the proposed IWD-KM and the K-means are repeated for ten times and the solutions after convergence are reported in Table 1. The results of clustering in terms of the objective function defined in equation (3) are shown in the table.
Improving K-means clustering algorithm with the IWD algorithm Table 1
313
The performance of the proposed IWD-KM and the K-means for five datasets in terms of objective function in ten runs
Dataset:
Iris
Thyroid
Wine
Wisconsin breast cancer
E. Coli
No. clusters:
Three
Three
Three
Two
Eight
Algorithm
Best
STD
IWD-KM
97.22
0
K-means
97.33 12.58
Best
STD
Best
STD
1,961.75
0
16,530.54
0
1,987.93 6.83
16,555.43 869.71
Best
STD
Best STD
2,984.07
0
62.28 0.13
2,988.43
0
62.43 0.14
Note: STD stands for standard deviation.
For four datasets Iris, Thyroid, Wine, and Wisconsin breast cancer, the IWD-KM produces the same clustering. In fact, the standard deviation of the objective function of equation (3) for the four datasets has a value of zero in all ten runs of the IWD-MKP. Only for the E. coli, the standard deviation is 0.13, which is slightly greater than zero. Another point is that the IWD-KM produces the lowest values for the objective function in ten runs of the algorithm whereas the K-means cannot produce the same objective values in its ten runs. To be sure of superiority of the IWD-KM, the K-means is run for 1,000 iterations to find the best solution for the Wine dataset using the Matlab function kmeans. It is mentioned that for every run, a random set of initial cluster centres is chosen from the dataset. This 1,000 runs of the K-means took 7.56 seconds to finish and the best result among the 1,000 runs obtains the objective value 16,555.43. In contrast, the IWD-KM finds the solution 16,530.54 in less than 1.52 seconds. To complete the aforementioned experiment, from two to nine clusters for the Wine dataset are tested by both the K-means with 1,000 runs and the IWD-KM with one run. The results are summarised in Table 2. In two out of the eight cases of the experiments of Table 2, the K-means gets lower values in terms of the objective function. However, in the other six cases, the IWD-KM gets better objective values, which reflects the superiority of the IWD-KM in respect of the K-means even with multiple runs. It is noted that the computation times are also reported in the table. Table 2
The performance of the IWD-KM with one run against the K-means with 1,000 different runs for the dataset ‘Wine’
Dataset: No. clusters:
Wine Two
Three
Four
Five
Six
Seven
Eight
Nine
IWD-KM
23,562.74 16,530.54 12,789.35 10,563.05 8,642.12 7,808.78 7,205.86 5,787.49 (1.22) (1.52) (1.57) (1.76) (1.93) (5.16) (5.55) (6.4)
K-means
23,799.98 16,555.43 12,836.64 10,668.18 9,147.13 7,161.58 6,418.93 5,970.43 (7.22) (7.56) (10.52) (11.29) (12.29) (11.65) (12.08) (13.41)
Note: The numbers in parentheses reflect the times in seconds.
Moreover, to test the IWD-KM with larger datasets, the dataset ‘Segmentation’ with 2,100 input vectors is clustered by both the K-means and the proposed IWD-KM for different number of clusters where the results are expressed in Table 3. Here, the IWD-KM uses 100 IWDs to cluster the dataset. The K-means is run for 7,000 times for
314
H. Shah-Hosseini
clustering into two and three clusters and the best clustering in terms of the objective function is reported in the table. For clustering into four, five, six, seven, eight and nine clusters, the K-means is run for 2,000 times and the only the best results are written in the table. In addition, the computation times for both K-means and the IWD-KM are stated in parentheses in Table 3. Although the times taken to stop the IWD-KM are lower than those of the K-means, the objective values obtained by the IWD-KM are much lower than those of the K-means. Table 3
The performance of the IWD-KM with one run against the K-means with 7,000 different runs for creating two and three clusters, and 2,000 different runs for the rest of clustering with the dataset ‘segmentation’ holding 2,100 data vectors
Dataset: No. clusters:
Segmentation Two
Three
Four
Five
Six
Seven
Eight
Nine
IWD-KM 211,235.54 174,318.5 161,837.59 151,155.17 143,347.18 135,456.00 129,374.56 126,040.27 (108.04) (43.30) (50.00) (47.88) (48.42) (57.45) (60.84) (60.04) K-means 211,241.22 174,399.64 168,973.28 154,807.89 144,491.45 143,011.10 134,507.83 126,154.29 (108.07) (314.16) (54.57) (86.67) (117.48) (132.69) (145.19) (129.63)
Note: The numbers in parentheses reflect the times in seconds.
It is mentioned that other modifications of the K-means have been introduced but with a price of an increase in computational complexity. The reader is referred to Hansen et al. (2005). The performance of the IWD-KM in terms of the objective function versus iteration for the experiments of Table 1 is shown in Figures 3 to Figure 7. In all the experiments, the number of the IWDs is ten unless expressed otherwise. Both the IBS and the TBS are shown in the figures. It is seen that the curves of the IBS are always close to those of the TBS. This fact experimentally demonstrates that the IWD-KM for data clustering is convergent. However, the iteration number that the IWD-KM converges is different for the datasets. Figure 3
The objective values of the IBS and TBS versus the number of iterations for Iris dataset using the IWD-KM
Improving K-means clustering algorithm with the IWD algorithm
315
Figure 4
The objective values of the IBS and TBS versus the number of iterations for Wine dataset using the IWD-KM
Figure 5
The objective values of the IBS and TBS versus the number of iterations for Thyroid dataset using the IWD-KM
Figure 6
The objective values of the IBS and TBS versus the number of iterations for Wisconsin breast cancer dataset using the IWD-KM
316
H. Shah-Hosseini
Figure 7
The objective values of the IBS and TBS versus the number of iterations for E. coli dataset using the IWD-KM
In terms of computation time, one run of the K-means converges faster with fewer iterations than the proposed IWD-KM. Therefore, there is still much work to be done to converge faster than the K-means and producing better results with zero standard deviations.
6
Conclusions
In this paper, the IWD algorithm was combined by the processes used in the K-means to create a hybrid clustering algorithm. The proposed algorithm called IWD-KM was tested with several well-known datasets. The intention was to alleviate the drawbacks of the Kmeans which are sensitive to initial conditions and getting trap into local optimums. The proposed IWD-KM produced better clustering results whereas it showed zero or near zero sensitivity to initial conditions. However, the K-means is faster to converge and in the future the IWD-KM should be modified to converge faster. Moreover, other versions of the K-means algorithm may be used in combination with the IWD algorithm. It is also possible to use the IWD algorithm solely for data clustering without using the K-means.
References Duan, H., Liu, S. and Wu, J. (2009) ‘Novel intelligent water drops optimization approach to single UCAV smooth trajectory planning’, Aerospace Science and Technology, Vol. 13, No. 8, pp.442–449. Eirinaki, M. and Vazirgiannis, M. (2003) ‘Web mining for web personalization’, ACM Transactions on Internet Technology, Vol. 3, No. 1, pp.1–27. Fathian, M., Amiri, B. and Maroosi, A. (2007) ‘Application of honey-bee mating optimization algorithm on clustering’, Applied Mathematics and Computation, Vol. 190, No. 2, pp.1502–1513. Fayyad, U.M., Piatetsky-Shapiro, G., Smyth, P. and Uthurusamy, R. (1996) Advances in Knowledge Discovery and Data Mining, MIT Press, Boston, MA. Garey, M.R., Johnson, D.S. and Witsenhausen, H.S. (1982) ‘The complexity of the generalized Lloyd–Max problem’, IEEE Trans. Inform. Theory, Vol. 28, No. 2, pp.255–256.
Improving K-means clustering algorithm with the IWD algorithm
317
Güngör, Z. and Ünler, A. (2008) ‘K-harmonic means data clustering with tabu-search method’, Applied Mathematical Modeling, Vol. 32, No. 6, pp.1115–1125. Hansen, P., Ngai, E., Cheung, B.K. and Mladenovic, N. (2005) ‘Analysis of global K-means, an incremental heuristic for minimum sum-of-squares clustering’, Journal of Classification, Vol. 22, No. 2, pp.287–310. Jiang, H., Yi, S., Li., J., Yang, F. and Hu, X. (2010) ‘Ant clustering algorithm with K-harmonic means clustering’, Expert Systems with Applications, Vol. 37, No. 12, pp.8679–8684. Kao, Y.T., Zahara, E. and Kao, I.W. (2008) ‘A hybridized approach to data clustering’, Expert Systems with Applications, Vol. 34, No. 3, pp.1754–1762. Karaboga, D. and Ozturk, C. (2011) ‘A novel clustering approach: artificial bee colony (ABC) algorithm’, Appl. Soft Comput. J., Vol. 11, No. 1, pp.652–657. Khan, S.S. and Ahmad, A. (2004) ‘Cluster center initialization algorithm for K-means clustering’, Pattern Recognition Letters, Vol. 25, No. 11, pp.1293–1302. Krishna, K. and Murty, M. (1999) ‘Genetic K-means algorithm’, IEEE Trans. Syst., Man, Cybern. B, Cybern., Vol. 29, No. 3, pp.433–439. Laszlo, M. and Mukherjee, S. (2007) ‘A genetic algorithm that exchanges neighboring centers for K-means clustering’, Pattern Recognition Letters, Vol. 28, No. 16, pp.2359–2366. Lia, Y.C., Lai, J.Z.C. and Lo, W. (2002) ‘Image restoration of compressed image using classified vector quantization’, Pattern Recognition, Vol. 35, No. 2, pp.181–192. Msallam, M. and Hamdan, M. (2011) ‘Improved intelligent water drops algorithm using adaptive schema’, International Journal of Bio-Inspired Computation (IJBIC), Vol. 3, No. 2, pp.103–111. Pacheco, J. (2005) ‘A scatter search approach for the minimum sum-of-squares clustering problem’, Computers & Operations Research, Vol. 32, pp.1325–1335. Shah-Hosseini, H. (2007) ‘Problem solving by intelligent water drops’, Proceedings of IEEE Congress on Evolutionary Computation, pp.3226–3231, Swissotel, The Stamford, Singapore. Shah-Hosseini, H. (2008) ‘Intelligent water drops algorithm: a new optimization method for solving the multiple knapsack problem’, Int. Journal of Intelligent Computing and Cybernetics, Vol. 1, No. 2, pp.193–212. Shah-Hosseini, H. (2009a) ‘Optimization with the nature-inspired intelligent water drops algorithm’, in Dos Santos, W.P. (Ed.): Evolutionary Computation, pp.297–320, I-Tech, Vienna, Austria, ISBN 978-953-307-008-7. Shah-Hosseini, H. (2009b) ‘The intelligent water drops algorithm: a nature-inspired swarm-based optimization algorithm’, Int. J. Bio-Inspired Computation, Vol. 1, Nos. 1/2, pp.71–79. Shah-Hosseini, H. (2012) ‘Intelligent water drops algorithm for automatic multilevel thresholding of gray-level images using a modified Otsu’s criterion’, International Journal of Modelling, Identification and Control (IJMIC), Vol. 15, No. 4. Shelokar, P.S., Jayaraman, V.K. and Kulkarni, B.D. (2004) ‘An ant colony approach for clustering’, Anal. Chim. Acta, Vol. 509, No. 2, pp.187–195. Theodoridis, S. and Koutroumbas, K. (2003) Pattern Recognition, 2nd ed., Academic Press, New York. UCI Machine Learning Repository (2010) available at http://www.ics.uci.edu/-mlearn/MLRepository.html (accessed in 2010). Xiao, J., Yan, Y.P., Zhang, J. and Tang, Y. (2010) ‘A quantum-inspired genetic algorithm for K-means clustering’, Expert Systems with Applications, Vol. 37, No. 7, pp.4966–4973. Xu, R. and Wunsch, D. (2005) ‘Survey of clustering algorithms’, IEEE Transactions on Neural Networks, Vol. 16, No. 3, pp.645–678.