2015 IEEE Wireless Communications and Networking Conference (WCNC) New Orleans, LA, USA March 9-12, 2015
Improving System Capacity Based upon User-Specific QoS for Heterogeneous Networks Chao He, Gabriel E. Arrobo, and Richard D. Gitlin Department of Electrical Engineering University of South Florida, Tampa, Florida 33620, USA Email: {chaohe, garrobo}@mail.usf.edu,
[email protected] Abstract—This paper describes how user-specific QoS requirements may improve spectral utilization in heterogeneous networks. Throughput improvements of FTP (File Transfer Protocol) applications benefiting from the rate adaptation and MAC scheduling algorithms for video applications that incorporate user-specific QoS to improve system capacity are demonstrated. These improvements are achieved while user satisfaction for video applications, as measured by the Mean Opinion Score (MOS), is maintained at an acceptable level. OPNET system simulations were performed for a set of FTP users and video users that were assigned specific QoS target levels in LTE systems. Simulation results show that significant system capacity improvements and acceptable MOS levels can be achieved for FTP users and video users, respectively, if such user-specific QoS requirements are considered in heterogeneous networks. Keywords—Heterogeneous networks, MAC scheduler, MOS, system capacity, user-specific QoS.
I.
I NTRODUCTION
In today’s wireless 4G LTE networks, the current spectral resource allocation algorithms are either independent of the application’s specific Quality of Service (QoS) requirements and of the users’ specific perceived QoS, or at most rely on a set of pre-defined fixed priorities [1], [2]. Indeed, from the user’s perspective, the QoS required by different applications can be quite variable. Similarly, for a given application type, different users may require, or be satisfied with, different levels of QoS. For video applications, as a user-specific QoS example, older individuals, when compared to young adults, are less sensitive to spatial forms defined by a temporal structure [3]. So for many older people, a lower video data rate provides the same user experience as the full rate video does for younger people. Hence, user-specific QoS requirements can be utilized by the scheduler to differentiate between users and make better use of the wireless spectral resources. In most commercial systems, the network operator can obtain the user-specific QoS requirements that are based primarily upon age. When users subscribe to a service from the wireless operator, they often provide their relevant information such as age, name, and nationality that can be used by the network to derive userspecific QoS parameters. Furthermore, we observe that some previous studies (e.g., [4], [5]), which use the QoS characteristics of an underlying application (typically expressed as a function of the Mean Opinion Score [MOS]), allocate average spectral resources to applications, independently of the application’s actual specific QoS requirement. In [6], content adaptation techniques
and protocol adaptation techniques are used to optimize the interactions between applications/content and the underlying networks to accelerate the content delivery. However, in these schemes, no user-specific and age related QoS requirements have been considered in the MOS functions and scheduling algorithms. Thus, in such schemes, especially for applications with widely varying QoS requirements, either the spectral resources are not efficiently utilized or the MOS is significantly degraded. The user-specific QoS problems were first addressed in [7], [8]. It was shown that significant MOS improvement can be achieved if user-specific QoS requirements are considered in the MAC scheduler in [7]. Furthermore, when targeted to maximize spectrum utilization and combined with voice (VoIP) codecs matched to the auditory characteristics of users, higher system capacity, at comparable MOS levels, can be achieved. In [8], it was demonstrated that significant system capacity improvement, as measured by the maximum number of supportable users, and acceptable MOS levels can be achieved if user-specific QoS requirements are considered in the rate adaptation and MAC scheduling algorithms for voice and video applications. Driven by smart phones, tablets, and other data-hungry devices, data traffic demand in cellular networks is increasing exponentially. Heterogeneous networks have been introduced in the LTE-Advanced standard. Since radio link performance is approaching theoretical limits with 3G/4G enhancements, the next performance leap in wireless networks will come from the network topology optimization as a means to provide higher network capacity and better coverage. A heterogeneous network uses a mixture of macrocells and small cells such as microcells, picocells, and femtocells, where small cells are overlaid in macrocells. These smallcells in heterogeneous networks can potentially improve system capacity and coverage by allowing future cellular systems to achieve higher data rates [9], [10]. Compared with homogeneous networks, the different cell deployment and different intra-cell and inter-cell interference distributions in heterogeneous networks may have a different impact on the system gain of the user-specific QoS scheme. However, no analysis and performance evaluation of the userspecific QoS requirement and its applications in heterogeneous networks have been done to the best of our knowledge and these are the focus of this paper. The rest of the paper is organized as follows. In Section II, our user-specific QoS scheme is described. Sections III and
2015 IEEE Wireless Communications and Networking Conference (WCNC) New Orleans, LA, USA March 9-12, 2015
IV present the OPNET system simulation setup and simulation results, respectively. Finally, our conclusions are presented in Section V. II.
U SER -S PECIFIC Q O S S CHEME
A. MOS Formulas for Video A simplified video MOS model [8], [11] is used in these papers, where the distortion, measured by the Mean Square Error (MSE), is assumed to be composed of two components, namely the source distortion DS and the loss distortion DL : M SE = DS + DL = η · Rξ + Γ · P EP
(1)
In (1), η, ξ, and Γ are model parameters and P EP is the packet loss ratio. For different types of video sources, η, ξ, and Γ take different values. In this paper, we assume η = 1.76·105 , ξ = −0.658, and Γ = 1750 as in [11]. The peak signal-tonoise ratio, P SN R, is a widely used objective measurement of video quality, and is related to the M SE by: P SN R(dB) = 10 · log 10 A piecewise linear mapping from shown in (3): 1, M OS = 1 + 3.5 20 · (P SN R − 20), 4.5,
2552 M SE
(2)
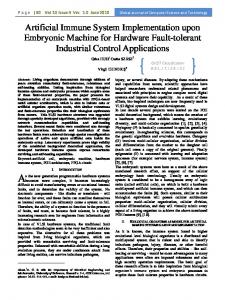
Fig. 1. Video MOS as a function of data rate for different sensitivity factors, γ, given a packet loss ratio of 0.001.
the P SN R to M OS is when P SN R < 20 when P SN R ∈ [20, 40] when P SN R > 40 (3)
From (1)-(3), we observe that the higher the data rate, or the lower the packet loss ratio, the higher the MOS value. B. UE-Specific Video MOS Formulas To reflect users’ different sensitivity to the data rate, a userspecific sensitivity factor γ is introduced to the date rate in (1), which becomes [8]: M SE = DS + DL = γ · η · Rξ + Γ · P EP
(4)
In this paper, without loss of generality and also for simplicity of illustration, the data rate sensitivity factor γ takes values from the following set {0.8, 1.0}. When γ takes the value 1.0, it is a normal user. When γ takes the value less than 1.0, it is less sensitive to the data rate compared with a normal user. C. Motivation for Video Data Rate Optimization Figure 1 shows the MOS as a function of data rate for different sensitivity factors γ under a given packet loss ratio of 0.001. For simplicity, in order to illustrate the main idea of the algorithms, 10 levels of data rate are used in this paper, which loosely correspond to the application requirements. For Level I, where I ∈ {1, 2, ..., 10}, the corresponding data rate is 135 * 128 pixels * (11-I) frames/s * 8bytes/pixel with data rates ranging from 138.2 Kbps to 1.382 Mbps. An important observation that can be made from Fig. 1 is that a user with a lower sensitivity factor and a lower data rate can achieve a higher MOS value than that of users with a normal sensitivity factor and a higher data rate. If the user-specific QoS scheduler
knows and makes use of this user-specific sensitivity factor information to optimize the scheduling, it can decrease the data rate for users with a lower sensitivity factor to support more users with an acceptable MOS value. Sections II.E-G provide further details. D. LTE Baseline Scheduling Algorithms The benchmark for performance comparison is the LTE baseline scheduler that doesn’t consider the user-specific QoS requirement, where the time domain and frequency domain scheduler functions are described below [12], [13]. It is also easy to extend the approach in this paper to other baseline schedulers to do a fair comparison with and without userspecific QoS requirements. 1) Time Domain Scheduler: Users with higher metrics (e.g., packet delay) receive higher scheduling priority in the time domain. The delay metric for user k is defined as: Mk = T W k ∗ Delay
(5)
where T W k = 1 for all users, which means users are not differentiated by their specific QoS requirements. Delay is the packet delay in the MAC buffer for video users, and for FTP users it is the elapsed time since a given FTP user was scheduled last time. FTP applications as non-GBR (Guaranteed Bit rate) services have lower scheduling priority than video applications as GBR services in the time domain. 2) Frequency Domain Scheduler: Each user has a Carrierto-Interference (C/I) metric for each sub-band and is sorted for each sub-band among all the scheduled users. A max C/I approach is used in the LTE baseline scheduler, where each sub-band is first allocated to the user that has the highest C/I, then to the user with the second and third highest C/I, and so on until all the resources of this given sub-band are allocated.
2015 IEEE Wireless Communications and Networking Conference (WCNC) New Orleans, LA, USA March 9-12, 2015
The C/I metric for user k in each sub-band n is defined by: Mn,k = F W n,k ∗ SIN Rn,k
(6)
where F W n,k = 1, which means users are not differentiated by their specific QoS requirements, and SIN Rn,k is the SINR for user k in sub-band n. E. Proposed User-Specific QoS Scheme The novelty of the proposed user-specific QoS scheme is the incorporation of user-specific QoS requirements into the scheduling and personalized individual user’s scheduling that uses this user-specific QoS information to improve system performance as described below. The proposed scheduling algorithms are composed of two parts, the source (e.g., video) data rate adaptation algorithm and the MAC resource scheduling algorithms. The rationale of the proposed algorithms is to improve system capacity by trading off the spectral resource allocations for the user-specific QoS requirements, while still maintaining acceptable levels of MOS. To be more specific, the system capacity can be improved through dynamically adapting the data rate of video users by considering userspecific QoS requirements, and allocating the saved spectral resource resulting from the degraded data rate of video users to other users (FTP users in this paper). As an example of the implementation in current LTE systems, the video data rate adaptation can be implemented in the receiver UE (User Equipment) to control the data rate of the sender, and the MAC scheduler resides in the eNodeB. The user-specific QoS parameters can be derived in the PCRF (Policy and Charging Rules Function) based upon parameters such as the user’s age stored in the SPR (Subscription Profile Repository) database, and conveyed successively through the Gx interface, S5 interface, S11 interface, and S1-MME interface to the MAC layer [14]. Sections F and G illustrate the proposed video data rate adaptation and MAC resource scheduling algorithms respectively.
Fig. 2.
F. Video Data Rate Adaptation
1) Time Domain Scheduler: The same metric is applied as the LTE baseline scheduler except that T W k = 5 for video
The work flow of the video data rate adaptation is shown in Fig. 2. For simplicity of illustration, four levels of data rate are assumed in the video data rate adaptation. The video data rate level to be selected depends upon the respectively calculated MOS for each level of data rate. The threshold to degrade the video data rate can be configured to control the desired MOS levels. In this paper, it is set to 0.01 instead of 0.0 to allow more data offloaded from video users and more data conveyed for FTP users. The throughput of FTP users can be improved from the degraded data rate, thus decreased throughput, of video users when user-specific QoS is used in the proposed rate adaptation algorithm, as verified in the simulation results. Figure 3 describes the decrease in MOS percentage for different packet loss ratios calculated for a user with a lower sensitivity factor of 0.8 but a lower data rate of level 5, 6 and for a user with a normal sensitivity factor of 1.0 but a higher OS3 data rate of level 3 , which corresponds to M OS1−M and M OS1 M OS1−M OS2 respectively in the rate adaptation work flow in M OS1 Fig. 2. From Fig. 3 it can be seen that, for a user with a lower sensitivity factor of 0.8 but a lower data rate of level 6 (red curve), the decreased MOS percentage decreases as the packet loss ratio increases. In order to maintain the target degraded
Video data rate adaptation work flow.
MOS level of 1%, the packet loss ratio needs to be greater than about 1%. That means, to maintain the desired degraded level of MOS, the higher packet loss ratio can result in a lower user data rate and the lower packet loss ratio can result in a higher user data rate. Therefore, in heterogeneous networks, if the SINR of video users can be improved, with a lower packet loss ratio, due to the deployment of LTE picocells and closer distances to the picocells, then the selected data rate of video users will be higher compared with homogeneous networks, as verified in the simulation results. G. MAC Resource Scheduling Algorithms
Fig. 3. Decreased video MOS as a function of packet loss ratio for sensitivity factors γ of 0.8 and data level 5, 6.
2015 IEEE Wireless Communications and Networking Conference (WCNC) New Orleans, LA, USA March 9-12, 2015 TABLE I.
S YSTEM
Parameter
Assumption
Cellular layout Cell radius Pico cells Mobility model
1/3 macrocell(s) 1 kilometer 0 or 2 picocell(s)/macrocell (Configuration 4b) Random Way Point (RWP) with speed of 0.1 km/h Uplink:1920MHz Downlink:2110MHz 10/20 MHz ITU Pedestrian A macro: 46 dBm pico: 30 dBm 23 dBm 1105.920 Kbits/s (Level 3) 967.680 Kbits/s (Level 4) 829.440 Kbits/s (Level 5) 691.200 Kbits/s (Level 6) File size: 15Mbytes 30/24/18 video Users (each user takes a data rate sensitivity factor of 0.8) and 30/24/18 FTP users The proposed scheduler and LTE baseline scheduler No ICIC used Ideal uplink receiver (no block error and packet loss)
Carrier frequency System bandwidth Channel model Total BS TX power UE power Video data rates FTP file size Number of users Scheduler ICIC Other assumptions
users with a data rate sensitivity factor γ of 0.8 and T W k = 1 in other cases. 2) Frequency Domain Scheduler: The same metric is applied as the LTE baseline scheduler except that F W n,k = 10 for video users with a data rate sensitivity factor γ of 0.8 for their respective best sub-band and F W n,k = 1 in other cases. III.
TABLE II.
SIMULATION CONFIGURATION
S YSTEM S IMULATION S ETUP
A. System Simulation Configuration The system simulation was run using the OPNET 17.5 Modeler with the LTE modules [15], as depicted in Table I. In this paper, we consider either one or three macrocell(s) and 2 overlaid picocells in each macrocell with 30/24/18 video users and 30/24/18 FTP users in each macro-plus-pico area. Video users and FTP users exist simultaneously in order to simulate practical scenarios with high traffic system loads. These configurations were evaluated for downlink scheduling, with an ideal uplink receiver, and Inter-cell Interference Coordination (ICIC) is not used.
Scenarios Scenario 1
Scenario 2
Scenario 3
S YSTEM
SIMULATION SCENARIOS
Assumption 10 MHz, 1 macrocell+2 picocells, 30 FTP users and 30 video users, each having a value for the data rate sensitivity factor γ of 0.8. 10 MHz, 1 macrocell+2 picocells, 18 FTP users and 18 video users, each having a value for the data rate sensitivity factor γ of 0.8. 20 MHz, 3 macrocells+6 picocells, 18 FTP users and 18 video users for each macrocell, each having a value for the data rate sensitivity factor γ of 0.8.
macrocell. In scenario 3, three macrocells and two picocells in each macrocell exist. For performance comparison, the scenarios where only macro cells are used, without picocells, for 30/18 FTP users and 30/18 video users in each macrocell are also simulated and the results appear below. IV.
S IMULATION R ESULTS
In the following figures, green (left), blue (center) and red (right) bars represent, respectively, the performance for 1) 1/3 macrocell(s) without picocells and user-specific QoS consideration, 2) 1/3 macrocell(s) with 2/6 picocells but without userspecific QoS consideration, and 3) 1/3 macrocell(s) with 2/6 picocells and with user-specific QoS consideration. A. FTP Throughput In this paper, FTP throughput per cell is defined as the total received MAC traffic in Mbits/sec for all the FTP users divided by the number of macrocells. Figures 4, 5 and 6 show the FTP throughput comparison for scenarios 1, 2 and 3, respectively, with and without user-specific QoS considered in heterogeneous networks. For comparison, the performance for a reference scenario where no picocells exist is also presented in the figures (i.e., green bar). From Figs. 4, 5 and 6, we can see that much better FTP throughput can be achieved when picocells are introduced in heterogeneous networks (i.e., between green and blue bars), and about 37%, 14% and 11%
B. System Simulation Scenarios Three scenarios corresponding to Configuration 4b of reference [16] were designed and simulated as described in Table II. In scenario 1, 30 FTP users and 30 video users that have a data rate sensitivity factor of 0.8 are assumed in the simulation for each macro-plus-pico area. Among the 60 users, 10 FTP users and 10 video users are randomly and uniformly spaced within a 40m radius of each picocell. The remaining 10 FTP users and 10 video users are randomly and uniformly spaced within the remaining area of the macrocell. In scenarios 2 and 3, 18 FTP users and 18 video users that have a data rate sensitivity factor of 0.8 are assumed in the simulation for each macro-plus-pico area. Among the 36 users, 6 FTP users and 6 video users are randomly and uniformly distributed within a 40m radius of each picocell. The remaining 6 FTP users and 6 video users are randomly and uniformly distributed within the remaining area of each
Fig. 4.
FTP throughput comparison for scenario 1.
2015 IEEE Wireless Communications and Networking Conference (WCNC) New Orleans, LA, USA March 9-12, 2015
Fig. 5.
FTP throughput comparison for scenario 2.
Fig. 7. FTP throughput improvement as a function of the number of video users for 1 macrocell-plus-2 picocells.
Fig. 6.
FTP throughput comparison for scenario 3.
Fig. 8.
throughput improvement (i.e., between blue and red bars) can be further achieved in scenarios 1, 2 and 3, respectively, when user-specific QoS is considered. The throughput improvement of FTP user results from the decreased throughput of video users when user-specific QoS is used in the proposed rate adaptation algorithm.
B. FTP Throughput Improvement vs Number of Video Users Figure 7 shows the FTP throughput improvement as a function of the number of video users. The FTP throughput improvement results from the lower data rate of video users when the user-specific QoS is considered. In this figure, 1 macrocell-plus-2 picocells are simulated with varying number of video users and FTP users of 18, 24, and 30. It can be found as the number of video users increases, a higher FTP throughput improvement can be achieved. That is because as the number of video users increases, more resources can be saved from video users and used to convey FTP data.
Video MOS comparison for scenario 1.
C. Video MOS Figures 8, 9 and 10 show the MOS comparison for scenarios 1, 2 and 3, respectively, with and without user-specific QoS considered in heterogeneous networks. For comparison, the performance for a reference scenario where no picocells exist is also presented in the figures (i.e., green bar). From Figs. 8, 9 and 10, we can see a much better MOS value (56%, 12%, and 53% improvement respectively) can be achieved when picocells are introduced in heterogeneous networks (i.e., between green and blue bars), while similar MOS value (i.e., between blue and red bars) can be maintained when the userspecific QoS is considered. As noted in Section IV.A, FTP throughput can be improved significantly. D. Homogeneous vs Heterogeneous Networks For scenario 2, 1 macrocell plus 2 picocells and purely 1 macrocell are compared, both taking into account userspecific QoS requirements. The average MAC throughput and SINR comparison for video users are listed in Table III.
2015 IEEE Wireless Communications and Networking Conference (WCNC) New Orleans, LA, USA March 9-12, 2015 TABLE III.
MAC
THROUGHPUT AND
Cases 1 macro 1 macro + 2 picos 3 macros 3 macros + 6 picos
MAC throughput (Mbps) 14.782 14.905 13.176 14.762
SINR COMPARISON SINR (dB) 34.3 39.5 25.4 38.7
system capacity gains on the order of greater than 10 percent in terms of FTP throughput can be achieved in heterogeneous networks when user-specific QoS requirements are considered, while maintaining an acceptable MOS level for video applications. VI.
Fig. 9.
Video MOS comparison for scenario 2.
ACKNOWLEDGMENT
This research was supported by NSF Grant 1352883. We would like to thank Drs. Huseyin Arslan and Zygmunt Haas for many stimulating and enlightening discussions during this research. We would like to thank Riverbed for providing its NetModeler Suite of simulation software. R EFERENCES [1] [2]
[3]
[4]
[5]
[6]
[7] Fig. 10.
Video MOS comparison for scenario 3. [8]
From this table, we can see a ˜5dB average SINR increase in heterogeneous networks results in about only less than 1% MAC throughput increase (i.e., higher video data rate). Therefore, most of the system capacity gain is maintained in heterogeneous networks. Similarly, for scenario 3, 3 macrocells plus 6 picocells and purely 3 macrocells are compared, both taking into account user-specific QoS requirements. The average MAC throughput and SINR comparison for video users are also listed in Table III. From this table, we can see a ˜13dB average SINR increase in heterogeneous networks results in ˜12% MAC throughput increase (i.e., higher video data rate). Therefore, only part of the system capacity gain can be maintained in heterogeneous networks.
[9]
[10]
[11]
[12]
[13]
[14]
V.
C ONCLUSIONS
In this paper, we presented the performance evaluation results for heterogeneous networks when novel rate adaptation and MAC scheduling algorithms are used for video applications considering user-specific QoS requirements. Significant
[15] [16]
H. Ekstrom, “QoS control in the 3gpp evolved packet system,” IEEE Commun. Mag., vol. 47, no. 2, pp. 76–83, 2009. 3GPP, “TS 23.203 - v10.9.0 - digital cellular telecommunications system (phase 2+); universal mobile telecommunications system (UMTS); LTE; policy and charging control architecture.” R. Blake, M. Rizzo, and S. McEvoy, “Aging and perception of visual form from temporal structure,” Psychol. Aging, vol. 23, no. 1, pp. 181– 189, Mar. 2008. S. Khan, S. Duhovnikov, E. Steinbach, and W. Kellerer, “MOS-based multiuser multiapplication cross-layer optimization for mobile multimedia communication,” Adv. Multimed., vol. 2007, pp. 1–11, 2007. A. Saul and G. Auer, “Multiuser resource allocation maximizing the perceived quality,” EURASIP J WIREL COMM, vol. 2009, pp. 1–15, 2009. T. Han, N. Ansari, M. Wu, and H. Yu, “On accelerating content delivery in mobile networks,” IEEE Commun. Surveys Tuts., vol. 15, no. 3, pp. 1314–1333, 2013. C. He and R. D. Gitlin, “User specific QoS and its application in resources scheduling for wireless system,” in ICA3PP 2014, pp. 809821, Aug. 2014. C. He and R. D. Gitlin, “Application-specific and QoS-aware scheduling for wireless systems,” in IEEE PIMRC 2014, pp. 1147–1151, Sep. 2014. A. Damnjanovic, J. Montojo, Y. Wei, T. Ji, T. Luo, M. Vajapeyam, T. Yoo, O. Song, and D. Malladi, “A survey on 3gpp heterogeneous networks,” IEEE Wirel. Commun., vol. 18, no. 3, pp. 10–21, Jun. 2011. Y. S. Soh, T. Quek, M. Kountouris, and H. Shin, “Energy efficient heterogeneous cellular networks,” IEEE J. Sel. Areas Commun., vol. 31, no. 5, pp. 840–850, May 2013. D. Jurca and P. Frossard, “Media flow rate allocation in multipath networks,” IEEE Trans. Multimedia, vol. 9, no. 6, pp. 1227–1240, Oct. 2007. K. C. Beh, S. Armour, and A. Doufexi, “Joint time-frequency domain proportional fair scheduler with HARQ for 3gpp LTE systems,” in IEEE VTC, 2008 Fall, pp. 1–5. P. Kela, J. Puttonen, N. Kolehmainen, T. Ristaniemi, T. Henttonen, and M. Moisio, “Dynamic packet scheduling performance in UTRA long term evolution downlink,” in IEEE ISWPC, 2008, pp. 308–313. 3GPP, “TS 29.213 - v11.8.0 - digital cellular telecommunications system (phase 2+); universal mobile telecommunications system (UMTS); LTE; policy and charging control signalling flows and quality of service (QoS) parameter mapping.” “OPNET,” Feb. 2014. [Online]. Available: http://www.opnet.com/ 3GPP, “TS 36.814 - v9.0.0 - evolved universal terrestrial radio access (E-UTRA); further advancements for E-UTRA physical layer aspects.”