Jun 23, 1999 - 3.2.2 Customer Arrivals, Service, and Routing . ...... transmit frames to a station that is in power-save mode queue the frames till the destination ..... load periods, shorter length versions of the full length messages ... Queueing network analysis is a valuable tool for determining the ...... [4.114E-01, 4.720E-01].
Improving the Real-Time Performance of a Wireless Local Area Network Rusty O. Baldwin
Dissertation submitted to the Faculty of the Virginia Polytechnic Institute and State University in partial fulfillment of the requirements for the degree of
Doctor of Philosophy in Electrical Engineering
N.J. Davis IV, Chair C.W. Bostian S.F. Midkiff F.G. Gray J.E. Kobza
June 23, 1999 Blacksburg, Virginia
Keywords: Wireless LAN, Real time systems, Access protocols, Integrated voice-data communication, Queueing models Copyright 1999, Rusty O. Baldwin
Improving the Real-Time Performance of a Wireless Local Area Network Rusty O. Baldwin (ABSTRACT)
This research considers the transmission of real-time data within a wireless local area network (WLAN). Exact and approximate analytic network evaluation techniques are examined. The suitability of using a given technique in a particular situation is discussed. Simulation models are developed to study the performance of our protocol RT-MAC (realtime medium access control). RT-MAC is a novel, simple, and elegant MAC protocol for use in transmitting real-time data in point to point ad hoc WLAN. Our enhancement of IEEE 802.11, RT-MAC, achieves dramatic reductions in mean delay, missed deadlines, and packet collisions by selectively discarding packets and sharing station state information. For example, in a 50 station network with a normalized offered load of 0.7, mean delay is reduced from more than 14 seconds to less than 45 ms, late packets are reduced from 76% to less than 1%, and packet collisions are reduced from 36% to less than 1%. Stations using RTMAC are interoperable with stations using IEEE 802.11. In networks with both RT-MAC and IEEE 802.11 stations, significant performance improvements were seen even when more than half of the stations in the network were not RT-MAC stations. The effect of the wireless channel and its impact on the ability of a WLAN to meet packet deadlines is evaluated. It is found that, in some cases, other factors such as the number of stations in the network and the offered load are more significant than the condition of the wireless channel. Regression models are developed from simulation data to predict network behavior in terms of throughput, mean delay, missed deadline ratio, and collision ratio. Telemetry, avionics, and packetized voice traffic models are considered.
The applicability of this research is not limited to real-time wireless networks. Indeed, the collision reduction algorithm of RT-MAC is independent of the data being transported. Furthermore, RT-MAC would perform equally well in wired networks. Incorporating the results of this research into existing protocols will result in immediate and dramatic improvements in network performance.
iii
Dedication To my beloved wife Heather and our children Ian, Nathan, Ryan, Carrie, Noel, and Bethany.
iv
Acknowledgments During the course of this research, I have received the assistance of many people for which I am very grateful. Chief among these is my advisor, Dr. Davis. During the inevitable crises that occur during a course of research, his expertise, experience, and reassurance were much needed and appreciated. I would also like to thank Dr. Midkiff for his thorough and honest critiques that kept me focused. Dr. Kobza was especially helpful when dealing with the mathematical intricacies of queueing systems. Thanks also go to Dr. Bostian and Dr. Gray for their helpful comments on the drafts of this dissertation. I would also like to thank the faculty and staff of the Center for Wireless Telecommunications; especially, Mr. Woody Farley and Ms. Angie Rutledge. For the use of computing facilities, I am indebted to the Virginia Tech Information Systems Center. For help on statistical matters, I relied heavily on Mr. Robert Noble from the Statistical Consulting Center. Any statistical errors or misstatements that are contained herein are due to my not asking for (or not heeding) the wise advice of Mr. Noble.
v
Contents
1 Introduction
1
1.1 Background . . . . . . . . . . . . . . . . . . . . . . . . . . . . . . . . . . . .
1
1.2 Research Goals . . . . . . . . . . . . . . . . . . . . . . . . . . . . . . . . . .
3
1.3 Document Overview . . . . . . . . . . . . . . . . . . . . . . . . . . . . . . .
5
2 Background and Literature Survey
7
2.1 OSI Network Model . . . . . . . . . . . . . . . . . . . . . . . . . . . . . . . .
7
2.1.1
The Physical Layer . . . . . . . . . . . . . . . . . . . . . . . . . . . .
9
2.1.2
Data Link Control Layer . . . . . . . . . . . . . . . . . . . . . . . . .
9
2.1.3
The Network Layer . . . . . . . . . . . . . . . . . . . . . . . . . . . .
10
2.1.4
The Transport Layer . . . . . . . . . . . . . . . . . . . . . . . . . . .
10
2.1.5
The Session Layer . . . . . . . . . . . . . . . . . . . . . . . . . . . . .
10
2.1.6
The Presentation Layer . . . . . . . . . . . . . . . . . . . . . . . . . .
11
2.1.7
The Application Layer . . . . . . . . . . . . . . . . . . . . . . . . . .
11
2.2 Wireless Medium Access Control (MAC) Protocols
. . . . . . . . . . . . . . . . . . . . . . . . . . . . . . . . . . . . . vi
12
2.2.1
ALOHA . . . . . . . . . . . . . . . . . . . . . . . . . . . . . . . . . .
12
2.2.2
Carrier Sense Multiple Access (CSMA) . . . . . . . . . . . . . . . . .
14
2.2.3
IEEE 802.11 . . . . . . . . . . . . . . . . . . . . . . . . . . . . . . . .
16
2.2.3.1
The Distributed Coordination Function . . . . . . . . . . .
17
2.2.3.2
Point Coordination Function . . . . . . . . . . . . . . . . .
19
2.2.3.3
IEEE 802.11 Performance . . . . . . . . . . . . . . . . . . .
20
Real-time Medium Access Control (MAC) Protocols . . . . . . . . . .
20
2.2.4.1
Contention-based MAC Protocols . . . . . . . . . . . . . . .
21
2.2.4.2
Controlled Access MAC Protocols
. . . . . . . . . . . . . .
23
2.3 Traffic and Channel Models . . . . . . . . . . . . . . . . . . . . . . . . . . .
24
2.2.4
2.3.1
Traffic Models . . . . . . . . . . . . . . . . . . . . . . . . . . . . . . .
24
2.3.2
Channel Models . . . . . . . . . . . . . . . . . . . . . . . . . . . . . .
29
2.4 Related Research Efforts . . . . . . . . . . . . . . . . . . . . . . . . . . . . .
30
2.4.1
IEEE 802.11 . . . . . . . . . . . . . . . . . . . . . . . . . . . . . . . .
31
2.4.1.1
Voice over IEEE 802.11 . . . . . . . . . . . . . . . . . . . .
31
2.4.1.2
Modified Backoff Algorithms . . . . . . . . . . . . . . . . .
31
Real-time Wireless Medium Access Control . . . . . . . . . . . . . . .
33
2.4.2.1
IEEE 802.11 Compatible Schemes . . . . . . . . . . . . . . .
33
2.4.2.2
Hard Real-Time Schemes . . . . . . . . . . . . . . . . . . .
33
2.5 Summary . . . . . . . . . . . . . . . . . . . . . . . . . . . . . . . . . . . . .
34
2.4.2
3 Analytic Network Analysis Techniques
vii
35
3.1 Introduction . . . . . . . . . . . . . . . . . . . . . . . . . . . . . . . . . . . .
36
3.2 Queuing Network Classification . . . . . . . . . . . . . . . . . . . . . . . . .
36
3.2.1
Open, Closed, and Mixed Networks . . . . . . . . . . . . . . . . . . .
36
3.2.2
Customer Arrivals, Service, and Routing . . . . . . . . . . . . . . . .
38
3.2.3
Continuous and Discrete Time Networks . . . . . . . . . . . . . . . .
38
3.2.4
Interfering Queues . . . . . . . . . . . . . . . . . . . . . . . . . . . .
39
3.2.5
Global, Local, and Detailed Balance . . . . . . . . . . . . . . . . . . .
40
3.2.5.1
Global Balance . . . . . . . . . . . . . . . . . . . . . . . . .
42
3.2.5.2
Local Balance . . . . . . . . . . . . . . . . . . . . . . . . . .
45
3.2.5.3
Detailed Balance . . . . . . . . . . . . . . . . . . . . . . . .
47
Reversibility . . . . . . . . . . . . . . . . . . . . . . . . . . . . . . . .
48
3.2.6.1
Detailed Balance Equations . . . . . . . . . . . . . . . . . .
49
3.2.6.2
Canonical Form . . . . . . . . . . . . . . . . . . . . . . . . .
50
Normalization Constant . . . . . . . . . . . . . . . . . . . . . . . . .
52
3.2.7.1
z–transform Method . . . . . . . . . . . . . . . . . . . . . .
53
3.2.7.2
Convolution Algorithm . . . . . . . . . . . . . . . . . . . . .
54
3.2.7.3
Performance Metrics . . . . . . . . . . . . . . . . . . . . . .
59
3.3 Analysis Methods . . . . . . . . . . . . . . . . . . . . . . . . . . . . . . . . .
60
3.2.6
3.2.7
3.3.1
Exact Analysis Models . . . . . . . . . . . . . . . . . . . . . . . . . .
60
3.3.1.1
Jackson Networks . . . . . . . . . . . . . . . . . . . . . . . .
60
3.3.1.2
BCMP Networks . . . . . . . . . . . . . . . . . . . . . . . .
63
viii
3.3.2
Approximate Analysis Methods . . . . . . . . . . . . . . . . . . . . .
70
3.3.2.1
Mean Value Analysis . . . . . . . . . . . . . . . . . . . . . .
70
3.3.2.2
Equilibrium Point Analysis . . . . . . . . . . . . . . . . . .
74
3.4 Overview of Analysis Techniques . . . . . . . . . . . . . . . . . . . . . . . .
77
3.5 Summary . . . . . . . . . . . . . . . . . . . . . . . . . . . . . . . . . . . . .
79
4 Objectives and Methodology
81
4.1 Problem Definition . . . . . . . . . . . . . . . . . . . . . . . . . . . . . . . .
82
4.1.1
Research Thesis and Objectives . . . . . . . . . . . . . . . . . . . . .
82
4.1.2
System Boundaries . . . . . . . . . . . . . . . . . . . . . . . . . . . .
84
4.1.2.1
Propagation Delay . . . . . . . . . . . . . . . . . . . . . . .
85
4.1.2.2
Packet Length . . . . . . . . . . . . . . . . . . . . . . . . .
85
4.1.2.3
MAC and Physical Layer Implementations . . . . . . . . . .
85
4.2 System Services . . . . . . . . . . . . . . . . . . . . . . . . . . . . . . . . . .
85
4.3 Performance Metrics . . . . . . . . . . . . . . . . . . . . . . . . . . . . . . .
86
4.3.1
Throughput . . . . . . . . . . . . . . . . . . . . . . . . . . . . . . . .
86
4.3.2
Mean Delay . . . . . . . . . . . . . . . . . . . . . . . . . . . . . . . .
86
4.3.3
Missed Deadline Ratio . . . . . . . . . . . . . . . . . . . . . . . . . .
87
4.3.4
Collision Ratio . . . . . . . . . . . . . . . . . . . . . . . . . . . . . .
87
4.4 System Model Parameters . . . . . . . . . . . . . . . . . . . . . . . . . . . .
87
4.4.1
Network Topology
. . . . . . . . . . . . . . . . . . . . . . . . . . . .
87
4.4.2
Capture . . . . . . . . . . . . . . . . . . . . . . . . . . . . . . . . . .
88
ix
4.4.3
Power Considerations . . . . . . . . . . . . . . . . . . . . . . . . . . .
88
4.4.4
Wireless MAC Functions . . . . . . . . . . . . . . . . . . . . . . . . .
88
4.4.5
Number of Stations . . . . . . . . . . . . . . . . . . . . . . . . . . . .
88
4.4.6
Normalized Offered Load . . . . . . . . . . . . . . . . . . . . . . . . .
89
4.4.7
Traffic Model . . . . . . . . . . . . . . . . . . . . . . . . . . . . . . .
89
4.4.8
Channel Model . . . . . . . . . . . . . . . . . . . . . . . . . . . . . .
89
4.4.9
MAC Protocol . . . . . . . . . . . . . . . . . . . . . . . . . . . . . . .
89
4.4.10 MAC Protocol Parameters . . . . . . . . . . . . . . . . . . . . . . . .
89
4.4.11 Physical Layer Parameters . . . . . . . . . . . . . . . . . . . . . . . .
90
4.4.12 Other Parameters . . . . . . . . . . . . . . . . . . . . . . . . . . . . .
90
4.5 System Factors . . . . . . . . . . . . . . . . . . . . . . . . . . . . . . . . . .
90
4.5.1
Number of Stations . . . . . . . . . . . . . . . . . . . . . . . . . . . .
92
4.5.2
Normalized Offered Load . . . . . . . . . . . . . . . . . . . . . . . . .
92
4.5.3
Channel Model . . . . . . . . . . . . . . . . . . . . . . . . . . . . . .
93
4.5.4
MAC Protocol . . . . . . . . . . . . . . . . . . . . . . . . . . . . . . .
93
4.6 Evaluation Technique . . . . . . . . . . . . . . . . . . . . . . . . . . . . . . .
93
4.7 Traffic Models (Workload) . . . . . . . . . . . . . . . . . . . . . . . . . . . .
94
4.8 Experimental Design . . . . . . . . . . . . . . . . . . . . . . . . . . . . . . .
95
4.8.1
Data Collected . . . . . . . . . . . . . . . . . . . . . . . . . . . . . .
97
4.8.2
Termination Criteria . . . . . . . . . . . . . . . . . . . . . . . . . . .
97
4.9 Summary . . . . . . . . . . . . . . . . . . . . . . . . . . . . . . . . . . . . .
99
x
5 Real-time MAC (RT-MAC)
100
5.1 Transmission Control . . . . . . . . . . . . . . . . . . . . . . . . . . . . . . . 101 5.2 Enhanced Collision Avoidance (ECA) Algorithm . . . . . . . . . . . . . . . . 103 5.3 Summary . . . . . . . . . . . . . . . . . . . . . . . . . . . . . . . . . . . . . 104 6 Simulation Results
106
6.1 Telemetry Traffic Model . . . . . . . . . . . . . . . . . . . . . . . . . . . . . 107 6.1.1
Normalized Throughput . . . . . . . . . . . . . . . . . . . . . . . . . 107 6.1.1.1
Throughput Performance Summary . . . . . . . . . . . . . . 108
6.1.1.2
Usable Throughput . . . . . . . . . . . . . . . . . . . . . . . 110
6.1.2
Mean Delay . . . . . . . . . . . . . . . . . . . . . . . . . . . . . . . . 111
6.1.3
Missed Deadlines . . . . . . . . . . . . . . . . . . . . . . . . . . . . . 112
6.1.4
Collisions . . . . . . . . . . . . . . . . . . . . . . . . . . . . . . . . . 115
6.1.5
Bursty Error Channel
. . . . . . . . . . . . . . . . . . . . . . . . . . 116
6.2 Avionics Traffic Model . . . . . . . . . . . . . . . . . . . . . . . . . . . . . . 118 6.2.1
Normalized Throughput . . . . . . . . . . . . . . . . . . . . . . . . . 118 6.2.1.1
Throughput Performance Summary . . . . . . . . . . . . . . 118
6.2.1.2
Usable Throughput . . . . . . . . . . . . . . . . . . . . . . . 120
6.2.2
Mean Delay . . . . . . . . . . . . . . . . . . . . . . . . . . . . . . . . 120
6.2.3
Mean Delay Performance Summary . . . . . . . . . . . . . . . . . . . 122
6.2.4
Missed Deadlines . . . . . . . . . . . . . . . . . . . . . . . . . . . . . 125
6.2.5
Missed Deadline Performance Summary xi
. . . . . . . . . . . . . . . . 125
6.2.6
Collisions . . . . . . . . . . . . . . . . . . . . . . . . . . . . . . . . . 126
6.2.7
Bursty Error Channel
. . . . . . . . . . . . . . . . . . . . . . . . . . 128
6.3 Voice with Non Real-time Data Traffic Model . . . . . . . . . . . . . . . . . 129 6.3.1
6.3.2
1 Mbps Data Rate . . . . . . . . . . . . . . . . . . . . . . . . . . . . 130 6.3.1.1
Normalized Throughput . . . . . . . . . . . . . . . . . . . . 130
6.3.1.2
Throughput Performance Summary . . . . . . . . . . . . . . 131
6.3.1.3
Usable Throughput . . . . . . . . . . . . . . . . . . . . . . . 131
6.3.1.4
Mean Delay . . . . . . . . . . . . . . . . . . . . . . . . . . . 133
6.3.1.5
Mean Delay Performance Summary . . . . . . . . . . . . . . 136
6.3.1.6
Missed Deadlines . . . . . . . . . . . . . . . . . . . . . . . . 136
6.3.1.7
1 Mbps Data Rate Missed Deadline Performance Summary . 137
6.3.1.8
Collisions . . . . . . . . . . . . . . . . . . . . . . . . . . . . 140
10 Mbps Data Rate . . . . . . . . . . . . . . . . . . . . . . . . . . . . 142 6.3.2.1
Normalized Throughput . . . . . . . . . . . . . . . . . . . . 142
6.3.2.2
Throughput Performance Summary . . . . . . . . . . . . . . 144
6.3.2.3
Mean Delay . . . . . . . . . . . . . . . . . . . . . . . . . . . 146
6.3.2.4
Mean Delay Performance Summary . . . . . . . . . . . . . . 147
6.3.2.5
Missed Deadlines . . . . . . . . . . . . . . . . . . . . . . . . 148
6.3.2.6
10 Mbps Data Rate Missed Deadline Performance Summary 151
6.3.2.7
Collisions . . . . . . . . . . . . . . . . . . . . . . . . . . . . 151
6.4 Other Simulations Studies . . . . . . . . . . . . . . . . . . . . . . . . . . . . 158
xii
6.4.1
RT-MAC Enhancements Study . . . . . . . . . . . . . . . . . . . . . 158 6.4.1.1
Throughput . . . . . . . . . . . . . . . . . . . . . . . . . . . 159
6.4.1.2
Mean Delay . . . . . . . . . . . . . . . . . . . . . . . . . . . 161
6.4.1.3
Missed Deadline . . . . . . . . . . . . . . . . . . . . . . . . 161
6.4.1.4
Collisions . . . . . . . . . . . . . . . . . . . . . . . . . . . . 163
6.4.1.5
Summary . . . . . . . . . . . . . . . . . . . . . . . . . . . . 163
6.4.2
Contention Window Expansion Study . . . . . . . . . . . . . . . . . . 166
6.4.3
Service Disciplines Study . . . . . . . . . . . . . . . . . . . . . . . . . 167
6.4.4
Networks with RT-MAC and IEEE 802.11 Stations . . . . . . . . . . 168
6.4.5
6.4.4.1
Telemetry Traffic Model . . . . . . . . . . . . . . . . . . . . 169
6.4.4.2
Avionics Traffic Model . . . . . . . . . . . . . . . . . . . . . 171
Static BER Study . . . . . . . . . . . . . . . . . . . . . . . . . . . . . 173 6.4.5.1
10 Mbps Maximum Capacity Study . . . . . . . . . . . . . . 178
6.5 Summary . . . . . . . . . . . . . . . . . . . . . . . . . . . . . . . . . . . . . 179 7 Regression Models
181
7.1 Linear Regression Assumptions . . . . . . . . . . . . . . . . . . . . . . . . . 181 7.2 Regression Model Tables and Figures . . . . . . . . . . . . . . . . . . . . . . 184 7.2.1
Telemetry Traffic Model . . . . . . . . . . . . . . . . . . . . . . . . . 186
7.2.2
Avionics Traffic Model . . . . . . . . . . . . . . . . . . . . . . . . . . 190
7.2.3
Voice Traffic Model . . . . . . . . . . . . . . . . . . . . . . . . . . . . 195 7.2.3.1
1 Mbps . . . . . . . . . . . . . . . . . . . . . . . . . . . . . 195 xiii
7.2.3.2
10 Mbps . . . . . . . . . . . . . . . . . . . . . . . . . . . . . 201
7.3 Predictive Power of Models . . . . . . . . . . . . . . . . . . . . . . . . . . . 206 7.4 Summary . . . . . . . . . . . . . . . . . . . . . . . . . . . . . . . . . . . . . 210 8 Conclusions and Recommendations
211
8.1 Summary of Research . . . . . . . . . . . . . . . . . . . . . . . . . . . . . . . 211 8.2 Conclusions . . . . . . . . . . . . . . . . . . . . . . . . . . . . . . . . . . . . 214 8.3 Recommendations for Future Research . . . . . . . . . . . . . . . . . . . . . 215 A Simulation Documentation
230
A.1 Simulation Tool . . . . . . . . . . . . . . . . . . . . . . . . . . . . . . . . . . 230 A.2 SDL Overview . . . . . . . . . . . . . . . . . . . . . . . . . . . . . . . . . . . 231 A.3 Wireless LAN Simulation Model . . . . . . . . . . . . . . . . . . . . . . . . . 236 A.3.1 Node Model . . . . . . . . . . . . . . . . . . . . . . . . . . . . . . . . 237 A.3.2 Process Models . . . . . . . . . . . . . . . . . . . . . . . . . . . . . . 237 A.3.2.1 Source . . . . . . . . . . . . . . . . . . . . . . . . . . . . . . 241 A.3.2.2 Packet Queue . . . . . . . . . . . . . . . . . . . . . . . . . . 243 A.3.2.3 Sink . . . . . . . . . . . . . . . . . . . . . . . . . . . . . . . 244 A.3.2.4 Transmitter, Receiver, and Antenna . . . . . . . . . . . . . 244 A.3.2.5 Backoff Procedure . . . . . . . . . . . . . . . . . . . . . . . 245 A.3.2.6 Data Pump . . . . . . . . . . . . . . . . . . . . . . . . . . . 248 A.3.2.7 Filter MPDU . . . . . . . . . . . . . . . . . . . . . . . . . . 248
xiv
A.3.2.8 Channel State
. . . . . . . . . . . . . . . . . . . . . . . . . 249
A.3.2.9 Tx Coordination sta . . . . . . . . . . . . . . . . . . . . . . 255 A.3.2.10 Rx Coordination . . . . . . . . . . . . . . . . . . . . . . . . 261 A.3.2.11 Packet Format . . . . . . . . . . . . . . . . . . . . . . . . . 263 A.3.2.12 Traffic Monitor . . . . . . . . . . . . . . . . . . . . . . . . . 263 A.4 Simulation Parameters . . . . . . . . . . . . . . . . . . . . . . . . . . . . . . 265 A.4.1 IEEE80211STA . . . . . . . . . . . . . . . . . . . . . . . . . . . . . . 265 A.4.1.1 aCCATime . . . . . . . . . . . . . . . . . . . . . . . . . . . 266 A.4.1.2 aCWmax . . . . . . . . . . . . . . . . . . . . . . . . . . . . 266 A.4.1.3 aCWmin . . . . . . . . . . . . . . . . . . . . . . . . . . . . 266 A.4.1.4 aMPDUMaxLength
. . . . . . . . . . . . . . . . . . . . . . 266
A.4.1.5 aPLCPHeaderLength . . . . . . . . . . . . . . . . . . . . . . 266 A.4.1.6 aPreambleLength . . . . . . . . . . . . . . . . . . . . . . . . 266 A.4.1.7 aRxPLCPDelay . . . . . . . . . . . . . . . . . . . . . . . . . 267 A.4.1.8 aRxRFDelay . . . . . . . . . . . . . . . . . . . . . . . . . . 267 A.4.1.9 aRxTxTurnaroundTime . . . . . . . . . . . . . . . . . . . . 267 A.4.1.10 aShortRetryLimit . . . . . . . . . . . . . . . . . . . . . . . . 267 A.4.1.11 aSifsTime . . . . . . . . . . . . . . . . . . . . . . . . . . . . 267 A.4.1.12 aSlotTime . . . . . . . . . . . . . . . . . . . . . . . . . . . . 267 A.4.1.13 aTxPLCPDelay . . . . . . . . . . . . . . . . . . . . . . . . . 268 A.4.1.14 aTxRFDelay . . . . . . . . . . . . . . . . . . . . . . . . . . 268
xv
A.4.1.15 ACK Length . . . . . . . . . . . . . . . . . . . . . . . . . . 268 A.4.1.16 ACK Timeout . . . . . . . . . . . . . . . . . . . . . . . . . 268 A.4.1.17 Backoff Algorithm . . . . . . . . . . . . . . . . . . . . . . . 268 A.4.1.18 MACHeaderLength . . . . . . . . . . . . . . . . . . . . . . . 269 A.4.1.19 Mean Time in Bad State . . . . . . . . . . . . . . . . . . . . 269 A.4.1.20 Mean Time in Good State . . . . . . . . . . . . . . . . . . . 269 A.4.1.21 Number of Stations . . . . . . . . . . . . . . . . . . . . . . . 269 A.4.1.22 Packet format . . . . . . . . . . . . . . . . . . . . . . . . . . 270 A.4.1.23 Print Errored Packets . . . . . . . . . . . . . . . . . . . . . 270 A.4.1.24 Print Packets . . . . . . . . . . . . . . . . . . . . . . . . . . 270 A.4.1.25 Probability of Bit Error . . . . . . . . . . . . . . . . . . . . 270 A.4.1.26 Queue Discipline . . . . . . . . . . . . . . . . . . . . . . . . 271 A.4.1.27 RxTxRate . . . . . . . . . . . . . . . . . . . . . . . . . . . . 271 A.4.1.28 sAckCtsLng . . . . . . . . . . . . . . . . . . . . . . . . . . . 271 A.4.1.29 sMaxMsduLng . . . . . . . . . . . . . . . . . . . . . . . . . 271 A.4.1.30 SA . . . . . . . . . . . . . . . . . . . . . . . . . . . . . . . . 271 A.4.1.31 Sequence Number
. . . . . . . . . . . . . . . . . . . . . . . 272
A.4.1.32 Transmission Control . . . . . . . . . . . . . . . . . . . . . . 272 A.4.2 IEEE80211MON . . . . . . . . . . . . . . . . . . . . . . . . . . . . . 272 A.4.3 Traffic Monitor . . . . . . . . . . . . . . . . . . . . . . . . . . . . . . 272 A.4.3.1 [Throughput, HRT Failure, Collision, Mean Delay] Termination Condition . . . . . . . . . . . . . . . . . . . . . . . . . 273 xvi
A.4.3.2 [Throughput, HRT Failure, Collision, Mean Delay] Confidence Interval Width . . . . . . . . . . . . . . . . . . . . . . 273 A.4.3.3 [Throughput, HRT Failure, Collision, Mean Delay] Confidence Level . . . . . . . . . . . . . . . . . . . . . . . . . . . 273 A.4.3.4 Statistics File . . . . . . . . . . . . . . . . . . . . . . . . . . 273 A.4.3.5 Print Statistics to Screen . . . . . . . . . . . . . . . . . . . 274 A.4.4 Source . . . . . . . . . . . . . . . . . . . . . . . . . . . . . . . . . . . 274 A.4.4.1 Active Source (Boolean) . . . . . . . . . . . . . . . . . . . . 274 A.4.4.2 [Hard Real Time, Soft Real Time, Data] Sources (integer) . 274 A.4.4.3 Number of Stations Transmitted To (double) . . . . . . . . 275 A.4.4.4 [HRT[1–3], SRT[1–3], D[1–3]] Interarrival Distribution (string)275 A.4.4.5 [HRT[1–3], SRT[1–3], D[1–3]] Interarrival Parameter [1,2] (double) . . . . . . . . . . . . . . . . . . . . . . . . . . . . . . . 275 A.4.4.6 [HRT[1–3], SRT[1–3], D[1–3]] ON-OFF Rate (double) . . . . 276 A.4.4.7 [HRT[1–3], SRT[1–3]] Deadline Distribution (string) . . . . . 276 A.4.4.8 [HRT[1–3], SRT[1–3]] Deadline Parameter [1,2] (double) . . 276 A.4.4.9 [HRT[1–3], SRT[1–3] Deadline Lower Bound (double) . . . . 277 A.4.4.10 [HRT[1–3], SRT[1–3] Deadline Upper Bound (double) . . . . 277 A.4.4.11 [HRT[1–3], SRT[1–3], D[1–3]] Packet Size Distribution (string)277 A.4.4.12 [HRT[1–3], SRT[1–3], D[1–3]] Packet Size Parameter [1,2] (double) . . . . . . . . . . . . . . . . . . . . . . . . . . . . . 277 A.4.5 Data Pump . . . . . . . . . . . . . . . . . . . . . . . . . . . . . . . . 278
xvii
A.4.5.1 Percentage of Blocked Packets Resubmitted . . . . . . . . . 278 A.4.6 Receiver, Transceiver Pipeline, Transmitter, Antenna . . . . . . . . . 278 A.4.6.1 Receiver . . . . . . . . . . . . . . . . . . . . . . . . . . . . . 278 A.4.6.2 Transmitter . . . . . . . . . . . . . . . . . . . . . . . . . . . 279 A.4.6.3 Transceiver Pipeline . . . . . . . . . . . . . . . . . . . . . . 280 A.4.6.4 Antenna . . . . . . . . . . . . . . . . . . . . . . . . . . . . . 281 A.5 Model Validation . . . . . . . . . . . . . . . . . . . . . . . . . . . . . . . . . 281 A.6 Summary . . . . . . . . . . . . . . . . . . . . . . . . . . . . . . . . . . . . . 282 B Simulation Data Tables
285
B.1 Telemetry Traffic Model . . . . . . . . . . . . . . . . . . . . . . . . . . . . . 286 B.2 Avionics Traffic Model . . . . . . . . . . . . . . . . . . . . . . . . . . . . . . 290 B.3 Voice with Non Real-time Traffic Model . . . . . . . . . . . . . . . . . . . . 294 B.3.1 1 Mbps Data Rate . . . . . . . . . . . . . . . . . . . . . . . . . . . . 294 B.3.2 10 Mbps Data Rate . . . . . . . . . . . . . . . . . . . . . . . . . . . . 297 B.4 Other Simulations . . . . . . . . . . . . . . . . . . . . . . . . . . . . . . . . . 301 B.4.1 RT-MAC Enhancements Study . . . . . . . . . . . . . . . . . . . . . 301 B.4.2 Contention Window Expansion Study . . . . . . . . . . . . . . . . . . 301 B.4.2.1
1 Mbps Channel . . . . . . . . . . . . . . . . . . . . . . . . 301
B.4.2.2
10 Mbps Channel . . . . . . . . . . . . . . . . . . . . . . . . 302
B.4.3 Service Disciplines . . . . . . . . . . . . . . . . . . . . . . . . . . . . 302 B.4.4 RT-MAC/Non RT-MAC Networks . . . . . . . . . . . . . . . . . . . 302 xviii
B.4.5 Static BER . . . . . . . . . . . . . . . . . . . . . . . . . . . . . . . . 304 C Statistical Comparison Method and Regression Tables
306
C.1 Statistical Comparison for Unpaired Observations . . . . . . . . . . . . . . . 306 C.2 Glossary of SAS Output Table Terms . . . . . . . . . . . . . . . . . . . . . . 307 C.3 SAS Output Tables . . . . . . . . . . . . . . . . . . . . . . . . . . . . . . . . 309 C.3.1 Telemetry Regression Model . . . . . . . . . . . . . . . . . . . . . . . 309 C.3.2 Avionics Traffic Model . . . . . . . . . . . . . . . . . . . . . . . . . . 313 C.3.3 Voice with Non Real-time Traffic Model . . . . . . . . . . . . . . . . 318 C.3.3.1
1 Mbps Data Rate . . . . . . . . . . . . . . . . . . . . . . . 318
C.3.3.2
10 Mbps Data Rate . . . . . . . . . . . . . . . . . . . . . . 323
xix
List of Figures 2.1 OSI Network Model . . . . . . . . . . . . . . . . . . . . . . . . . . . . . . . .
8
2.2 Performance of ALOHA Protocols . . . . . . . . . . . . . . . . . . . . . . . .
14
2.3 Throughput in Non-Persistent CSMA . . . . . . . . . . . . . . . . . . . . . .
16
2.4 MAC Architecture . . . . . . . . . . . . . . . . . . . . . . . . . . . . . . . .
18
2.5 IEEE 802.11 Basic Access Method . . . . . . . . . . . . . . . . . . . . . . . .
19
2.6 CFP/CP Alternation . . . . . . . . . . . . . . . . . . . . . . . . . . . . . . .
20
2.7 Performance of IEEE 802.11 versus ALOHA and CSMA . . . . . . . . . . .
21
2.8 Taxonomy for multiple-access protocols . . . . . . . . . . . . . . . . . . . . .
22
2.9 Virtual Time Protocol Example Timeline . . . . . . . . . . . . . . . . . . . .
23
2.10 Gilbert Model Transition Diagram . . . . . . . . . . . . . . . . . . . . . . . .
29
3.1 An Open Network . . . . . . . . . . . . . . . . . . . . . . . . . . . . . . . . .
37
3.2 A Closed Network . . . . . . . . . . . . . . . . . . . . . . . . . . . . . . . . .
37
3.3 Closed Queueing Network - M = 3, N = 2 . . . . . . . . . . . . . . . . . . .
42
3.4 State Transition Diagram
. . . . . . . . . . . . . . . . . . . . . . . . . . . .
43
3.5 Closed Tandem Queueing Network – M = 2, N = 3 . . . . . . . . . . . . . .
49
xx
3.6 State Transition Diagram – Closed Tandem Queueing Network . . . . . . . .
49
3.7 Open Jackson Network, M = 3 . . . . . . . . . . . . . . . . . . . . . . . . .
62
3.8 BCMP Network . . . . . . . . . . . . . . . . . . . . . . . . . . . . . . . . . .
65
3.9 Slotted ALOHA Network . . . . . . . . . . . . . . . . . . . . . . . . . . . . .
76
4.1 Sample Simulation Output . . . . . . . . . . . . . . . . . . . . . . . . . . . .
97
5.1 RT-MAC Transmission Control Algorithm . . . . . . . . . . . . . . . . . . . 102 5.2 RT-MAC ECA Backoff Value Algorithm . . . . . . . . . . . . . . . . . . . . 105 6.1 Telemetry Throughput - Ideal Channel . . . . . . . . . . . . . . . . . . . . . 108 6.2 Telemetry Throughput - Bursty Error Channel . . . . . . . . . . . . . . . . . 109 6.3 Telemetry Throughput Performance Comparison - Ideal Channel . . . . . . . 109 6.4 Telemetry Throughput Performance Comparison - Bursty Error Channel . . 110 6.5 Usable Telemetry Throughput - Ideal Channel . . . . . . . . . . . . . . . . . 111 6.6 Telemetry Mean Delay - Ideal Channel . . . . . . . . . . . . . . . . . . . . . 112 6.7 Telemetry Mean Delay - Bursty Error Channel . . . . . . . . . . . . . . . . . 113 6.8 Telemetry Missed Deadline Ratio - Ideal Channel . . . . . . . . . . . . . . . 114 6.9 Telemetry Missed Deadline Ratio - Bursty Error Channel . . . . . . . . . . . 114 6.10 Telemetry Missed Deadline Ratio (5-50 Stations) - Ideal Channel . . . . . . . 115 6.11 Telemetry Missed Deadline Ratio (2-50 Stations) - Ideal Channel . . . . . . . 116 6.12 Telemetry Collision Ratio - Ideal Channel . . . . . . . . . . . . . . . . . . . 117 6.13 Telemetry Collision Ratio - Bursty Error Channel . . . . . . . . . . . . . . . 117
xxi
6.14 Avionics Throughput - Ideal Channel . . . . . . . . . . . . . . . . . . . . . . 119 6.15 Avionics Throughput - Bursty Error Channel . . . . . . . . . . . . . . . . . 119 6.16 Avionics Throughput Performance Comparison - Ideal Channel . . . . . . . 120 6.17 Avionics Throughput Performance Comparison - Bursty Error Channel . . . 121 6.18 Usable Avionics Throughput - Ideal Channel . . . . . . . . . . . . . . . . . . 121 6.19 Avionics Mean Delay - Ideal Channel . . . . . . . . . . . . . . . . . . . . . . 123 6.20 Avionics Mean Delay - Bursty Error Channel
. . . . . . . . . . . . . . . . . 123
6.21 Avionics Mean Delay Performance Comparison - Ideal Channel . . . . . . . . 124 6.22 Avionics Mean Delay Performance Comparison - Bursty Error Channel . . . 124 6.23 Avionics Missed Deadline Ratio - Ideal Channel . . . . . . . . . . . . . . . . 125 6.24 Avionics Missed Deadline Ratio - Bursty Error Channel . . . . . . . . . . . . 126 6.25 Avionics Missed Deadline Performance Comparison - Ideal Channel . . . . . 127 6.26 Avionics Missed Deadline Performance Comparison - Bursty Error Channel . 127 6.27 Avionics Collision Ratio - Ideal Channel . . . . . . . . . . . . . . . . . . . . 128 6.28 Avionics Collision Ratio - Bursty Error Channel . . . . . . . . . . . . . . . . 129 6.29 Voice Throughput - Ideal Channel (1 Mbps) . . . . . . . . . . . . . . . . . . 130 6.30 Voice Throughput - Bursty Error Channel (1 Mbps) . . . . . . . . . . . . . . 131 6.31 Voice Throughput Performance Comparison - Ideal Channel (1 Mbps) . . . . 132 6.32 Voice Throughput Performance Comparison - Bursty Error Channel (1 Mbps) 132 6.33 Representative Usable Voice Throughput - Ideal Channel (1 Mbps) . . . . . 134 6.34 Voice Mean Delay - Ideal Channel (1 Mbps) . . . . . . . . . . . . . . . . . . 135
xxii
6.35 Voice Mean Delay - Bursty Error Channel (1 Mbps) . . . . . . . . . . . . . . 135 6.36 Voice Mean Delay Performance Comparison - Ideal Channel (1 Mbps) . . . . 136 6.37 Voice Mean Delay Performance Comparison - Bursty Error Channel (1 Mbps) 137 6.38 Voice Missed Deadline Ratio - Ideal Channel (1 Mbps) . . . . . . . . . . . . 138 6.39 Voice Missed Deadline Ratio - Bursty Error Channel (1 Mbps) . . . . . . . . 138 6.40 Voice Missed Deadline Ratio Summary - Ideal Channel (IEEE 802.11, 1 Mbps)140 6.41 Voice Missed Deadline Ratio Summary - Ideal Channel (RT-MAC, 1 Mbps) . 141 6.42 Voice Missed Deadline Ratio Summary - Bursty Error Channel (IEEE 802.11, 1 Mbps) . . . . . . . . . . . . . . . . . . . . . . . . . . . . . . . . . . . . . . 141 6.43 Voice Missed Deadline Ratio Summary - Bursty Error Channel (RT-MAC, 1 Mbps) . . . . . . . . . . . . . . . . . . . . . . . . . . . . . . . . . . . . . . . 142 6.44 Voice Collision Ratio - Ideal Channel (1 Mbps) . . . . . . . . . . . . . . . . . 143 6.45 Voice Collision Ratio - Bursty Error Channel (1 Mbps) . . . . . . . . . . . . 143 6.46 Voice Throughput - Ideal Channel (10 Mbps) . . . . . . . . . . . . . . . . . 144 6.47 Voice Throughput - Bursty Error Channel (10 Mbps) . . . . . . . . . . . . . 145 6.48 Voice Throughput Performance Comparison - Ideal Channel (10 Mbps) . . . 145 6.49 Voice Throughput Performance Comparison - Bursty Error Channel (10 Mbps)146 6.50 Voice Mean Delay - Ideal Channel (10 Mbps) . . . . . . . . . . . . . . . . . . 147 6.51 Voice Mean Delay - Bursty Error Channel (10 Mbps) . . . . . . . . . . . . . 148 6.52 Voice Mean Delay Performance Comparison - Ideal Channel (10 Mbps) . . . 149 6.53 Voice Mean Delay Performance Comparison - Bursty Error Channel (10 Mbps)149 6.54 Voice Missed Deadline Ratio - Ideal Channel (10 Mbps) . . . . . . . . . . . . 150 xxiii
6.55 Voice Missed Deadline Ratio - Bursty Error Channel (10 Mbps) . . . . . . . 150 6.56 Voice Missed Deadline Ratio Summary - Ideal Channel (IEEE 802.11, 10 Mbps)152 6.57 Voice Missed Deadline Ratio Summary - Ideal Channel (RT-MAC, 10 Mbps) 152 6.58 Voice Missed Deadline Ratio Summary - Bursty Error Channel (IEEE 802.11, 10 Mbps) . . . . . . . . . . . . . . . . . . . . . . . . . . . . . . . . . . . . . 153 6.59 Voice Missed Deadline Ratio Summary - Bursty Error Channel (RT-MAC, 10 Mbps) . . . . . . . . . . . . . . . . . . . . . . . . . . . . . . . . . . . . . . . 153 6.60 Voice Collision Ratio - Ideal Channel (10 Mbps) . . . . . . . . . . . . . . . . 156 6.61 Voice Collision Ratio - Bursty Error Channel (10 Mbps) . . . . . . . . . . . 156 6.62 Voice Collision Ratio Performance Comparison - Ideal Channel (10 Mbps)
. 157
6.63 Voice Collision Ratio Performance Comparison - Bursty Error Channel (10 Mbps) . . . . . . . . . . . . . . . . . . . . . . . . . . . . . . . . . . . . . . . 157 6.64 RT-MAC Enhancements Study Mean Results . . . . . . . . . . . . . . . . . 159 6.65 RT-MAC Enhancements Study Throughput Performance Comparison . . . . 160 6.66 RT-MAC Enhancements Study Mean Delay Performance Comparison . . . . 162 6.67 RT-MAC Enhancements Study Missed Deadline Performance Comparison . . 164 6.68 RT-MAC Enhancements Study Collision Performance Comparison . . . . . . 165 6.69 Contention Window Study Results - Collision Ratio . . . . . . . . . . . . . . 167 6.70 Service Disciplines Study Results . . . . . . . . . . . . . . . . . . . . . . . . 169 6.71 Mixed RT-MAC/IEEE 802.11 Network, G = 0.9 . . . . . . . . . . . . . . . . 170 6.72 Mixed RT-MAC/IEEE 802.11 Network, G = 0.3 . . . . . . . . . . . . . . . . 171 6.73 Mixed RT-MAC/IEEE 802.11 Network, Avionics Traffic Model . . . . . . . . 172
xxiv
6.74 Mixed RT-MAC/IEEE 802.11 Network, Avionics Traffic Model, 5 Stations . 173 6.75 Static BERs . . . . . . . . . . . . . . . . . . . . . . . . . . . . . . . . . . . . 174 6.76 Static BER, Packet Error Rate . . . . . . . . . . . . . . . . . . . . . . . . . 175 6.77 Static BER, Throughput . . . . . . . . . . . . . . . . . . . . . . . . . . . . . 176 6.78 Static BER, Mean Delay . . . . . . . . . . . . . . . . . . . . . . . . . . . . . 176 6.79 Static BER, Missed Deadline Ratio . . . . . . . . . . . . . . . . . . . . . . . 177 6.80 Static BER, Collision Ratio . . . . . . . . . . . . . . . . . . . . . . . . . . . 177 7.1 Residuals versus Predicted Response for IEEE 802.11 Telemetry Throughput Model . . . . . . . . . . . . . . . . . . . . . . . . . . . . . . . . . . . . . . . 183 7.2 Normal Quantile-Quantile Plot for Residuals of IEEE 802.11 Telemetry Throughput Data . . . . . . . . . . . . . . . . . . . . . . . . . . . . . . . . . . . . . . 183 7.3 Normalized Throughput – Telemetry Traffic Model (1 of 2) . . . . . . . . . . 187 7.4 Normalized Throughput – Telemetry Traffic Model (2 of 2) . . . . . . . . . . 187 7.5 Mean Delay – Telemetry Traffic Model (1 of 2) . . . . . . . . . . . . . . . . . 188 7.6 Mean Delay – Telemetry Traffic Model (2 of 2) . . . . . . . . . . . . . . . . . 188 7.7 Missed Deadlines – Telemetry Traffic Model . . . . . . . . . . . . . . . . . . 189 7.8 Collisions – Telemetry Traffic Model
. . . . . . . . . . . . . . . . . . . . . . 189
7.9 Normalized Throughput – Avionics Traffic Model . . . . . . . . . . . . . . . 191 7.10 Mean Delay – Avionics Traffic Model (1 of 3) . . . . . . . . . . . . . . . . . 192 7.11 Mean Delay – Avionics Traffic Model (2 of 3) . . . . . . . . . . . . . . . . . 192 7.12 Mean Delay – Avionics Traffic Model (3 of 3) . . . . . . . . . . . . . . . . . 193
xxv
7.13 Missed Deadlines – Avionics Traffic Model (1 of 2) . . . . . . . . . . . . . . . 193 7.14 Missed Deadlines – Avionics Traffic Model (2 of 2) . . . . . . . . . . . . . . . 194 7.15 Collisions – Avionics Traffic Model (1 of 2) . . . . . . . . . . . . . . . . . . . 194 7.16 Collisions – Avionics Traffic Model (2 of 2) . . . . . . . . . . . . . . . . . . . 195 7.17 Normalized Throughput – Voice Traffic Model (1 Mbps) (1 of 2) . . . . . . . 197 7.18 Normalized Throughput – Voice Traffic Model (1 Mbps) (2 of 2) . . . . . . . 197 7.19 Mean Delay – Voice Traffic Model (1 Mbps) (1 of 3) . . . . . . . . . . . . . . 198 7.20 Mean Delay – Voice Traffic Model (1 Mbps) (2 of 3) . . . . . . . . . . . . . . 198 7.21 Mean Delay – Voice Traffic Model (1 Mbps) (3 of 3) . . . . . . . . . . . . . . 199 7.22 Missed Deadlines – Voice Traffic Model (1 Mbps) (1 of 2) . . . . . . . . . . . 199 7.23 Missed Deadlines – Voice Traffic Model (1 Mbps) (2 of 2) . . . . . . . . . . . 200 7.24 Collisions – Voice Traffic Model (1 Mbps) . . . . . . . . . . . . . . . . . . . . 200 7.25 Normalized Throughput – Voice Traffic Model (10 Mbps) (1 of 2) . . . . . . 202 7.26 Normalized Throughput – Voice Traffic Model (10 Mbps) (2 of 2) . . . . . . 202 7.27 Mean Delay – Voice Traffic Model (10 Mbps) (1 of 3) . . . . . . . . . . . . . 203 7.28 Mean Delay – Voice Traffic Model (10 Mbps) (2 of 3) . . . . . . . . . . . . . 203 7.29 Mean Delay – Voice Traffic Model (10 Mbps) (3 of 3) . . . . . . . . . . . . . 204 7.30 Missed Deadlines – Voice Traffic Model (10 Mbps) (1 of 2) . . . . . . . . . . 204 7.31 Missed Deadlines – Voice Traffic Model (10 Mbps) (2 of 2) . . . . . . . . . . 205 7.32 Collisions – Voice Traffic Model (10 Mbps) . . . . . . . . . . . . . . . . . . . 205 7.33 IEEE 802.11 Telemetry Throughput Model and Simulation Data . . . . . . . 209
xxvi
7.34 IEEE 802.11 1 Mbps Voice Collision Ratio Model and Simulation Data . . . 209 A.1 SDL Legend . . . . . . . . . . . . . . . . . . . . . . . . . . . . . . . . . . . . 232 A.2 IEEE 802.11 System Station . . . . . . . . . . . . . . . . . . . . . . . . . . . 233 A.3 Block Transmission . . . . . . . . . . . . . . . . . . . . . . . . . . . . . . . . 233 A.4 Process Legend . . . . . . . . . . . . . . . . . . . . . . . . . . . . . . . . . . 234 A.5 Process Block . . . . . . . . . . . . . . . . . . . . . . . . . . . . . . . . . . . 235 A.6 SDL to OPNET Object Mapping . . . . . . . . . . . . . . . . . . . . . . . . 236 A.7 SDL – System Station . . . . . . . . . . . . . . . . . . . . . . . . . . . . . . 238 A.8 OPNET Node – System Station . . . . . . . . . . . . . . . . . . . . . . . . . 239 A.9 SDL – Block Protocol Control STA . . . . . . . . . . . . . . . . . . . . . . . 239 A.10 SDL – Block Transmission . . . . . . . . . . . . . . . . . . . . . . . . . . . . 240 A.11 SDL – Block Reception . . . . . . . . . . . . . . . . . . . . . . . . . . . . . . 240 A.12 Source Process Model . . . . . . . . . . . . . . . . . . . . . . . . . . . . . . . 242 A.13 Packet Queue Process Model . . . . . . . . . . . . . . . . . . . . . . . . . . . 243 A.14 Backoff Procedure Process Model . . . . . . . . . . . . . . . . . . . . . . . . 246 A.15 Backoff Procedure – SDL Description . . . . . . . . . . . . . . . . . . . . . . 247 A.16 Data Pump Process Model . . . . . . . . . . . . . . . . . . . . . . . . . . . . 249 A.17 Data Pump – SDL Description . . . . . . . . . . . . . . . . . . . . . . . . . 250 A.18 Filter MPDU Process Model . . . . . . . . . . . . . . . . . . . . . . . . . . . 251 A.19 Filter MPDU – SDL Description (1 of 2) . . . . . . . . . . . . . . . . . . . . 252 A.20 Filter MPDU – SDL Description (2 of 2) . . . . . . . . . . . . . . . . . . . . 253
xxvii
A.21 Channel State Process Model . . . . . . . . . . . . . . . . . . . . . . . . . . 254 A.22 Channel State – SDL Description (1 of 2) . . . . . . . . . . . . . . . . . . . . 256 A.23 Channel State – SDL Description (2 of 2) . . . . . . . . . . . . . . . . . . . . 257 A.24 Tx Coordination sta Process Model . . . . . . . . . . . . . . . . . . . . . . . 258 A.25 Tx Coordination sta – SDL Description (1 of 2) . . . . . . . . . . . . . . . . 259 A.26 Tx Coordination sta – SDL Description (2 of 2) . . . . . . . . . . . . . . . . 260 A.27 Rx Coordination Process Model . . . . . . . . . . . . . . . . . . . . . . . . . 261 A.28 Rx Coordination – SDL Description . . . . . . . . . . . . . . . . . . . . . . . 262 A.29 Traffic Monitor Process Model . . . . . . . . . . . . . . . . . . . . . . . . . . 265 A.30 Throughput versus Offered Load . . . . . . . . . . . . . . . . . . . . . . . . . 282 A.31 Mean Attempts per Packet . . . . . . . . . . . . . . . . . . . . . . . . . . . . 283 A.32 Saturation Throughput . . . . . . . . . . . . . . . . . . . . . . . . . . . . . . 283 A.33 Average Access Delay . . . . . . . . . . . . . . . . . . . . . . . . . . . . . . . 284 C.1 Visual Performance Comparison Tests
. . . . . . . . . . . . . . . . . . . . . 307
C.2 IEEE 802.11 Telemetry Throughput Regression GLM Results . . . . . . . . 309 C.3 RT-MAC Telemetry Throughput Regression GLM Results . . . . . . . . . . 309 C.4 IEEE 802.11 Telemetry Mean Delay Regression GLM Results . . . . . . . . 310 C.5 RT-MAC Telemetry Mean Delay Regression GLM Results . . . . . . . . . . 310 C.6 IEEE 802.11 Telemetry Missed Deadline Ratio Regression GLM Results . . . 311 C.7 RT-MAC Telemetry Missed Deadline Ratio Regression GLM Results . . . . 311 C.8 IEEE 802.11 Telemetry Collision Ratio Regression GLM Results . . . . . . . 312
xxviii
C.9 RT-MAC Telemetry Collision Ratio Regression GLM Results . . . . . . . . . 312 C.10 IEEE 802.11 Avionics Throughput Regression GLM Results . . . . . . . . . 313 C.11 RT-MAC Avionics Throughput Regression GLM Results . . . . . . . . . . . 313 C.12 IEEE 802.11 Avionics Mean Delay Regression GLM Results . . . . . . . . . 314 C.13 RT-MAC Avionics Mean Delay Regression GLM Results . . . . . . . . . . . 314 C.14 IEEE 802.11 Avionics Missed Deadline Ratio Regression GLM Results, G ≤ 0.5315 C.15 IEEE 802.11 Avionics Missed Deadline Ratio Regression GLM Results, G > 0.5315 C.16 RT-MAC Avionics Missed Deadline Ratio Regression GLM Results . . . . . 316 C.17 IEEE 802.11 Avionics Collision Ratio Regression GLM Results . . . . . . . . 316 C.18 RT-MAC Avionics Collision Ratio Regression GLM Results . . . . . . . . . . 317 C.19 IEEE 802.11 Voice Throughput (1 Mbps) Regression GLM Results . . . . . . 318 C.20 RT-MAC Voice Throughput (1 Mbps) Regression GLM Results . . . . . . . 318 C.21 IEEE 802.11 Voice Mean Delay (1 Mbps) Regression GLM Results . . . . . . 319 C.22 RT-MAC Voice Mean Delay (1 Mbps) Regression GLM Results . . . . . . . 319 C.23 IEEE 802.11 Voice Missed Deadline Ratio (1 Mbps) Regression GLM Results, G < 0.2 . . . . . . . . . . . . . . . . . . . . . . . . . . . . . . . . . . . . . . 320 C.24 IEEE 802.11 Voice Missed Deadline Ratio (1 Mbps) Regression GLM Results, G ≥ 0.2 . . . . . . . . . . . . . . . . . . . . . . . . . . . . . . . . . . . . . . 320 C.25 RT-MAC Voice Missed Deadline Ratio (1 Mbps) Regression GLM Results, G < 0.2 . . . . . . . . . . . . . . . . . . . . . . . . . . . . . . . . . . . . . . 321 C.26 RT-MAC Voice Missed Deadline Ratio (1 Mbps) Regression GLM Results, G ≥ 0.2 . . . . . . . . . . . . . . . . . . . . . . . . . . . . . . . . . . . . . . 321
xxix
C.27 IEEE 802.11 Voice Collision Ratio (1 Mbps) Regression GLM Results . . . . 322 C.28 RT-MAC Voice Collision Ratio (1 Mbps) Regression GLM Results . . . . . . 322 C.29 IEEE 802.11 Voice Throughput (10 Mbps) Regression GLM Results . . . . . 323 C.30 RT-MAC Voice Throughput (10 Mbps) Regression GLM Results . . . . . . . 323 C.31 IEEE 802.11 Voice Mean Delay (10 Mbps) Regression GLM Results, G < 0.2; G = 0.2, N ≤ 50 . . . . . . . . . . . . . . . . . . . . . . . . . . . . . . . 324 C.32 RT-MAC Voice Mean Delay (10 Mbps) Regression GLM Results, G < 0.2; G = 0.2, N < 40 . . . . . . . . . . . . . . . . . . . . . . . . . . . . . . . . . . . . 324 C.33 IEEE 802.11 Voice Mean Delay (10 Mbps) Regression GLM Results, G = 0.2, N > 50; G ≥ 0.2 . . . . . . . . . . . . . . . . . . . . . . . . . . . . . . . 325 C.34 RT-MAC Voice Mean Delay (10 Mbps) Regression GLM Results, G = 0.2, N ≥ 40; G > 0.2 . . . . . . . . . . . . . . . . . . . . . . . . . . . . . . . . . . . . . 325 C.35 IEEE 802.11 Voice Missed Deadline Ratio (10 Mbps) Regression GLM Results 326 C.36 RT-MAC Voice Missed Deadline Ratio (10 Mbps) Regression GLM Results . 326 C.37 IEEE 802.11 Voice Collision Ratio (10 Mbps) Regression GLM Results . . . 327 C.38 RT-MAC Voice Collision Ratio (10 Mbps) Regression GLM Results . . . . . 327
xxx
List of Tables 2.1 Industrial, Scientific, and Medical (ISM) Frequency Bands . . . . . . . . . .
17
3.1 Convolution Algorithm . . . . . . . . . . . . . . . . . . . . . . . . . . . . . .
57
3.2 Convolution Algorithm for Tandem Network of Figure 3.5 . . . . . . . . . .
58
3.3 BCMP Network Transition Matrix . . . . . . . . . . . . . . . . . . . . . . .
66
3.4 MVA Algorithm . . . . . . . . . . . . . . . . . . . . . . . . . . . . . . . . . .
73
3.5 Analysis Methods for Queueing Networks . . . . . . . . . . . . . . . . . . . .
80
4.1 Simulation Factors - Telemetry, Avionics Traffic Models . . . . . . . . . . . .
91
4.2 Simulation Factors - 1 Mbps Voice Traffic Model . . . . . . . . . . . . . . . .
91
4.3 Simulation Factors - 10 Mbps Voice Traffic Model . . . . . . . . . . . . . . .
91
4.4 Traffic Models . . . . . . . . . . . . . . . . . . . . . . . . . . . . . . . . . . .
96
4.5 Simulation Data . . . . . . . . . . . . . . . . . . . . . . . . . . . . . . . . . .
98
6.1 Maximum Capacity Study Results . . . . . . . . . . . . . . . . . . . . . . . . 179 7.1 Regression Model — Telemetry Traffic . . . . . . . . . . . . . . . . . . . . . 186 7.2 Regression Model — Avionics Traffic . . . . . . . . . . . . . . . . . . . . . . 190
xxxi
7.3 Regression Model — Voice Traffic (1 Mbps) . . . . . . . . . . . . . . . . . . 196 7.4 Regression Model — Voice Traffic (10 Mbps) . . . . . . . . . . . . . . . . . . 201 7.5 Predictive Power of Regression Models – Throughput . . . . . . . . . . . . . 206 7.6 Predictive Power of Regression Models – Mean Delay . . . . . . . . . . . . . 207 7.7 Predictive Power of Regression Models – Missed Deadline Ratio . . . . . . . 207 7.8 Predictive Power of Regression Models – Collision Ratio . . . . . . . . . . . 208 A.1 Simulation Model Packet Format . . . . . . . . . . . . . . . . . . . . . . . . 264 B.1 Telemetry Throughput - Ideal Channel (Figure 6.1) . . . . . . . . . . . . . . 286 B.2 Telemetry Throughput - Bursty Error Channel (Figure 6.2) . . . . . . . . . . 286 B.3 Telemetry Mean Delay - Ideal Channel (Figure 6.6) . . . . . . . . . . . . . . 287 B.4 Telemetry Mean Delay - Bursty Error Channel (Figure 6.7) . . . . . . . . . . 287 B.5 Telemetry Missed Deadline Ratio - Ideal Channel (Figure 6.8) . . . . . . . . 288 B.6 Telemetry Missed Deadline Ratio - Bursty Error Channel (Figure 6.9) . . . . 288 B.7 Telemetry Missed Deadline Ratio (2-4 Stations) - Ideal Channel (Figure 6.11) 288 B.8 Telemetry Collision Ratio - Ideal Channel (Figure 6.12) . . . . . . . . . . . . 289 B.9 Telemetry Collision Ratio - Bursty Error Channel (Figure 6.13) . . . . . . . 289 B.10 Avionics Throughput - Ideal Channel (Figure 6.14) . . . . . . . . . . . . . . 290 B.11 Avionics Throughput - Bursty Error Channel (Figure 6.15) . . . . . . . . . . 290 B.12 Avionics Mean Delay - Ideal Channel (Figure 6.19) . . . . . . . . . . . . . . 291 B.13 Avionics Mean Delay - Bursty Error Channel (Figure 6.20) . . . . . . . . . . 291 B.14 Avionics Missed Deadline Ratio - Ideal Channel (Figure 6.23) . . . . . . . . 292 xxxii
B.15 Avionics Missed Deadline Ratio - Bursty Error Channel (Figure 6.24) . . . . 292 B.16 Avionics Collision Ratio - Ideal Channel (Figure 6.27) . . . . . . . . . . . . . 293 B.17 Avionics Collision Ratio - Bursty Error Channel (Figure 6.28) . . . . . . . . 293 B.18 Voice Throughput - Ideal Channel (1 Mbps) (Figure 6.29) . . . . . . . . . . 294 B.19 Voice Throughput - Bursty Error Channel (1 Mbps) (Figure 6.30) . . . . . . 294 B.20 Voice Mean Delay - Ideal Channel (1 Mbps) (Figure 6.34)
. . . . . . . . . . 295
B.21 Voice Mean Delay - Bursty Error Channel (1 Mbps) (Figure 6.35) . . . . . . 295 B.22 Voice Missed Deadline Ratio - Ideal Channel (1 Mbps) (Figure 6.38) . . . . . 295 B.23 Voice Missed Deadline Ratio - Bursty Error Channel (1 Mbps) (Figure 6.39)
296
B.24 Voice Collision Ratio - Ideal Channel (1 Mbps) (Figure 6.44) . . . . . . . . . 296 B.25 Voice Collision Ratio - Bursty Error Channel (1 Mbps) (Figure 6.45) . . . . 296 B.26 Voice Throughput - Ideal Channel (10 Mbps) (Figure 6.46) . . . . . . . . . . 297 B.27 Voice Throughput - Bursty Error Channel (10 Mbps) (Figure 6.47) . . . . . 297 B.28 Voice Mean Delay - Ideal Channel (10 Mbps) (Figure 6.50) . . . . . . . . . . 298 B.29 Voice Mean Delay - Bursty Error Channel (10 Mbps) (Figure 6.51) . . . . . 298 B.30 Voice Missed Deadline Ratio - Ideal Channel (10 Mbps) (Figure 6.54) . . . . 299 B.31 Voice Missed Deadline Ratio - Bursty Error Channel (10 Mbps) (Figure 6.55) 299 B.32 Voice Collision Ratio - Ideal Channel (10 Mbps) (Figure 6.60) . . . . . . . . 300 B.33 Voice Collision Ratio - Bursty Error Channel (10 Mbps) (Figure 6.61) . . . . 300 B.34 RT-MAC Enhancements Study Results (Figure 6.64) . . . . . . . . . . . . . 301 B.35 Contention Window Study Results - Collision Ratio (1 Mbps) (Figure 6.69) . 301
xxxiii
B.36 Contention Window Study Results - Collision Ratio (10 Mbps) . . . . . . . . 302 B.37 Service Disciplines Study Results (Figure 6.70) . . . . . . . . . . . . . . . . . 302 B.38 Mixed RT-MAC/IEEE 802.11 Network, G = 0.9 (Figure 6.71) . . . . . . . . 302 B.39 Mixed RT-MAC/IEEE 802.11 Network, G = 0.3 (Figure 6.72) . . . . . . . . 303 B.40 Mixed RT-MAC/IEEE 802.11 Network, Avionics Traffic Model (Figure 6.73) 303 B.41 Mixed RT-MAC/IEEE 802.11 Network, Avionics Traffic Model, 5 Stations (Figure 6.74) . . . . . . . . . . . . . . . . . . . . . . . . . . . . . . . . . . . 303 B.42 Static BER, BERs (Figure 6.75) . . . . . . . . . . . . . . . . . . . . . . . . . 304 B.43 Static BER, Packet Error Rate (Figure 6.76) . . . . . . . . . . . . . . . . . . 304 B.44 Static BER, Throughput (Figure 6.77) . . . . . . . . . . . . . . . . . . . . . 304 B.45 Static BER, Mean Delay (Figure 6.78) . . . . . . . . . . . . . . . . . . . . . 304 B.46 Static BER, Missed Deadline Ratio (Figure 6.79) . . . . . . . . . . . . . . . 305 B.47 Static BER, Collision Ratio (Figure 6.80) . . . . . . . . . . . . . . . . . . . . 305 C.1 Abbreviations used in Appendix C . . . . . . . . . . . . . . . . . . . . . . . 308
xxxiv
Chapter 1 Introduction
1.1
Background
One would have to be isolated indeed not to have noticed the proliferation of ways in which technology can be used to communicate in modern society. From the dissemination of information by broadcast radio and television, to the exchange of information via two-way radios, telephones, cellular phones and pagers, to the global internet, communications pervades every part of our lives. Technology has had an enormous impact on the industrial and manufacturing industries as well. Production lines and industrial control systems rely more and more on computers, often several, to control manufacturing processes and robotic assembly systems. These computer systems in turn require a variety of communication networks to coordinate their actions. Coordinated action is also vital to the success of military operations. Not only do military commanders require timely information from all of the units under their control, but modern warfare requires extensive communication between the military services (e.g., the Army, Air Force, Navy, etc.) as well as between units in those services. Moreover, military personnel in the field need to communicate with their weapon systems which are often controlled remotely.
1
Rusty O. Baldwin
Chapter 1. Introduction
2
In the commercial sector, the desire for mobility while communicating has spurred the development of wireless communication. The cellular phone industry alone has seen a growth rate of more than 50% since 1994 [Rap96]. Since the cellular phone industry has effectively provided access to telephone services from almost anywhere, it follows that there has been a parallel demand for “anywhere, anytime” access to local computer networks and to the global internet as well. Wireless computer networks have been and are being developed to meet this demand. For example, in areas without existing wire-based communications infrastructure, wireless computer networks are a means to provide an “instant” infrastructure without the sometimes prohibitive capital cost associated with wired alternatives. Also attractive is the ability of wireless computer networks to simultaneously carry any kind of data, often more efficiently than traditional wired analog systems. Examples of data that can be transmitted include text, computer programs, electronic mail (e-mail), digitized voice, video, and control data. Control and voice data are examples of data that have not typically been transported over general-purpose wired (not to mention wireless) packet switched computer networks. When control data (such as that which sends commands to an automated vehicle guidance system) is transmitted, the vehicle must receive and perform the requested action within a certain amount of time—that is, the data has a hard delivery deadline associated with it. A system that has this type of data to deliver is known as a hard real-time system. If a deadline is missed in a hard real-time system, a catastrophic failure may occur. This requirement for a time-constrained response is especially pronounced in a vehicle that is traveling at high speeds like an automobile or airplane. General-purpose networks do not provide this type of hard deadline guarantee; more often they provide a best effort service which does not guarantee delivery. Voice data, on the other hand, is more tolerant of variations in delivery time; but it too has a point after which the data is no longer useful. Systems which can tolerate some delay beyond a scheduled delivery time are known as soft real-time systems. Digital voice, video, and interactive multi-media systems are examples of this type of realtime system.
Rusty O. Baldwin
Chapter 1. Introduction
3
Most real-time systems (hard or soft) are specialized; designed and built to satisfy a unique requirement. As such, these systems are typically expensive and not easily transferred to other application areas. Given the increasing demand for real-time systems, especially in the areas of voice and video data, and coupled with the desire for mobility, a low-cost solution to real-time communications is highly desirable. IEEE 802.11 is a recent (1997) standard developed for wireless local area networks (LANs). It has capabilities which can be exploited to provide real-time service. A standards-based solution offers the potential for a low-cost (if not high performance) implementation of an effective real-time system. The motivation for this type of solution is obvious. When first introduced, a typical ethernet network interface card (IEEE 802.3) could cost $1500 or more. Today they can be purchased for less than $40. If, by using industry standards, this same dramatic drop in price can be realized in wireless network interface cards, then sending real-time data via wireless networks may become as commonplace as sending e-mail is on the internet today. Another challenge real-time systems face is the difficulty of analyzing such systems; especially the analysis of a system’s ability to meet deadlines. Assumptions made in order to make the analysis tractable can impose such restrictions on the system model (e.g., Poisson arrivals or constant periodic arrivals) that the model no longer even approximately represents the system that will ultimately be built, thus greatly limiting the usefulness of the analysis. On the other hand, an accurate model that cannot be solved is useless. Thus, there is a tension between analysis that provides a useful approximation and one that accurately models system behavior.
1.2
Research Goals
The goals of this research are two-fold. The first is to extend the body of knowledge with respect to real-time wireless LANs. To that end, this research will develop a real-time wireless LAN protocol that delivers hard real-time data, under a range of operating conditions, using
Rusty O. Baldwin
Chapter 1. Introduction
4
the IEEE 802.11 wireless LAN standard as a point of departure. The IEEE 802.11 contention period (CP) will be used to deliver hard real-time data. This implies medium access will be via a probabilistic distributed algorithm. The primary objective of the protocol will be to ensure (insofar as possible) the delivery of the real-time data prior to deadline expiration. The protocol will accomplish this objective by not transmitting packets that have exceeded their deadline and by transmitting addition information along with a data packet that permits stations in the network to dramatically reduce packet collisions. In addition, a simulation model of the network will be developed to validate the protocol. The second goal of this research is to develop regression models of the real-time wireless LAN which will accurately predict the deadline performance of stations participating in the network. The techniques used to develop the regression model can, of course, be applied to any network protocol. IEEE 802.11 was chosen because it is a new protocol that has been implemented on real systems and shows promise as becoming a viable standard for wireless LANs. As alluded to above, a model for real-time systems is especially useful so performance can be predicted, and therefore inadequate solutions eliminated, prior to simulation or implementation. While this is desirable in any system, it is especially desirable (but seldom realized) in real-time systems since the theory for real-time systems has not developed to the same degree as other types of systems. In this research, simulation data will be statistically analyzed and used to construct regression models to predict system performance based on the stochastic behavior of packet arrivals, service requirements, deadlines, and wireless channel effects. To date, investigations of hard real-time data over a wireless link have been limited. Especially difficult to find is any research that incorporates a dynamically varying bit error rate (BER). Further, no research was found that developed regression models to predict real-time performance of such a system. This research shows that the regression model developed will predict deadline performance of the wireless LAN using probabilistic descriptions of packet arrival, service requirements,
Rusty O. Baldwin
Chapter 1. Introduction
5
and wireless medium characteristics. Additionally, it shows that while IEEE 802.11 may not achieve the throughput efficiency of a protocol specifically designed to handle real-time traffic, it does provide a reliable, effective, low-cost method of delivering hard real-time data across a wireless medium. Simulation of the protocol is discussed as well as results of that simulation. The manner in which various system parameters affect performance is discussed and used to optimize the system.
1.3
Document Overview
This chapter is a brief introduction to real-time wireless LANs. Motivation for the use of industry standards in the design of real-time wireless LANs is presented as well as some of the limitations of analysis techniques when applied to real-time systems. Chapter 2 presents an overview of wireless LANs. The Open Systems Interconnection (OSI) seven layer network model is briefly presented and the position of IEEE 802.11 within the OSI model is highlighted. Wireless Medium Access Control (MAC) protocols are discussed, especially ALOHA, Carrier Sense Multiple Access (CSMA) techniques, and IEEE 802.11 itself. Several source traffic models and channel error models are reviewed. Finally, relevant research in real-time wireless networks is presented. Chapter 3 contains a survey of analytic methods used to analyze networks. Concepts and terminology used by these methods is defined. Their suitability for analyzing real-time systems is discussed. Chapter 4 presents the methodology being employed to meet the research objectives. Goals and assumptions and how they affect performance are discussed. Chapter 5 describes the protocol developed (called RT-MAC) in detail. The transmission control and collision avoidance modifications are presented. Chapter 6 contains the simulation results. Charts comparing IEEE 802.11 and RT-MAC for
Rusty O. Baldwin
Chapter 1. Introduction
6
each performance metric is presented and the results are discussed. Regression models are presented in Chapter 7. Using the simulation data, regression models are developed. The quality of the models and their predictive power is discussed. Chapter 8 presents the research conclusions and recommendations for further research. Appendix A contains a detailed description of the IEEE 802.11 simulation model. It includes discussion of the architecture, state diagrams, and detailed behavior. Also discussed are the simulation parameters and factors. The appendix concludes with a presentation of the model validation. Appendix B contains the simulation data in tabular form, including confidence intervals. Appendix C contains the SAS [SAS] output obtained during the development of the regression models.
Chapter 2 Background and Literature Survey Real-time wireless local area networks (LANs), as a subset of wireless LANs, have unique challenges associated with their implementation. This chapter examines some of these issues. Section 2.1 presents an overview of the Open Systems Interconnection (OSI) model, its purpose, and in what areas within the model this research focuses. Noteworthy wireless medium access control (MAC) protocols are presented in Section 2.2 including ALOHA (Section 2.2.1) and carrier sense multiple access (CSMA) (Section 2.2.2). Their similarities and differences are discussed and compared; throughput performance of each scheme is addressed. Section 2.2.3 is dedicated to IEEE 802.11. The operation of the protocol is explained and its performance is highlighted. Section 2.2.4 covers previous proposed or actual real-time MAC protocols. Section 2.3 surveys some traffic and channel models commonly used in simulations. An overview of related research efforts is given in Section 2.4.
2.1
OSI Network Model
The OSI network model serves as a frame of reference for discussing various network architectures. The model separates the functions (or services) that are performed in a computer
7
Rusty O. Baldwin
Chapter 2. Background and Literature Survey
Station A
Station B
Application
�
Application
Session
�
-
Virtual Network Service
Presentation
�
Presentation Virtual Session Virtual Link for End-to-End Messages
Transport
�
MAC Sublayer
H H H � � �
� Data Link Control
�
Session
Transport
Virtual Link for End-to-End Packets
Network Logical Link Control Sublayer
8
Network
Virtual Link for Reliable Packets
Virtual Bit Pipe
Physical
Data Link Control
-
� H
� � H H
Logical Link Control Sublayer MAC Sublayer
Physical Physical Link
Figure 2.1: OSI Network Model network into a layered hierarchy. Each station (or computer) in the network can be thought of as having each of the layers in the OSI network model implemented in a separate black box. Each box provides all of the services performed by that layer. A given layer will only communicate with the same layer on a different station or, within the station where the layer resides, the layer immediately above it and below it. Each layer provides services to the layer above it and receives services from layer below it. In Figure 2.1 (adapted from [BG92]) a graphic presentation of that concept is presented. This figure depicts two stations in a LAN. Note how each of the seven layers only communicates with the layer above, below, or the same layer on a different station by a virtual link. The physical link (shown at the bottom of the Figure 2.1) is what is actually used to transfer information between stations. Once specified, it is the one item in the network model which
Rusty O. Baldwin
Chapter 2. Background and Literature Survey
9
cannot be directly manipulated; it is simply used. If the physical link is highly reliable, as in fiber-optics and wires, it may be assumed to be error-free. If, however, the link is a radio, it is likely that there will be errors introduced into the information transferred between the stations. It is the job of each of the layers in the model to correct or mask these errors so that the next higher layer receives “error-free” service.
2.1.1
The Physical Layer
The physical layer deals directly with the actual medium, the physical link, connecting the stations. On the transmitting station, the primary service the physical layer provides is to accept bits from the data link control layer (DLC) and to transform those bits into the appropriate signals that will transfer the information through the physical link. On the receiving station, the physical layer converts those signals back into bits and presents them to the DLC on the receiving station. This service is sometimes referred to as a virtual bit pipe.
2.1.2
Data Link Control Layer
The data link control layer transforms the unreliable virtual bit pipe provided by the physical layer into an error-free reliable link between stations (i.e., a virtual link for reliable packets). On a transmitting station, this layer may break a long sequence of bits to be transmitted into smaller pieces or fragments. To these smaller pieces it may append other bits to be used on the receiving station for error correction or detection. Upon reception, the receiving station uses these extra bits to correct any errors or, if required, it may request retransmission. The station may simply discard the corrupt data depending on the protocol being used. Once the DLC layer has error-free bits (however obtained) it will then, if required, reassemble the fragments of bits into a format suitable for the next higher layer. If the medium used to connect the stations is not a point-to-point link (that is, the medium
Rusty O. Baldwin
Chapter 2. Background and Literature Survey
10
is being shared by multiple stations), then a sublayer within the DLC known as the Medium Access Control (MAC) sublayer coordinates access to the medium between all the stations. The IEEE 802.11 standard, for example, defines this sublayer for wireless LANs.
2.1.3
The Network Layer
Routing and flow control are the primary services the network layer provides. This layer is responsible for routing data from one station to another in the network. In a network where all stations can hear the transmissions of all other stations (such as a LAN), this function is trivial. In a wide area network (WAN), this layer determines the intermediate stations that the data must traverse in order to arrive at its ultimate destination. Flow control is used in a WAN to avoid network congestion. In a LAN, this function is handled in the DLC layer.
2.1.4
The Transport Layer
The transport layer is responsible for providing reliable end-to-end transport of data between processes. In contrast to lower layers which handle communication between individual stations in the network, this layer handles communication between processes on those stations. This layer performs several functions which may or may not be needed depending on a given network. It may break up large amounts of data into packets suitable for lower layers or reassemble and reorder packets destined for higher layers. It may also, for efficiency, multiplex data from several processes destined for the same station into one packet. This, of course, will need to be de-multiplexed by the transport layer on the receiving station.
2.1.5
The Session Layer
The session layer acts as a network service broker of sorts. It locates network services and then establishes, maintains, and terminates connections between processes. Prior to
Rusty O. Baldwin
Chapter 2. Background and Literature Survey
11
establishing a connection it may check the access rights of a process to use a particular network service.
2.1.6
The Presentation Layer
The major services of this layer are encryption/decryption, compression/de-compression, and code conversion. Encryption and compression are self-explanatory. Code conversion may need to be done when transferring data between machines with incompatible representations of data. For instance, text characters are represented, primarily, by two codes; Extended Binary Code - Decimal Interchange Code (EBCDIC) and American Standard Code for Information Interchange (ASCII). These might have to be converted from one to another between stations using different codes.
2.1.7
The Application Layer
All applications access network services at the application layer. The protocols used at this layer are necessarily user dependent. Whereas network layers below this layer handle services common to all applications requiring network access, this layer handles tasks specific to a given application. The OSI network model is, undoubtedly, a convenient frame of reference for network models; however, it is seldom (if ever) strictly followed in an actual implementation. Therefore, in order to ensure compatibility between stations at the physical and the data link layers, the IEEE defined the 802 family of standards of which the IEEE 802.11 (the wireless LAN standard) is a part. IEEE 802.11 is presented in Section 2.4.1.
Rusty O. Baldwin
2.2
Chapter 2. Background and Literature Survey
12
Wireless Medium Access Control (MAC) Protocols
From the earliest wireless LANs such as ALOHA [Abr70], research into wireless LANs has continued uninterrupted. Early research identified fundamental principles and analysis techniques [KT75], [Kle75], [Kle76], [Abr77], [Kle78], [FST76], [TK78], [KS80] which are still applicable, as well as fundamental problems that are still encountered [TK75], [TK77]. As briefly discussed above, MAC protocols are part of the DLC layer in the OSI model. A MAC protocol is used whenever multiple stations require access to the same medium to transfer data. The number of MAC protocols that have been developed is vast. In this section, the focus will be on several fundamental MAC protocols used in wireless networks.
2.2.1
ALOHA
It is appropriate to begin this presentation by considering one of the first wireless multiple access protocols—ALOHA. ALOHA is a contention-based protocol; that is, stations must compete with each other for access to the medium. ALOHA uses a truly random access approach to medium access; stations transmit as soon as they have data. Since transmission is immediate, ALOHA is also asynchronous. When two stations access the medium at the same time, the resulting collision is resolved by retransmission of both messages after random delays. The throughput equation of pure ALOHA, S = Ge−2G , is well known [Abr77]. S is the normalized throughput in packets and G is the normalized channel traffic in packets. The equation reaches its maximum at G = 0.5 where S = 0.184. While a utilization of 0.184 is poor, the advantage pure ALOHA has over other protocols is its utter simplicity. There are but two rules: (1) transmit when data is ready, and (2) retransmit if the packet is not acknowledged. An improvement on pure ALOHA, in terms of utilization, is slotted ALOHA. In slotted
Rusty O. Baldwin
Chapter 2. Background and Literature Survey
13
ALOHA, transmissions can only occur at the beginning of fixed time slots. Slotted ALOHA’s throughput equation is S = Ge−G and has its maximum of S = 0.368 at G = 1 [Abr77]. While slotted ALOHA is not as simple as pure ALOHA, the added complexity of fixed slots is minimal and the performance gain is substantial. Another variation on the ALOHA protocol is Reservation-ALOHA (R-ALOHA). The primary difference in R-ALOHA is that it is not a contention-based protocol. The performance of R-ALOHA is given in [CN95]. Using the reservation strategy, requests are sent on the same channel as the data during idle periods (and are themselves subject to collisions). A successful reservation request results in the reservation of the channel for a normalized period of v −1 where v is the ratio of reservation request duration to packet length duration. For the case of v = 0.05 and G = 20, a maximum throughput of S = 0.88 was determined by analysis and simulation in [CN95]. R-ALOHA clearly outperforms the other protocols but, again, at the cost of added complexity. Another interesting result is described in [CN95]; the performance of R-ALOHA is identical to the performance of slotted non-persistent carrier sense multiple access/collision detection (CSMA/CD) when the reservation time and propagation delay are equal. As a final example of ALOHA-based protocols, Generalized Multi-copy ALOHA is considered [Leu95]. In multi-copy schemes, multiple packets are transmitted in hopes of avoiding collisions in one of the packets. An individual attempt in a multi-copy scheme is called a trial. Obviously, the time between trials is randomized, otherwise collisions would occur again and again. In generalized multi-copy, capture is also employed. Capture is a technique whereby the receiving station may recover one signal from many that were transmitted given sufficient signal strength and additional signal processing. When a station transmits a packet, it transmits with power J(J > 1) watts with probability B. Maximum throughput is determined as a function of K trials, the probability of transmitting at high power B, and normalized channel traffic A. The performance of generalized multi-copy ALOHA has a constant maximum throughput of S = 0.5 for a normalized arrival rate of λ > 2. In order to relate λ to the offered load, G, recall that G = λT where T is the packet length. Using the
Rusty O. Baldwin
Chapter 2. Background and Literature Survey
14
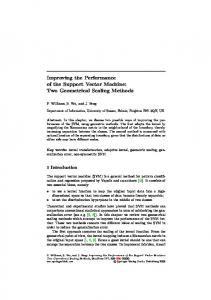
1 R-ALOHA
Normalized Throughput (S)
0.8
0.6 Multi-Copy ALOHA
0.4 Slotted ALOHA 0.2 Pure ALOHA
0 0
2
4 6 Normalized Offered Load (G), (λ > 2)
8
10
Figure 2.2: Performance of ALOHA Protocols assumption that G > 2T , the performance of the different variations of ALOHA (Figure 2.2) can be compared. Generalized multi-copy ALOHA appears to be a very effective alternative for normalized packet lengths T < 0.5 when compared to R-ALOHA; it outperforms slotted ALOHA and pure ALOHA in all cases (assuming a minimum normalized arrival rate λ > 2).
2.2.2
Carrier Sense Multiple Access (CSMA)
Arguably the definitive performance analysis of CSMA techniques is [KT75]. Extensive descriptions and analysis of variants on the basic CSMA technique such as non-persistent CSMA, 1-persistent CSMA, p-persistent CSMA, and slotted CSMA and the like are presented. The interested reader is encouraged refer to it for a detailed treatment of CSMA. In that work the authors define CSMA as a technique used in multiple access systems where stations, prior to transmitting, first listen to the medium to determine whether or not it is
Rusty O. Baldwin
Chapter 2. Background and Literature Survey
15
idle. If it is not idle, transmission is deferred. Recall that in the ALOHA MAC protocols, idle medium detection was not performed. Several variants of CSMA have been devised. In non-persistent CSMA, if the medium is determined to be busy, the packet is rescheduled for later transmission. In p-persistent CSMA, if the medium is busy, a packet will be transmitted (upon the medium becoming idle) with probability p. Finally, in 1-persistent CSMA, a packet will be transmitted with certainty upon the medium becoming idle. Propagation and detection delay are important factors affecting the performance of CSMA. Consider the following equation [BG92],
β=
τC L
(2.1)
where β is equal to the total delay (propagation and detection) in packets, τ is the total delay in seconds, C is the raw channel bit rate, and L is the number of bits in a packet. It is obvious that as β increases, then the performance of CSMA decreases because stations must wait longer prior to accessing the medium. The raw channel bit rate, C, and the number of bits per packet, L, then, are key parameters in CSMA performance. The throughput equation for non-persistent CSMA is
S=
Ge−βG G(1 + 2β) + e−βG
(2.2)
where S is the normalized throughput in packets, G is the normalized channel traffic in packets, and β is the delay [KT75]. Figure 2.3 shows CSMA throughput for various values of β. As indicated above, smaller values of β can achieve a higher maximum throughput.
Rusty O. Baldwin
Chapter 2. Background and Literature Survey
1
16
β = 0.0 β = 0.001
Normalized Throughput (S)
0.8 β = 0.01 0.6
β = 0.05
β = 0.3 β = 0.4
β = 0.1
0.4 β = 0.6
β = 0.2
β = 0.8 0.2 β = 1.0 0 0.01
0.1
1 Offered Load (G)
10
100
Figure 2.3: Throughput in Non-Persistent CSMA
2.2.3
IEEE 802.11
IEEE 802.11 [Edi97], the last wireless MAC to be considered, uses non-persistent CSMA for medium access. Three different physical layer specifications are currently defined: frequency hopping spread spectrum (FHSS), direct sequence spread spectrum (DSSS), and infrared (IR). Both FHSS and DSSS use the 2.4 GHz Industrial, Scientific, and Medical (ISM) band. For reference, the ISM frequency bands are shown in Table 2.1 [Dix94]. The IR specification uses near-visible light in the 850 nm to 950 nm range. Two mandatory data rates are currently supported: 1 Mbps and 2 Mbps. Data rates upto 30 Mbit/s have been proposed [Bra98], but all stations must use the 1 Mbps rate for sending and receiving control frames to ensure compatibility among stations transmitting at different data rates. At the MAC sublayer, IEEE 802.11 supports both contention-free access to the medium, the Point Coordination Function (PCF) which is under the control of a single point coordinator (PC); and contention-based access to the medium, the Distributed Coordination Function (DCF). As can be seen in Figure 2.4 [Edi97], the PCF ultimately uses the contention-based
Rusty O. Baldwin
Chapter 2. Background and Literature Survey
17
Table 2.1: Industrial, Scientific, and Medical (ISM) Frequency Bands ISM Frequency Band (MHz) Available Bandwidth (MHz) 902–928
26.0
2400–2483
83.5
5725–5870
125.0
DCF to provide access to the physical layer. It is the responsibility of the PC to ensure only one of the stations using the PCF transmits at a time. IEEE 802.11 also has provisions for a station to operate in a power-save mode, only “wakingup” at specified intervals to determine if there is traffic bound for it. Stations that need to transmit frames to a station that is in power-save mode queue the frames till the destination station can receive them. Further details about this operating mode can be found in [Edi97].
2.2.3.1
The Distributed Coordination Function
IEEE 802.11 prioritizes access to the medium by specifying a time interval between frames known as the inter-frame space (IFS). By definition, during an IFS the medium is idle. The different types of IFSs, along with the backoff mechanism described below, are the core mechanism a station uses to determine whether it may transmit. This core mechanism is known as the basic access method. There are four types of IFS: Short IFS (SIFS), PCF IFS (PIFS), DCF IFS (DIFS), and Extended IFS (EIFS). EIFS, which is the longest IFS in terms of time, is used when bit errors introduced by the physical medium cannot be corrected by the radio receiver; it will not be discussed further. Transmission after SIFS, the shortest IFS, is reserved for the PC to send any type of frame required or for other stations to begin transmission of an acknowledgment (ACK) frame, a clear to send (CTS) frame, to respond to polling by
Rusty O. Baldwin
Chapter 2. Background and Literature Survey
Required for Contention Free Services A
A
A A
A A
Point Coordination Function (PCF) � �
�
�
�
� �
�
18
Used for Contention and basis for PCF
� Services
Distributed Coordination Function (DCF)
Figure 2.4: MAC Architecture the PC, or to send a fragmented MAC protocol data unit (MPDU). Similarly, access after PIFS is reserved for stations to begin transmission of PCF traffic. This type of traffic will be discussed in greater detail in the next section. After DIFS, in general, if a station determines that the medium is idle, it may transmit a pending frame. If the medium is not idle after DIFS, a backoff timer is set by selecting a random integer (i.e., a backoff value (BV)) from a uniform distribution over the interval [0, CW-1], where CW is the width (in slots) of the contention window range. This BV is the number of idle slots the station must wait until it is allowed to transmit. For every idle slot detected (after a DIFS), the timer is decremented by one. If the medium becomes busy prior to the timer expiring, the timer is frozen until the next DIFS, upon which the timer decrements again. Upon expiring, the station transmits its frame. If there is a collision, CW is doubled until it reaches a predefined maximum value, CWmax. Upon a successful transmission, CW is reset to the default minimum value of CWmin. Figure 2.5 [Edi97] shows the structure of the basic access method.
Rusty O. Baldwin
Chapter 2. Background and Literature Survey
19
Immediate access when medium is free ≥ DIFS
� DIFS �PIFSDIFS � -
�
SIFS � -
Contention Window
-
Busy Medium
�
Defer Access
Next Frame
-
Slot Time � Select slot and decrement backoff �
as long as medium is idle
Figure 2.5: IEEE 802.11 Basic Access Method 2.2.3.2
Point Coordination Function
The PCF within the PC controls transfers during a Contention Free Period (CFP). Within IEEE 802.11, CFPs alternate with Contention Periods (CPs) (when the DCF controls transfers) as shown in Figure 2.6 [Edi97]. The PC determines the rate at which CFPs are generated. At the beginning of a CFP, the PC transmits a beacon frame. That beacon signals the beginning of the CFP and includes timestamp, beacon interval, and maximum duration information (CFPMaxDuration) for this CFP. All stations set their Network Allocation Vector (NAV) with the CFPMaxDuration. During the duration specified by CFPMaxDuration, stations may only transmit in response to a poll by the PC, or transmit ACKs in response to frames sent to them. This continues for CFPMaxDuration or until the PC explicitly declares the CFP terminated, whichever occurs first. As can be seen in Figure 2.6, the beacon interval is a nominal value, that is, it may be delayed due to a busy medium. In those cases, the CFP is shortened by the amount of the delay. During the CFP, the PC may send unicast or multi-cast frames and/or poll stations that have indicated that they would like the opportunity to transmit during the CFP.
Rusty O. Baldwin
Chapter 2. Background and Literature Survey
20
Delay(due to busy medium)
�
CFP Repetition Interval (SuperFrame)
-
�
-
� CFP -
Shortened
Contention Free Period B E A C O N
PCF
CFP Contention Period — DCF
B E Busy A Medium C O N
PCF
Contention Period — DCF
Variable length (per SuperFrame)
NAV
NAV
Figure 2.6: CFP/CP Alternation 2.2.3.3
IEEE 802.11 Performance
The performance of IEEE 802.11 compares favorably with the best performance of ALOHA and its variants, as well as non-persistent CSMA (see Figure 2.7). Assuming a virtually perfect channel (BER = 10−10 ), as was done for the other protocols, IEEE 802.11 achieves a constant throughput of about S = 0.88 for 0.88 < G < 3.6 [CWKS96]. R-ALOHA requires G > 10.0 before it reaches that level of throughput. Assuming IEEE 802.11 has similar performance as reported in [CWKS96] for G ≥ 3.6, the performance of IEEE 802.11 is clearly comparable with R-ALOHA and non-persistent CSMA, especially in relatively lightly-loaded networks.
2.2.4
Real-time Medium Access Control (MAC) Protocols
Much, if not most, of past and current research has been focused on making LANs more efficient and faster. More recently, a measure of attention has turned to the area of real-time wireless LANs where individual packet delivery times are the foremost concern. Examples of
Rusty O. Baldwin
Chapter 2. Background and Literature Survey
21
1 IEEE 802.11
R-ALOHA
Normalized Throughput (S)
0.8 Non-persistant CSMA (β = 0.01)
0.6 Multi-Copy ALOHA
0.4 Slotted ALOHA 0.2 Pure ALOHA
0 0
2
4 6 Normalized Offered Load (G), (λ > 2)
8
10
Figure 2.7: Performance of IEEE 802.11 versus ALOHA and CSMA real-time applications are packetized voice and video, multi-media, and automated control systems. Excellent surveys of work in real-time LANs can be found in [KSY84] and [MZ95]. According to the taxonomy in Figure 2.8 [KSY84], there are two ways in which a MAC can gain access to the medium; through contention or through some method of controlled access. Controlled access is either predetermined or it adapts to the demand for the medium.
2.2.4.1
Contention-based MAC Protocols
Some contention-based probabilistic protocols have already been discussed (ALOHA, DCF in IEEE 802.11). In real-time systems however, the transmission of packets is rarely purely probabilistic. Usually, some criteria are used to prioritize access to the medium. Virtual time CSMA [WZ87] is an example of a contention-based time protocol. In virtual time CSMA, messages have explicit deadlines. Each station maintains two clocks: a real clock and a virtual clock, which runs at a higher rate than the real clock. When a station determines that the medium is idle (after a transmission or collision), it resets its virtual clock to the real clock
Rusty O. Baldwin
Chapter 2. Background and Literature Survey
22
Multiple Access Protocols @
Contention-based @
Probabilistic
Time
@ @ @
Controlled Access @
@ @ @
Address Demand Adaptive @
Reservation
@ @
@ @
@ @
Predetermined Channel Allocation
@ @ @
Token
Pure TDMA
Figure 2.8: Taxonomy for multiple-access protocols time. The station will transmit its message when its virtual clock equals some parameter in the message to be transmitted. Parameters of the message can include arrival time (i.e., first-come-first-served (FCFS)), transmission time (shortest-job-first (SJF)), deadline (earliest-deadline-first (EDF)), or others. Figure 2.9 is an example of a message transmission using the virtual time protocol with the message deadline as the parameter to which the virtual clock is compared. Note that at real-time clock times 3, 8, 10, and 13, the virtual clock is set back to the real-time clock time in response to an idle period after a transmission. If a collision does occur, the parameter is set to a random number between the current real time and the message deadline. A contention-based address protocol based on a binary tree of station addresses was proposed by [Hay78]. In this protocol, station addresses form a binary tree. If a collision occurs, the tree is halved and only stations in the “enabled” half are allowed to transmit. Upon further collisions, the tree continues to be halved until either (a) there is a successful transmission, or (b) the medium is idle. In the case of an idle medium, the other half of the tree is enabled
Rusty O. Baldwin
Chapter 2. Background and Literature Survey
23
Real-Time Clock Idle medium Busy medium
?
? 1
2
Message Transmitted
v 3
v 4
5
6
7
v
8
9
10
11
12
v 13
... 14
6 Message arrival with deadline 14
Virtual Time Clock (rate is twice real-time clock)
v
v
Message transmitted (virtual clock = deadline)
v
v
...
1 2 3 4 3 4 5 6 7 8 9 10 11 12 8 9 10 11 10 11 12 13 14 15 13 14 15
v
= Virtual clock reset
Figure 2.9: Virtual Time Protocol Example Timeline and the process continues until a successful transmission. It is obvious that this method results in bounded access to the medium as a function of the number of stations.
2.2.4.2
Controlled Access MAC Protocols
In the context of real-time communications, predetermined access to the medium guarantees a fixed time delay for each message. Since access is deterministic; message arrivals can be easily predicted (barring corruption of the message in the medium). The problem with predetermined access is that it is horribly inefficient. If a station does not have anything to transmit, the time is wasted. In addition, once the channel allocation is made, any stations not included in that allocation are denied access. That is, a station either has 100% opportunity for access or 0%. This type of access is best suited for stations that have synchronous, streamlike data transmission and probably will not coexist well with stations with bursty transmissions [KSY84]. As a result of this, demand adaptive MACs have received
Rusty O. Baldwin
Chapter 2. Background and Literature Survey
24
more attention both in literature and in practice. Reservation-based demand adaptive protocols include any that allocate access prior to transmission. One example, already discussed in Section 2.2.1, is R-ALOHA. Another is the Distributed-Queueing Request Update Multiple Access (DQRUMA) [KLE95]. R-ALOHA uses the same channel to transmit reservation requests and data. DQRUMA uses a separate channel for reservation requests which reduces collisions. In addition, DQRUMA permits the piggy-backing of reservation requests onto data packets further reducing collisions. Token based protocols require a station to be in possession of a real or imaginary token in order to transmit. Any polling scheme is an example of real tokens. The polling of the station is the token. IEEE 802.4, a token bus standard, has formally defined one approach to real token passing among stations. Imaginary or implicit tokens are passed in the Broadcast Recognition Access Method (BRAM) [CFL79]. In BRAM, the token is “passed” among stations in order of their address. If station 1 is in possession of the token and wants to transmit, it does; otherwise it remains idle. After station 1 transmits, or after a given amount of idle time, station 2 is implicitly “passed” the token, and so on. Often real-time applications employ a timed token protocol where stations are only allowed to hold the token for a bounded amount of time. This ensures that other stations wanting to transmit have a finite delay.
2.3 2.3.1
Traffic and Channel Models Traffic Models
Traffic modeling is a subject that has always generated considerable interest. Within the context of modeling and analysis of communications networks, the reason for this interest is clear. The performance of the network is highly dependent on the traffic presented to it. A network that performs well with traffic that arrives according to a Poisson process may
Rusty O. Baldwin
Chapter 2. Background and Literature Survey
25
perform poorly with traffic that is bursty. A network that efficiently transports bulk data may be very inefficient with multi-media data. The difficulty in accurately characterizing the traffic that will be presented to the network can be attributed to at least two factors [FM94]. First, the demand on the network resources may be poorly understood. Second, the type of data on the network is constantly changing. Voice, video, and HTTP (Hyper Text Transport Protocol) traffic that accounted for only a modest level of the network traffic several years ago, now dominates all other traffic types. Accurate performance modeling of a network, then, presupposes a knowledge of the application domain (e.g., telemetry, avionics, multi-media) that generated the network traffic. In this section, several traffic source models are discussed and the data characteristics of the telemetry and avionics application domains are reviewed. The most commonly used stochastic model for packet arrivals is the Poisson model [JR86], [FM94], [PF95]. A Poisson process can be characterized in two ways. It is a process in which interarrival times {An } are exponentially distributed with parameter λ : P {An ≤ −λt
t} = 1 − e−λt, or it is a counting process that satisfies P {N(t) = n} = (λt)n e n! where N(t) is the number of arrivals up to time t [FM94]. One of the reasons that the Poisson process has seen widespread use is that the memoryless property of exponential distribution makes analysis relatively simple since prior events do not affect the current probability of an event occurring. Additionally, since the combination of two or more Poisson processes results in another Poisson process, the analysis of multiple traffic sources is straight-forward. These compound Poisson processes have been used to model batch arrivals where the interbatch arrival time are independent and exponentially distributed [JR86]. It has long been recognized that packet arrivals in networks are not necessarily Poisson [JR86]. Recent studies have shown that wide-area network traffic is self-similar [LTWW94], [PF95]. Self-similar traffic can be visually characterized by its scale-invariance. If packet arrivals per unit time is plotted in units of 10 seconds and compared to the same plot using units of 1 second, the burstiness of the interarrivals would look the same. Using a smaller time unit of 100 ms or 1 ms would result in plots that look the same as the larger time
Rusty O. Baldwin
Chapter 2. Background and Literature Survey
26
unit plot. In contrast, using smaller and smaller time units on plots of traffic that arrives according to a Poisson process would result in plots that at a larger time scale look relatively smooth and become more and more bursty as the time scale gets smaller (cf., [LTWW94]). In citeWTSW97, it is proposed that the physical explanation for self-similar traffic is due to the superposition of many ON/OFF sources whose ON/OFF distributions have infinite variances. Several models that generate self-similar traffic have been proposed. A model based on doubly stochastic Poisson processes where the intensity of arrivals is modeled as a continuous stochastic process was proposed by [SL95]. The Random Midpoint Displacement (RMD) algorithm [LEWW95] focuses on fast generation of self-similar traffic by recursively generating midpoint values (i.e., interarrival times), Z
�
a+b 2
�
, in the interval [a, b], from the endpoints,
Z(a) and Z(b). If the generated values were self-similar, the midpoint value, Z
�
a+b 2
�
, would
be independent of the interval, Z(b) − Z(a). That is, it would be scale-invariant. The RMD algorithm speeds up the process of choosing the values by picking the values independently at the time they are needed. Other self-similar traffic generations methods can be found in [Nor95] and [PSS96]. By far the simplest way to generate self-similar traffic is to draw interarrival times from the Pareto distribution [JK70], [PF95]. The Pareto distribution was first used to describe the distribution of income among a population. It has since been used to describe such phenomena as the sizes of asteroids, cities, and, more recently, CPU time consumption and packet interarrival times [PF95]. The Pareto distribution is heavy-tailed. Informally, that means it is quite probable that a value far exceeding the mean will occur. The most common form of the Pareto distribution (others can be found in [JK70]) has a cumulative distribution function (CDF) of FX (x) = 1 − ( kx )a
k > 0, a > 0; x ≥ k where k is the minimum value of
the distribution and a is the “shape” parameter of the distribution. The Pareto distribution has the characteristic that the mean and variance are infinite for a ≤ 1, the mean is finite for a > 1, and both the mean and variance are finite for a > 2.
Rusty O. Baldwin
Chapter 2. Background and Literature Survey
27
Random variates, x, can be generated easily using the transform method [JBS92] since the Pareto distribution has a closed-form CDF. Pareto random variates are generated by using x=
k 1 Ua
where x is the random variate, k is the minimum value of the distribution, a is the
shape parameter, and U is a uniform random number on (0,1). The density function of the Pareto distribution is pX (x) =
aka xa+1
a > 0, x ≥ k > 0. Using
this, the mean of the Pareto distribution can be determined to be m =
ak a−1
for a > 1.
In practice, as a → 1 it takes an increasingly large number of samples to achieve the m value given by the above formula. This is due to the fact that as a → 1, m → ∞. While this is indeed the behavior that is exhibited by self-similar traffic, it makes it difficult to compare the behavior of systems with traffic that have the same a parameter. For instance, for a = 1.12 and k = 1, m = 9.333. However, the mean value obtained using the random variate generation method described above was typically less than 7.0 for 100,000 samples. Results varied widely, as would be expected, and sometimes the mean was as high as 50. The mean value for a ≥ 1.4 seemed to stabilize as the variance of the distribution moved towards its finite characteristic. Another type of traffic model is the Markov-modulated model. In this type of model, different arrival probabilities are used for each of the k states in the Markov model. That is, each state, k, specifies a different process by which the probability of an arrival is determined. The amount of time spent in the state is “modulated” by the underlying Markov process. This type of model is also know as doubly stochastic [FM94]. In [SL95], this model was used to generate self-similar traffic. The ON/OFF model [Bra69] is widely-used to model bursty data such as voice traffic. Although ON/OFF models that can model speech events such as double-talk and mutual silence can be constructed, a simpler two-state Markov chain is often used to model voice traffic [Pru95], [VZ95], [CPR96], [HS96], [STE96]. One state is a “talk” state and the other is a silent state. The time spent in each state is exponentially distributed with different means. Typical mean values for the talk and silent state are 1.00 seconds and 1.35 seconds
Rusty O. Baldwin
Chapter 2. Background and Literature Survey
28
respectively [CPR96]. During the “talk” state, bits arrive at a constant rate, with 32kbps and 64kbps being typical values. The bits are then packetized and transmitted. The International Telecommunications Union (ITU) has developed numerous speech coding standards including the G.726 adaptive differential pulse code modulation (ADPCM) standard which uses a 32kbps rate and the G.711 PCM standard uses a 64kbps rate [Cox97]. Latency requirements for packetized voice is highly dependent on the user. In the ITU G.114 recommendation [ITU96] cited in [KBS+98], some users found a 300-800 ms delay acceptable while others would not accept anything beyond 200 ms. Voice packet loss in the range of 5-10% was found acceptable for random packet losses. If the losses occurred in bursts, some type of codec (voice encoding) that compensated for the loss was recommended [KBS+98]. There are many other types of traffic models as well as numerous techniques for generating traffic efficiently for simulation. Surveys of traffic models and generation techniques can be found in [FM94], [SAG94], and [RK96]. Two application domains with relatively well characterized traffic are the telemetry and avionics data bus. Both areas are characterized by traffic that have constant periodic interarrivals and little variability in arrival times. Telemetry data tends to have small packets as evidenced by a very common data bus, MIL-STD-1553 [ASC78], which can transmit a maximum of 32 16-bit words in a “packet”. Flight data and remote vehicle status are examples of typical telemetry applications. An avionics data bus tends to have larger packet sizes. The requirements for the Boeing 777 Airplane Information Management System (AIMS) is an example [CDHC94]. There are approximately 63 separate processes that use the data bus. Their periodic execution frequency ranges from 5 to 80 Hz. The packet (or message) transmission time (which is proportional to the message size) ranges from less than one millisecond to a maximum of 14 milliseconds. These types of systems may also have message latency requirements. In many applications a message (or packet) must be delivered before the next message arrives (i.e., the message latency requirement is equal to the arrival period). In AIMS, message latencies (in milliseconds) have a minimum of 12, a maximum of 1000
Rusty O. Baldwin
Chapter 2. Background and Literature Survey
Q
P '$ � * � � HH � H &%
G
p
29
'$ H HH � q �� � &%
B
Figure 2.10: Gilbert Model Transition Diagram with a mean of 380 [CDHC94].
2.3.2
Channel Models
A common figure of merit used in digital links is the bit-error-rate (BER) — the probability that a bit is received in error. The BER for a digital link is analogous to signal-to-noise ratio (SNR) for analog links [PB86]. Two types of BERs are commonly used in modeling channels. A static BER remains constant during the entire time the model is being used. A dynamic BER can change based on some parameter such as elapsed time or the number of bits transmitted. Static BER models assume that bit errors are statistically independent. It is well-known that errors in wireless networks tend occur in “bursts” and therefore cannot be accurately modeled using the assumption of independent errors [Gil60], [Fri67], [DMM88]. The classic dynamic BER model for digital channels is the Gilbert model [Gil60]. The Gilbert model is based on a two-state Markov chain shown in Figure 2.10. In the G or “good” state, no bit errors occur. In the B or “bad” state, errors occur with probability 1 − h where h is the probability of no bit error. A G-to-B state transition occurs with probability P ; a B-to-G transition occurs with probability p. The model remains in state G with probability Q = 1 − P and remains in state B with probability q = 1 − p. This model has been shown to model errors that occur in a wireless channel more accurately that a static BER model [DR92], [SF94], [WM95]. Models with more than two states have been proposed and shown to be even more accurate in modeling a wireless channel (with a corresponding increase in complexity). Some of these include [Fri67], [DMM88], [NKNS96], [LvS97].
Rusty O. Baldwin
Chapter 2. Background and Literature Survey
30
The probability of a state transition in the Gilbert model is evaluated upon the presentation of a bit to the channel. That is, state transitions are evaluated on a bit-by-bit basis. This type of model can be termed a “transmission modulated model”. In the context of simulation, this can require an inordinate amount of computation. A common technique to reduce this computational burden is to model the number of bits between state transitions as a geometrically distributed random variable. Therefore, rather than evaluating each bit for a possible state transition, a single calculation gives the number of bits between state transitions. Consider a 1 Mbps wireless channel with an average BER of 10−6 . To observe a single error, an average of 106 bits must be transmitted while the channel is in the bad state. Of course, if the channel is in a good state, no errors occur. Further, a transmission modulated model makes the improbable assumption that the state of the channel does not change when there are no bits are in the channel. An alternative to a transmission modulated model is a time modulated model. In this type of model, state transitions occur based on elapsed time rather than the number of bits transmitted. Using the two-state Gilbert model as an example, the time spent in the good or bad state is modeled as an exponentially distributed random variable with different means. This significantly reduced the computational burden and appeals to the intuition that the state of the channel does indeed change even though no bits are being transmitted. Research that has used this approach to channel modeling include [BBKT96], [BBKT97], [DRT97].
2.4
Related Research Efforts
Driven by the desire for voice and video over a wireless link, coupled with the demand for mobility, real-time wireless local area networks are seeing an increase in interest. Since access to the medium is vital in real-time applications, research has focused on the MAC layer. Most research into unmodified IEEE 802.11 focuses on the soft real-time aspects (i.e., voice/video). No research was found that investigated hard real-time use of IEEE 802.11. Other research
Rusty O. Baldwin
Chapter 2. Background and Literature Survey
31
into IEEE 802.11 focused on improving the fairness of the protocol by modifying the backoff algorithm.
2.4.1
IEEE 802.11
2.4.1.1
Voice over IEEE 802.11
Visser et al. [VZ95] use the CFP of IEEE 802.11 to transport voice data and use the CP to transport ordinary data. Depending on the length of the superframe (i.e., one CFP/CP pair), speech may be outdated when a poll arrives. If so, the data is clipped. Their research focuses on analyzing the quality of the voice conversations in terms of the percentage of bits clipped. In their research, they vary the superframe length and percentage of clipping, as well as the number of conversations that can be transported during one superframe. They conclude that, due to the high overhead introduced by the CFP polling scheme, the number of conversations that can be supported is relatively low — five to twelve depending on the number of conversations transported during one superframe. If, however, two percent clipping is allowed, the number of ongoing conversations can be doubled.
2.4.1.2
Modified Backoff Algorithms
In standard IEEE 802.11, the backoff algorithm specifies that, upon detecting a busy medium or upon a collision, an exponentially increasing integer must be used in the algorithm to determine the number of idle slots that a station must wait before transmitting again. While this algorithm may have a measure of fairness for stations that all attempt to gain access to the medium for the first time simultaneously, it can potentially allow another station to transmit prior to any of the waiting stations simply because it is trying now. That is, the backoff scheme in IEEE 802.11 favors the transmission of “newer” data. Woesner et al. [WWW96] propose two different modifications to IEEE 802.11: weighted
Rusty O. Baldwin
Chapter 2. Background and Literature Survey
32
slot selection probabilities and load adaptive slot selection. Both schemes try to improve performance by increasing the probability that stations wanting to transmit initially choose a larger slot count. The weighted slot selection scheme does this statically, thereby wasting bandwidth in lightly loaded networks. The load adaptive scheme attempts to overcome this defect by counting the number of idle slots between transmissions. Stations with new packets to transmit choose the number of slots to delay transmission from the range of [(CW-Idles), CW], where CW is the upper boundary of the range of slots to choose from and Idles is the number of idles slots counted between the last transmission and the current transmission. If the number of idle slots is small, it is assumed that the network is under heavy load. This modification makes it more likely that newly arriving packets will not transmit prior to packets that are already queued. Simulation indicates an improvement of up to 20% in throughput and 15% in access delay. Bianchi et al. [BFO96] takes a slightly different approach and adaptively modifies CWmin (cf., Section 2.2.3.1) depending on an estimate of the number of stations currently in the network. Stated simplistically, the algorithm reduces CWmin for networks with a small number of stations and increases it as the number of stations increase. This adaptive algorithm, in effect, removes the network throughput’s dependence on the number of stations in the network. Simulations show that, when using the adaptive algorithm, saturated throughput remained at about 0.81 as the number of stations increased from 5 to 50. In contrast, using a fixed value of 31 for CWmin, saturated throughput declined from 0.81 to 0.61 as the number of stations increased from 5 to 50. Other schemes that dynamically alter the value of CWmin and/or CWmax have been proposed and can be found in [Bha98] and [CCG98].
Rusty O. Baldwin
Chapter 2. Background and Literature Survey
2.4.2
Real-time Wireless Medium Access Control
2.4.2.1
IEEE 802.11 Compatible Schemes
33
Sobrinho and Krishnakumar [SK96] contend that the IEEE 802.11 CFP is so inefficient, it is not suitable for many real-time applications. They propose a scheme that is compatible with, but does not use IEEE 802.11. That is, their protocol can co-exist with IEEE 802.11, but gives the stations using the scheme undisputed access to the medium once access has been obtained. In their scheme, a real-time station waits for an idle medium, then issues a “black burst” or pulses of energy of length proportional to the length of time it has been waiting for the medium. After the “black burst,” the station listens to the medium to determine if another station has a longer burst, implying that it has been waiting longer. If the medium is idle, the station is free to transmit its data. Since in IEEE 802.11 all stations defer to a busy medium, no conflicts due to IEEE 802.11 stations will occur. Performance of this scheme was measured in terms of average data delay. Delays ranged from 0.0 to 13.0 ms for normalized loads up to 0.73, and were generally unbounded with loads above that level.
2.4.2.2
Hard Real-Time Schemes
The two MAC protocols discussed in Section 2.2.1 (R-ALOHA) and Section 2.2.4.1 (Virtual Time CSMA) have been proposed for hard real-time systems. As these protocols have already been presented, only their performance will be reviewed here. Liu et al., using R-ALOHA, reports in [LSP95] a deadline failure probability of almost 10−12 for a fixed deadline of 4 frames and a constant packet error probability of 0.001. A more detailed presentation of this approach can be found in [Liu96]. Using virtual time CSMA [WZ87], the percentage of messages lost due to a missed deadline is seldom less than 20% for any scenario investigated, except in the case of network loads less than 0.5. This fact
Rusty O. Baldwin
Chapter 2. Background and Literature Survey
34
alone seems to make this protocol unsuitable for any hard real-time system expecting even a moderately loaded network. Though not dealing with wireless networks specifically, [Mal94] proposes using multi-version messages. During light network loading, full length messages would be sent; during high load periods, shorter length versions of the full length messages would be used-effectively lowering the network load.
2.5
Summary
This chapter highlights real-time wireless LANs. As a subset of wireless LANs, it was shown that they have unique challenges associated with their implementation — packet delivery is time-constrained. Section 2.1 presented an overview of the Open Systems Interconnection (OSI) model. The importance of the MAC sublayer within the DLC layer of the OSI model was noted. Since the MAC controls access to the medium, it is logical that it be the focus of intense research in terms of performance; both real-time and average case. Significant MAC protocols are presented in Section 2.2 including ALOHA, CSMA, IEEE 802.11, and others. The performance of each is presented along with a brief tutorial of IEEE 802.11. The operation of the protocol is explained and its performance is highlighted. Models of network traffic and wireless channels were discussed in Section 2.3. Basic aspects of the Poisson process and self-similar traffic models were presented. The theory and performance of finite-state Markov channel models such as the Gilbert model was discussed. Finally, related research into real-time wireless networks was presented in Section 2.4. Modifications to the IEEE 802.11 backoff scheme were discussed. Most research focused on how to transport soft real-time data effectively. Relatively little has been done in the area of hard real-time wireless systems.
Chapter 3 Analytic Network Analysis Techniques Queueing network analysis is a valuable tool for determining the performance and operating characteristics of real-world systems. Its use in modeling such diverse areas as communications networks, manufacturing environments, the economy, computers, and numerous other applications is testimony to its value and flexibility. To get the most benefit from any tool however, one should understand what problems it was intended to solve—“the right tool for the right job” as the axiom goes. It may be the case in a particular situation (as it was in this research) that analytic analysis techniques are not suitable (cf., Section 4.6). Even so, knowledge of the concepts and terminology encountered in queueing network analysis will be of benefit in determining whether such techniques can be profitably employed and aid in choosing the proper queueing network analysis tools to analyze a problem.
35
Rusty O. Baldwin
3.1
Chapter 3. Analytic Network Analysis Techniques
36
Introduction
A queueing network is a collection of two or more single queues or “nodes” where customers receive service. Customers arriving at the network request service at one or more of the nodes and then may leave the network. Section 3.2 introduces and defines terms used to classify queueing networks. It helps answer the questions of whether the network is open or closed, continuous or discrete, and small or large. Are the individual queues independent? Is the network reversible? The answer to these (and other) questions is a primary factor in choosing the proper analysis tool. Section 3.3 presents various analytical techniques along with examples. References for more advanced or more detailed information is included throughout.
3.2
Queuing Network Classification
Classification is especially important in queueing networks. Many classes of networks have no known closed-form solutions. Other networks have state spaces that are so large that certain analysis techniques, while theoretically possible, become intractable. For these cases, approximations (or perhaps simulation) may be appropriate. The following sections introduce terms and concepts used to classify queueing networks.
3.2.1
Open, Closed, and Mixed Networks
A fundamental and simple characteristic of queueing networks is whether they are open or closed. An open network (Figure 3.1) permits arrivals and departures from outside the network. In a closed network (Figure 3.2), customers are “trapped” and circulate among the various nodes in the network. The dashed box in the figures indicates the logical boundary of the queueing network. The circles are the nodes where customers receive service. The arrows indicate the paths customers may take within the network.
Rusty O. Baldwin
Chapter 3. Analytic Network Analysis Techniques
Open Network
� �
-
� �
Network departure
� � '$ HH * � � � H � H &% � H � HH � j H � '$ '$ Network
External Arrivals
departure
-
-
&% &% HH * � � � H � '$ H H �� HH � j H � &%
Figure 3.1: An Open Network
Closed Network '$ ��
* � � �
� �� �� � '$
HH Y HH H H &% HH 6 H j H '$
&% H H H '$ H HH H j H
&%
&%
Figure 3.2: A Closed Network
37
Rusty O. Baldwin
Chapter 3. Analytic Network Analysis Techniques
38
It is conceivable that a network might contain different classes of customers and that the network may be open to one class and closed to another. An example of this can be found in computer systems where user jobs enter and exit the system but certain system-level jobs are always present and circulate continuously within the system. This is a mixed network. Techniques that can be used to analyze these networks are discussed later.
3.2.2
Customer Arrivals, Service, and Routing
Except where explicitly noted, it is assumed that customers arrive one-at-a-time according to a Poisson process. Customers are served one-at-a-time and service times are assumed to be exponentially distributed. Further, routing within the network is independent of the network state. While these assumptions may seem restrictive, there are many cases where valid results are obtained by treating queueing networks as if these assumptions hold when, in fact, they may not. Cases where more than one customer can arrive, obtain service, and/or depart are known as bulk or batch arrival, service, and/or departure, respectively. Allowing general arrival and service distributions can result in solutions that are quite complex or even non-existent. For results with relaxed arrival and service assumptions, the interested reader may find it valuable to consult the following [BD96], [BG92], [Dij93], [HT90], [HT91], [HNT95], [HPTvD90], [Kel79], [Mar79], [Puj95], [Ser93], [Woo94], [Woo97], and [ZC96]. Real-time Queueing Theory can be used to analyze customers with deadlines. Details can be found in [Leh96], [Leh97a], [Leh97b]. A tutorial presentation can be found in [BDKM98].
3.2.3
Continuous and Discrete Time Networks
Classical queueing theory was developed almost exclusively using the assumption of continuous time [Woo94] where time progresses in infinitesimally small increments. The increments are so small that, so the assumption goes, the possibility of a given state occurring due to
Rusty O. Baldwin
Chapter 3. Analytic Network Analysis Techniques
39
two or more state changes occurring is virtually zero. This assumption greatly simplifies the analysis task. The concept of “virtually zero” has been formally defined in the function o(t) =0 where t is time. A function that is o(t) goes to zero with t, faster than t itself, i.e., lim o(t) t t→0
[Kle75]. Using this definition, the probability of a given state occurring may be described as f(t) + o(t) where f(t) is the probability of the state occurring due to a single state change and o(t) is the probability of the state occurring due to two or more state changes. In discrete time, time progresses in arbitrarily small, rather than infinitesimally small, increments. This seemingly minor change induces huge analytic difficulties, for now the possibility of a state occurring due to two or more state changes is no longer o(t). Discrete-time networks are attractive, despite these difficulties, because they can more accurately model what actually happens in a network with nodes that operate on a time-slotted basis [Woo94]. Examples of these networks include communications protocols such as slotted ALOHA [Abr77], IEEE 802.11 [Edi97], or Asynchronous Transfer Mode (ATM) (which is ultimately transported by a synchronous slotted protocol, SONET) [BG92], [BC89]. Whether one chooses to use a continuous or discrete-time model, sometimes the complexity of the network requires the use of approximations in order to get any solution at all. While research into exact product-form solutions for queueing networks goes on, it has long been recognized that approximations are inevitable [ICH84] or even preferable [Kle76] given the simplifying assumptions that are often introduced into the analysis. Some of these approximation techniques are described in Section 3.3.2.
3.2.4
Interfering Queues
In many queueing networks, customers are served without regard to whether another customer at a different node is receiving service at the same time. That is, the nodes within the network are independent. There are instances; however, where this is not the case. In packet radio networks and computer communication networks such as Ethernet, nodes serve packets by transmitting them. Nodes within the network use a common resource to provide
Rusty O. Baldwin
Chapter 3. Analytic Network Analysis Techniques
40
that service—a single transmission channel. When two or more nodes attempt to use the transmission channel at the same time, a collision is said to occur. While algorithms are used to reduce collisions as much as possible, collisions can, and will, occur. In a collision, both packet transmissions are assumed to fail which reduces system throughput. Such queueing networks are said to have interfering queues. Stated simply, queue interference occurs when service provided by Node 1 and Node 2 overlap in time. Note that this is not the same as blocking. With blocking, Node 1 can successfully use the transmission channel while preventing Node 2 from using it. Networks with interfering queues cannot be solved exactly using classical queueing network theory [KY80], [YH91] since the next node the customer will visit depends on whether a collision has occurred (i.e., the individual node routing probabilities are no longer independent). If a collision did occur, the customer may stay at the current node. If a collision did not occur, then the customer may go to a different node for service or leave the network. Several special cases do have exact solutions; but the restrictions imposed on the networks, which typically involve only two nodes, are considerable. An excellent bibliography of these types of solutions can be found in [YH91]. For the purposes of this chapter, once a network has been identified as containing interfering queues, an approximation technique such as those described in Section 3.3.2 to analyze the network should be employed.
3.2.5
Global, Local, and Detailed Balance
The state of a network, n, is an M–tuple, (n1, n2 , n3 , . . . , nM ), where each ni is the number of customers at node i including customers that are in service. Balance, with respect to queueing networks, refers to the state of the network due to a flow of customers in and out of a given portion of the network. Global balance means that the probabilistic rate at which the network leaves a state must equal the probabilistic rate at which the network enters that state. With global balance, the portion of the network is the entire network. Local balance
Rusty O. Baldwin
Chapter 3. Analytic Network Analysis Techniques
41
is similar except that the portion is a single node. Local balance means that the probabilistic rate at which the network leaves a given state due to a departure from a given node must equal the probabilistic rate at which the network enters that same state due to an arrival at that same node [Kle75]. Detailed balance says that the rate at which the network leaves a given state to arrive at a new state must equal the rate at which the network leaves that new state to arrive at the given state [Kel79]. Examples to clarify these concepts are presented in the following sections. The terminology used for global, local, and detailed balance is somewhat muddled. What [Kle75] refers to as global balance, [Kel79] calls full balance, and [Ser93] calls total balance. Similarly, what [Kle75] calls local balance, [Kel79] and [Ser93] call partial balance. There appears to be some agreement on the term detailed balance. In this chapter, the terms global, local, and detailed balance will be used. Balance equations are the set of equations that are true if global, local, or detailed balance holds. Their solution, if it exists, provides the equilibrium probability distribution of a network—the probability of a given network state. All the networks discussed in this chapter exhibit global and local balance since they are assumed to be in equilibrium. A network in equilibrium may or may not have detailed balance. Discussion of the existence and uniqueness of the equilibrium distribution solutions found using balance equations can be found in [Kle75]. If a network has detailed balance, its equilibrium distribution has a known canonical form and it is said to be reversible. Reversibility is discussed in Section 3.2.6. A simple example exploiting the canonical form of a reversible network is contained in Section 3.2.6.2. Extensive details can be found in [Kel79]. The network shown in Figure 3.3 is a slight modification of the example used in [Kle75] and will be used to demonstrate global and local balance. The arrival and service distributions are assumed to be exponential. The circles represent nodes within the network, the labeled arcs represent the direction and probability that a customer will take a particular path out of a node. The number of nodes, M, is 3, µi is the service rate of the ith node, and the
Rusty O. Baldwin
Chapter 3. Analytic Network Analysis Techniques
42
1 '$
µ1
�
'$0.5
0.5
µ2
? '$ -
µ3
&%
� &%
&%
Node 1
Node 2
Node 3
1
Figure 3.3: Closed Queueing Network - M = 3, N = 2 number of customers within the network (not shown in the figure), N, is 2.
3.2.5.1
Global Balance
To determine the global balance equations, one must first determine all the possible states the network can be in. This is most easily done by the construction of a state-transition diagram. The total number of states can be computed by using
.
M +N −1
M −1
The number of ways N = 2 customers can be distributed among M = 3 nodes is 6. Incidentally, using even slightly larger values for M and N results in a staggering increase in the state space. Consider a network with M = 10 and N = 10; 10 customers distributed among 10 nodes. The number of states is 92,378! Using the number of possible states (i.e., 6) and Figure 3.3, the state-transition diagram for the network can be constructed and is shown in Figure 3.4. Note how the state transition diagram reflects the assumption of continuous time. There is no direct path between state (2,0,0) and (0,0,2) since this would require two state changes; first to (1,0,1) as a customer moves from Node 1 to Node 3, and then to (0,0,2) as the other customer at Node 1 moves to Node 3. This network has six global balance equations (one for each state). It will always be the case
Rusty O. Baldwin
Chapter 3. Analytic Network Analysis Techniques
43
'$
020 H &% H 0.5µ2 6 H HH '$ H H H j µ3 0.5µ2 H 6H 0.5µ2 µ1 ���&% H � HH '$ '$ � ? � H � H H � � j µ3 0.5µ2
110
011
200
H &% µ1 ���&% 6 H 0.5µ2 H HH '$ �� ? � H � H H � � j µ3 0.5µ2 µ1 ���&% '$ �� ? � � � �
101
002
&%
Figure 3.4: State Transition Diagram that one equation has a linear dependence; therefore, the fact that all the state probabilities must sum to 1 is also used. The general global balance equation is [Kel79] p(n)
XX M
M
µjk =
XX M
p(Tjk n)µkj
(3.1)
M
where p(n) is the probability of being in state n, M is the number of nodes in the network, j and k are particular nodes in the network, µjk is the rate at which customers leave node j to arrive at node k, and Tjk n is an operator that takes a customer from node j and places it in k when the network is in state n. For example, T13(2, 0, 0) = (1, 0, 1). While (3.1) seems formidable, in practice many of the terms are zero and it is often possible to simply write the global balance equations by inspecting the state diagram. We will develop the global balance equation for the network in state (2,0,0) in detail and state the rest. The global balance equation for the network in state (2,0,0) is p(2, 0, 0)[µ11 + µ12 + µ13 + µ21 + µ22 + µ23 + µ31 + µ32 + µ33 ]
Rusty O. Baldwin
Chapter 3. Analytic Network Analysis Techniques
= p(T11(2, 0, 0))µ11 + p(T12(2, 0, 0))µ21 + p(T13(2, 0, 0))µ31
44 (3.2)
+p(T21(2, 0, 0))µ12 + p(T22(2, 0, 0))µ22 + p(T23 (2, 0, 0))µ32 +p(T31(2, 0, 0))µ13 + p(T32(2, 0, 0))µ23 + p(T33(2, 0, 0))µ33 . Due to the topology of the network, the only non-zero rates (i.e., the µjk terms) are µ13, µ21 , µ23 , and µ32 which are µ1 , 0.5µ2 , 0.5µ2 , and µ3 respectively. This reduces the above equation to p(2, 0, 0)[µ1 + µ2 + µ3 ] = p(T31 (2, 0, 0))µ1 + p(T12 (2, 0, 0))0.5µ2
(3.3)
+p(T32 (2, 0, 0))0.5µ2 + p(T23(2, 0, 0))µ3 . Focusing on the left-hand side of (3.3), note that there are no customers at nodes 2 and 3 in state (2,0,0); therefore, µ2 = µ3 = 0 and the equation becomes µ1 p(2, 0, 0) = p(T31 (2, 0, 0))µ1 + p(T12(2, 0, 0))0.5µ2
(3.4)
+p(T32 (2, 0, 0))0.5µ2 + p(T23(2, 0, 0))µ3 . Again, since there are only customers at Node 1, the only non-zero term on the right-hand side is p(T12(2, 0, 0))0.5µ2 . This reduces the equation to µ1 p(2, 0, 0) = p(T12(2, 0, 0))0.5µ2 .
(3.5)
Evaluating the operator T12(2, 0, 0), we finally arrive at the first global balance equation µ1 p(2, 0, 0) = 0.5µ2 p(1, 1, 0).
(3.6)
This equation can easily be verified by inspecting Figure 3.4. The remaining five global balance equations for the network in Figure 3.3 are determined in the same manner and are µ2 p(0, 2, 0) = µ3 p(0, 1, 1)
(3.7)
µ3 p(0, 0, 2) = µ1 p(1, 0, 1) + 0.5µ2 p(0, 1, 1)
(3.8)
(µ2 + µ3 )p(0, 1, 1) = µ1 p(1, 1, 0) + 0.5µ2 p(0, 2, 0) + µ3 p(0, 0, 2)
(3.9)
(µ1 + µ2 )p(1, 1, 0) = 0.5µ2 p(0, 2, 0) + µ3 p(1, 0, 1)
(3.10)
(µ1 + µ3 )p(1, 0, 1) = µ1 p(2, 0, 0) + 0.5µ2 p(0, 1, 1) + 0.5µ2 p(1, 1, 0).
(3.11)
Rusty O. Baldwin
Chapter 3. Analytic Network Analysis Techniques
45
Of course, to ensure all probabilities sum to one, the following must also hold p(2, 0, 0) + p(0, 2, 0) + p(0, 0, 2) + p(0, 1, 1) + p(1, 1, 0) + p(1, 0, 1) = 1.
(3.12)
We could proceed by solving these equations in the normal fashion (as simultaneous linear equations). However, the local balance equations can provide an easier way to obtain a solution.
3.2.5.2
Local Balance
A local balance equation accounts for the flow to and from a network state due to arrivals at and departures from an individual node in the network. A global balance equation for a given state, in contrast, accounts for the state probability flow to and from all network states. Local balance equations are usually simpler than the global equations and have the useful property that their solution, if it exists, is also a solution to the global balance equations. The general local balance equation is [Kel79] p(n)
X N
µjk =
X
p(Tjk n)µkj
(3.13)
N
where p(n) is the probability of being in state n, N is the number of customers in the network, j and k are particular nodes in the network, µjk is the rate at which customers leave node j to arrive at node k, and Tjk n is an operator that takes a customer from node j and places it in k when the network is in state n. Referring to Figure 3.3, the local balance equations for Node 1 (i.e., j = 1) are µ1 p(2, 0, 0) = 0.5µ2 p(1, 1, 0)
(3.14)
µ1 p(1, 0, 1) = 0.5µ2 p(0, 1, 1)
(3.15)
µ1 p(1, 1, 0) = 0.5µ2 p(0, 2, 0).
(3.16)
There are three equations since there are three network states which can result in customers departing from Node 1 (e.g., (2,0,0), (1,0,1), (1,1,0)). The cases where Node 1 has zero
Rusty O. Baldwin
Chapter 3. Analytic Network Analysis Techniques
46
customers (e.g., (0,2,0), etc.) balance trivially. Equation (3.14) represents the rate of leaving state (2,0,0) due to customer departures from Node 1 equaling the rate of entering into state (2,0,0) due to customers arriving at Node 1 from Node 2. The only way the network could be in state (2,0,0) is due to customers arriving from Node 2 when the network was in state (1,1,0). Recall that we are assuming the system is in equilibrium and that time is continuous. Equation (3.14) also happens to be the same as (3.6) in the global balance equations. The equations for Node 2 (e.g., j = 2) provide cases that cannot be read directly from the global equations. The Node 2 equations are µ2 p(0, 2, 0) = µ3 p(0, 1, 1)
(3.17)
µ2 p(1, 1, 0) = µ3 p(1, 0, 1)
(3.18)
µ2 p(0, 1, 1) = µ3 p(0, 0, 2).
(3.19)
Note that these equations are much simpler than the global balance equations. The equations for Node 3 are more interesting since customers come from multiple sources. The Node 3 equations are µ3 p(0, 0, 2) = µ1 p(1, 0, 1) + 0.5µ2 p(0, 1, 1)
(3.20)
µ3 p(1, 0, 1) = µ1 p(2, 0, 0) + 0.5µ2 p(1, 1, 0)
(3.21)
µ3 p(0, 1, 1) = µ1 p(1, 1, 0) + 0.5µ2 p(0, 2, 0).
(3.22)
Reading (3.20), the rate of leaving state (0,0,2) due to customer departures at Node 3 is equal to rate of entering into state (0,0,2) due to customers arriving from Nodes 1 and 2. Solving these equations is much easier than the corresponding global equations. Solving in terms of p(2, 0, 0) is straightforward and results in the following 4µ21 p(2, 0, 0) µ22 4µ21 p(0, 0, 2) = p(2, 0, 0) µ23 2µ1 p(1, 1, 0) = p(2, 0, 0) µ2 p(0, 2, 0) =
(3.23) (3.24) (3.25)
Rusty O. Baldwin
Chapter 3. Analytic Network Analysis Techniques 4µ21 p(2, 0, 0) µ2 µ3 2µ1 p(2, 0, 0) . p(1, 0, 1) = µ3 p(0, 1, 1) =
47
(3.26) (3.27)
Using (3.12), we determine p(2, 0, 0) to be "
4µ2 4µ2 2µ1 4µ21 2µ1 p(2, 0, 0) = 1 + 21 + 21 + + + µ2 µ3 µ2 µ2 µ3 µ3
#−1
.
(3.28)
The skeptical reader can verify that (3.23)–(3.28) indeed satisfy the global balance equations given in (3.6)–(3.11).
3.2.5.3
Detailed Balance
As stated above, for detailed balance the rate at which the network leaves a given state to enter a new state must equal the rate at which the network leaves that new state to enter the given state [Kel79]. There is a subtle distinction between this and global balance. In global balance, the rate of leaving a given state to all other states must equal the rate of entering a given state from all other states. In detailed balance, the rate of leaving a state n to arrive at m must equal the rate of leaving m to arrive at n. As with local balance equations, solutions to the detailed balance equations, if they exist, will solve the corresponding global balance equations. The general detailed balance equation is [Kel79] p(n)µjk = p(Tjk n)µkj
(3.29)
where p(n) is the probability of being in state n, j and k are particular nodes in the network, µjk is the rate at which customers leave node j to arrive at node k, and Tjk n is an operator that takes a customer from node j and places it in k when the network is in state n. The detailed balance equations for state (2,0,0) are p(2, 0, 0)µ11 = p(T11(2, 0, 0))µ11
(3.30)
p(2, 0, 0)µ12 = p(T12(2, 0, 0))µ21
(3.31)
Rusty O. Baldwin
Chapter 3. Analytic Network Analysis Techniques
48
p(2, 0, 0)µ13 = p(T13(2, 0, 0))µ31
(3.32)
p(2, 0, 0)µ21 = p(T21(2, 0, 0))µ12
(3.33)
p(2, 0, 0)µ22 = p(T22(2, 0, 0))µ22
(3.34)
p(2, 0, 0)µ23 = p(T23(2, 0, 0))µ32
(3.35)
p(2, 0, 0)µ31 = p(T31(2, 0, 0))µ13
(3.36)
p(2, 0, 0)µ32 = p(T32(2, 0, 0))µ23
(3.37)
p(2, 0, 0)µ33 = p(T33(2, 0, 0))µ33 .
(3.38)
The equations (3.30), (3.34), and (3.38) are satisfied trivially (i.e., 0 = 0). Looking closer at (3.32), and substituting in for the transition rates, µjk , we find that p(2, 0, 0)µ1 6= 0.
(3.39)
Since the two sides are not equal, detailed balance does not hold. It is not necessary to check any other equations since each detailed balance equation must hold.
3.2.6
Reversibility
In the previous section, it was stated that the reversibility of a network can be exploited to determine the equilibrium distribution. Many reversible networks have a known canonical form for their equilibrium distributions. In this section, we illustrate the concept of reversibility and give an example using a simple network. In [Kel79], reversibility is described conceptually as a series of photographs taken of the changing states of a reversible random process. After taking the pictures, if we go back through them in reverse order, the process will be statistically indistinguishable although reversed in time. Also in [Kel79], it was shown that a network is reversible if and only if the detailed balance equations hold. Using the simple network shown in Figure 3.5, we construct the detailed balance equations and from these, derive the equilibrium distribution of customers in the
Rusty O. Baldwin
Chapter 3. Analytic Network Analysis Techniques
'$
µ1
49
'$ -
µ2
� &%
&%
Node 1
Node 2
Figure 3.5: Closed Tandem Queueing Network – M = 2, N = 3
�� µ1-�� µ1-�� µ1-�� 3,0 � 2,1 � 1,2 � 0,3 µ2 �� µ2 �� µ2 �� ��
Figure 3.6: State Transition Diagram – Closed Tandem Queueing Network network. If the detailed balance equations hold, the network is reversible. We then show how the equilibrium distribution can be determined directly using the known canonical form of this reversible network. Of course, to do this we assume rather than demonstrate reversibility. This is often the approach taken in practice since most interesting networks are more complex than those presented here. If the assumption of reversibility is incorrect, the canonical form will yield inconsistent results.
3.2.6.1
Detailed Balance Equations
The arrival and service distributions are assumed to be exponential. The number of nodes, M, is 2 and the number of customers within the network, N, is 3. This network has 4 states: (3,0), (2,1), (1,2) and (0,3). The state transition diagram of this network is shown in Fig 3.6. The detailed balance equations that must hold for this network to be reversible are (eliminating redundancies) p(3, 0)µ1 = p(2, 1)µ2
(3.40)
Rusty O. Baldwin
Chapter 3. Analytic Network Analysis Techniques
50
p(2, 1)µ1 = p(1, 2)µ2
(3.41)
p(1, 2)µ1 = p(0, 3)µ2
(3.42)
and, of course, since the state probabilities must add to one p(3, 0) + p(2, 1) + p(1, 2) + p(0, 3) = 1.
(3.43)
Solving these equations is trivial and the equilibrium distribution is p(3, 0) = � 1+
µ1 µ2
1
� µ1 2 µ2
µ2 1 +
µ1 µ2
+
µ22
1+
µ1 µ2
+
µ32
�
� µ1 2 µ2
+
�
� µ1 2 µ2
+
µ31
�
p(0, 3) =
� µ1 3 µ2
µ21
�
p(1, 2) =
+
�
µ1
�
p(2, 1) =
3.2.6.2
+
�
1+
µ1 µ2
+
�
� µ1 2 µ2
+
�
(3.44)
�
� µ1 3 µ2
�
(3.45)
�
� µ1 3 µ2
�
(3.46)
�
� µ1 3 µ2
�.
(3.47)
Canonical Form
The canonical form of the equilibrium distribution for a reversible closed network is [Ser93] M Y
p(n) = cΦ(n)
n
wj j
(3.48)
j=1
where n is the state of the network, c is a normalization constant, Φ(n) is a positive function on the network state space, M is the number of nodes in the network, nj is the number of customers at the jth node, and the wj are positive numbers that satisfy the routing equations wj
X k
µjk =
X
wk µkj
(3.49)
k
where j and k are nodes in the network and µjk is the rate at which customers move from j to k.
Rusty O. Baldwin
Chapter 3. Analytic Network Analysis Techniques
51
First, we determine the wj ’s that satisfy the routing equations. Using (3.49), the routing equations for the network shown in Figure 3.5 are w1 (µ11 + µ12) = w1 µ11 + w2µ21
(3.50)
w2 (µ21 + µ22) = w1 µ12 + w2µ22 .
(3.51)
In this network, the rate at which customers move among the nodes of the network is simply the service rate of the node. Substituting those service rates into the above equations and solving them we find that they both have the same non-unique solution µ2 w1 = . w2 µ1
(3.52)
We will take the most straight-forward approach and set w1 = µ2 and w2 = µ1 . The function Φ(n) is a function of the network state. It is defined in terms of routing intensities where the route a particular customer takes may depend on the state of the network as a whole. In the case of the simple network under consideration, routing is not a function of network state and Φ(n) = 1 in all cases. Incidentally, if the routing intensities are a function of only the number of customers at a particular node, i.e., the nodes are independent, then the process is a Jackson network. We discuss this type of network in Section 3.3.1.1. We now have all the values needed to solve the network using the canonical form given in (3.48). For the network in state (3,0), (3.48) becomes p(3, 0) = cµ32 µ01 = cµ32 .
(3.53)
Solving for states (2,1), (1,2), and (0,3) respectively, in the same manner, we have p(2, 1) = cµ22 µ1
(3.54)
p(1, 2) = cµ2 µ21
(3.55)
p(0, 3) = cµ02 µ31 = cµ31 .
(3.56)
Rusty O. Baldwin
Chapter 3. Analytic Network Analysis Techniques
52
Solving for the normalization constant c cµ31 + cµ21 µ2 + cµ1 µ22 + cµ32 = 1
(3.57)
and c=
µ31
+
µ21 µ2
1 . + µ1 µ22 + µ32
(3.58)
Substituting (3.58) back into (3.53)–(3.56) and writing them in the same form as the detailed balance equations, we obtain the same solution as the detailed balance equations, as expected. The value of the canonical form is that it provides a means of solving a network that is known, or assumed, to be reversible when the complexity of the network precludes solving the detailed balance equations. To enhance the clarity of the presentation, a simple network was used as an example. As stated before, often reversibility is assumed and the canonical form of network equilibrium is used to check the assumption. Canonical forms differ for different types of networks (e.g., open, closed, independent or dependent routing, etc.). A note of caution—one should not conclude that only reversible networks have canonical forms. Canonical forms have been discovered for many non-reversible networks including those with batch arrivals and batch service [HT90]; more are being discovered all the time. For more detailed information on the concept of reversibility, the interested reader is encouraged to refer to [Ser93], [Dij93], and [Kel79] which provide a comprehensive treatment.
3.2.7
Normalization Constant
Customers do not arrive to or depart from a closed network; therefore, the number of customers within the network is fixed. These customers circulate among the nodes within the network forever. This being the case, the rate at which customers arrive at the individual nodes depends solely on the rate that the customers are served within the network. In a closed network, this arrival rate is normalized to 1. If we used the equilibrium equations for closed networks at this point, the result would not be the equilibrium probability of the
Rusty O. Baldwin
Chapter 3. Analytic Network Analysis Techniques
53
network being in a certain state. Rather, the result would be the relative frequency that the network was in a certain state. Further, these numbers would not add up to 1 as required for a probability distribution. A normalization constant is introduced to convert the relative frequencies into probabilities. The normalization constant has been computed several times in the previous sections with ease (e.g., (3.12), (3.43), and (3.58)). For a network of any appreciable size, enumerating all possible network states (as was done in the previous cases) is not feasible. In this section, we explore two alternate ways of calculating a normalization constant. Other computational algorithms can be found in [BB80].
3.2.7.1
z–transform Method
The first method of calculating the normalization constant uses z–transforms [Kel79]. An excellent refresher on transforms, including the z–transform, can be found in [Kle75]. In this section, we will again use the network shown in Figure 3.5. First, we define the generating function Ψj (z) =
N +1 X
(wj z)n
(3.59)
n=0
and
∞ X
zk B(z) = Bk k=0
(3.60)
where N is the number of customers in the network, wj are positive numbers that satisfy the routing equations in (3.49), and B(z) is the z–transform of the normalization constants, Bk , for 0 ≤ k ≤ ∞. Without proof, we state B(z) =
M Y
Ψj (z)
(3.61)
j=1
where M is the number of nodes in the network. Referring to the network in Figure 3.5, and recalling that w1 = µ2 and w2 = µ1 for that network, we have, using (3.59) Ψ1(z) = (µ2 z)0 + (µ2 z)1 + (µ2 z)2 + (µ2 z)3 + (µ2 z)4
(3.62)
Rusty O. Baldwin
Chapter 3. Analytic Network Analysis Techniques
54
or Ψ1 (z) = 1 + µ2 z + µ22 z 2 + µ32 z 3 + µ42 z 4
(3.63)
Ψ2(z) = (µ1 z)0 + (µ1 z)1 + (µ1 z)2 + (µ1 z)3 + (µ1 z)4
(3.64)
Ψ2 (z) = 1 + µ1 z + µ21 z 2 + µ31 z 3 + µ41 z 4 .
(3.65)
and
or
Substituting (3.63) and (3.65) into (3.61) results in B(z) = 1 + (µ1 + µ2 )z + (µ21 + µ1 µ2 + µ22 )z 2
(3.66)
+(µ31 + µ21 µ2 + µ1 µ22 + µ32 )z 3 + · · · + (µ41 µ42 )z 8 . We see that for N = 3, the number of customers in the network, the normalization constant is 1 = µ31 + µ21 µ2 + µ1 µ22 + µ32 B3
(3.67)
1 + µ1 µ22 + µ32
(3.68)
or B3 =
µ31
+
µ21 µ2
which is the same normalization constant found in (3.58) as required.
3.2.7.2
Convolution Algorithm
A second way to calculate a normalization constant due to [Buz73] is called the convolution algorithm. It performs the same task as the z–transform method but is formulated in such a way that z–transforms are not necessary. We will adopt the notation of [GN67] for the normalization constant, G(N), where N is the number of customers in the network. Using the convolution algorithm, as will be seen in Section 3.2.7.3, we can use the intermediate results (i.e., the G(i),
1 ≤ i ≤ N terms) to determine performance information about the
network. Note that the G(i) terms will not be equal to the Bi terms of Section 3.2.7.1, nor to their reciprocal (i.e., G(i) 6= Bi 6=
1 , Bi
1 ≤ i ≤ N).
Rusty O. Baldwin
Chapter 3. Analytic Network Analysis Techniques
55
In this section, we allow for the modeling of terminals within the network that will represent delays that are sometimes referred to as think time; the time a customer “thinks” prior to releasing a job to a node within the network. These terminal nodes are not included in the node count, M, and should be thought of collectively as node zero. With this background, we now proceed to describe how one can use the convolution algorithm to compute the normalization constant for a closed network. The following presentation generally follows that of [Jai91]. Gordon and Newell [GN67] found that the probability of a network being in state n is nM D0n0 D1n1 · · · DM p(n0 , n1 , . . . , nM ) = n0 !G(N)
(3.69)
where Di is the total service demand per customer on the ith node, ni is the number of customer jobs at the ith device, and G(N) is G(N) =
X
nM (D1n1 D2n2 . . . DM ).
(3.70)
n
For example, if a customer’s job makes 20 requests to a node, each request requiring 100 milliseconds of service, the service demand, D, would be D = 20(0.100) = 2.0. Note how this formulation differs from the z–transform method. The convolution algorithm requires that we know the average number of calls an average customer’s job makes to each node in the system (as well as the average service time for each call to a node). The z–transform method, in contrast, used the information embedded in the routing equations (e.g., (3.49)). Equations (3.69) and (3.70) are not used directly as this would require enumerating all possible network states. Further, calculating G(N) this way could induce overflow or underflow problems if calculated by a computer. To preclude this, the service demands, D, are scaled by α, where α=
1 M
1 . MDi
P
(3.71)
i=1
Thus, the scaled service demand for the ith node is yi = αDi . The scaled versions of (3.69) and (3.70) are p(n0 , n1, . . . , nM ) =
nM y0n0 y1n1 · · · yM n0 !G(N)
(3.72)
Rusty O. Baldwin
Chapter 3. Analytic Network Analysis Techniques
56
where yi is the scaled total service demand per customer on the ith node, ni is the number of customer jobs at the ith node, and G(N) =
X
nM (y1n0 y2n1 . . . yM ).
(3.73)
n
The convolution algorithm is based on the equation g(n, k) = g(n, k − 1) + yk g(n − 1, k)
(3.74)
G(N) = g(N, M)
(3.75)
and the relationship
where g(n, k) is an auxiliary function, n = 1, 2, . . . , N, k = 1, 2, . . . , M, yk is the scaled service demand for the kth node, and N and M are the number of customers and number of nodes in the network, respectively. The initial values for the auxiliary function are g(n, 0) =
y0n , n!
n = 1, 2, . . . , N
(3.76)
where y0 is the scaled “think time” or average delay at the customer terminal and g(0, k) = 1,
k = 1, 2, . . . , M.
(3.77)
If there are no terminals in the network then g(n, 0) = 0,
n = 1, 2, . . . , N.
(3.78)
Using (3.74), along with the initial values of the auxiliary function in (3.76)–(3.78), we have a simple way to calculate G(N). This is best illustrated using a table. The table has N + 1 rows labeled with the values n, yk ,
0 ≤ n ≤ N, and M + 1 columns labeled with the values of
0 ≤ k ≤ M. Table 3.1 shows the initial auxiliary function values.
Entry (n, k) in the table is g(n, k). The value for g(1, 1) is calculated by adding the entry immediately to the left of (1,1),
y01 , 1!
to the entry immediately above (1,1) which has been
multiplied by the value of the column label (i.e., y1 × 1). The result is
y01 1!
+ y1 (1) or g(1, 1) =
Rusty O. Baldwin
Chapter 3. Analytic Network Analysis Techniques
57
Table 3.1: Convolution Algorithm n⇓k⇒
y0
0 1 .. . n .. . N
y1
···
yk
···
yM
1
···
1
···
1
y01 1!
g(n − 1, k)
.. . y0n n!
↓ ×yk g(n, k − 1) →
g(n, k)
.. .
y0N N!
g(N, M)
y0 + y1 , which is simply a realization of (3.74). This process is repeated until all the entries in the table are filled. The right-most column contains valuable intermediate results as discussed above. The value of g(N, M) is normalization constant G(N). Let us again use the network of Figure 3.5 and compare the equilibrium state probability results to the answer obtained using the z–transform method. Recall that the network has three customers and two nodes, therefore N = 3 and M = 2. There are no terminals in this network; therefore, there will be no y0 node. In this network, each customer makes an equal number of calls to each node and has a unit amount of work to do; therefore, the scaled service demand on Node 1 (using a scaling factor α = 1 since underflow or overflow are not a concern) will simply be D1 = y1 = D2 = y2 =
1 . µ2
1 . µ1
Similarly, the scaled service demand on Node 2 is
Table 3.2 shows the complete results.
We see that the value of the normalization constant is G(3) = g(3, 2) =
1 1 1 1 µ32 + µ1 µ22 + µ21 µ2 + µ31 + + + = . µ31 µ21 µ2 µ1 µ22 µ32 µ31 µ32
(3.79)
Rusty O. Baldwin
Chapter 3. Analytic Network Analysis Techniques
58
Table 3.2: Convolution Algorithm for Tandem Network of Figure 3.5 n⇓k⇒
y0 = 0 y1 =
0
1 µ1
y2 =
1
1
0
1 µ1
2
0
1 µ21
3
0
1 µ31
1 µ2
1
1 µ1
1 µ21
1 µ31
+
+
+
1 µ2
1 µ1 µ2
1 µ21 µ2
+
+
1 µ22
1 µ1 µ22
+
1 µ32
Using the values for G(3), y1 , y2, and (3.72), the equilibrium state probabilities are p(3, 0) =
p(2, 1) =
p(1, 2) =
p(0, 3) =
as before in (3.44)–(3.47).
1 µ31 µ32 +µ1 µ22 +µ21 µ2 +µ31 µ31 µ32
=� 1+
1 µ21 µ2 µ32 +µ1 µ22 +µ21 µ2 +µ31 µ31 µ32
=
1 µ1 µ22 µ32 +µ1 µ22 +µ21 µ2 +µ31 µ31 µ32 1 µ32 µ32 +µ1 µ22 +µ21 µ2 +µ31 µ31 µ32
µ1 µ2
+
�
1
� µ1 2 µ2
µ2 1 +
µ1 µ2
+
1+
µ1 µ2
+
µ32
�
� µ1 2 µ2
+
�
� µ1 2 µ2
+
µ31
�
=
� µ1 3 µ2
µ21
�
µ22
�
µ1
�
=
+
1+
µ1 µ2
+
�
� µ1 2 µ2
+
�
(3.80)
�
� µ1 3 µ2
�
(3.81)
�
� µ1 3 µ2
�
(3.82)
�
� µ1 3 µ2
�
(3.83)
Rusty O. Baldwin 3.2.7.3
Chapter 3. Analytic Network Analysis Techniques
59
Performance Metrics
As stated above, other performance metrics can be determined using the intermediate results (i.e., the G(i) 1 ≤ i ≤ N terms or the right-most column of Table 3.1). These metrics are simply stated here for reference [Jai91]. Note that the queue length distributions do not apply to the terminal. Refer to [Buz73] for those calculations.
Queue Length Distributions The probability of having j or more customers at the ith node is p(n ≥ j) =
X n|ni ≤j
nM y1n1 y2n2 · · · yM G(N − j) = yij . G(N) G(N)
(3.84)
The probability of exactly j customers at the ith node is yij p(ni = j) = p(ni ≥ j) − p(ni ≥ j + 1) = [G(N − j) − yi G(N − j − 1)] . G(N)
(3.85)
The mean number of customers at the ith node is Qi =
N X j=1
p(ni ≥ j) =
N X j=1
yij
G(N − j) . G(N)
(3.86)
The joint probability of having j or more customers at the ith node and l or more customers at the kth node is p(ni ≥ j, nk ≥ l) = yij ykl
G(N − j − l) . G(N)
(3.87)
G(N − 1) . G(N)
(3.88)
Utilization Node utilizations are Ui = p(ni ≥ 1) = yi
Rusty O. Baldwin
Chapter 3. Analytic Network Analysis Techniques
60
System Throughput The network throughput is given by X=α
3.3
G(N − 1) . G(N)
(3.89)
Analysis Methods
In this section, particular analysis methods are discussed. The methods have been divided arbitrarily into two types: exact and approximate. The terminology used to classify the analysis methods is not precise. Exact, in the sense used here, means a solution that is exact with respect to the assumptions. Whether the assumptions are reasonable and/or whether the model accurately corresponds to any realizable network is not addressed. Approximate means that the solution, more or less, corresponds to what occurs in a (presumably) more accurate model of a network. It would be na¨ıve to assume that “exact” analysis methods are “better” than approximations. Which is better or worse depends largely on the purpose for modeling the network in the first place and how much time is available to obtain an answer.
3.3.1
Exact Analysis Models
3.3.1.1
Jackson Networks
A Jackson network [Jac57], [Jac63] consists of M nodes that satisfy the following conditions [All90]. (1) Each node consists of ci identical exponential servers where the service rate of the ith node is µi .
Rusty O. Baldwin
Chapter 3. Analytic Network Analysis Techniques
61
(2) Customers arrive from outside the system to the ith node according to a Poisson process with rate si . Customers may also arrive from other nodes within the network. (3) Customers from node i are routed to node j with probability rij or leave the network with probability 1 −
M P
rij .
j=1
The arrival rate, λi , to each node i from all sources (external and internal) is λi = si +
M X
rji λj .
(3.90)
j=1
For a given network, there will be M arrival rate equations for the network with M unknowns. These M equations form a linear system that can be solved if and only if every customer eventually leaves the network. For networks that satisfy the above conditions, Jackson proved that nodes can be treated as if they were independent M/M/ci queues with arrival rate λi and service rate µi . If the service rate exceeds the arrival rate for all nodes in the network (to preserve stability), then p(n) = p1 (n1 )p2 (n2 ) · · · pM (nM )
(3.91)
where p(n) is the probability of the network being in state n and pi (ni ) is the probability that there are ni customers at node i treating it as an M/M/c queue. The probability an M/M/c queue with traffic intensity ρ contains ni customers is
ni
q0 (cρ) , ni !
ni ≤ c
p(ni ) =
(3.92) n
c
q0 ρ c!i c ,
ni ≥ c
where q0 =
ρ =
" c−1 X
(cρ)k (cρ)c + k! c!(1 − ρ) k=0
λ . cµ
#−1
Rusty O. Baldwin
Chapter 3. Analytic Network Analysis Techniques
62
Node 2 '$ S2
r20 2 1 � r12��� &% � @ � � @ � � @ r23 r33 �r21 � @ � � A � � @ '$ �� '$ � AU � � R @ ) �
µ
S1 -
r13
µ1
r30 -
µ3
-
&%
&%
Node 1
Node 3
Figure 3.7: Open Jackson Network, M = 3 Jackson’s results were later extended to include closed networks [GN67]. An astute reader will recognize that the network examples used in the previous sections were closed Jackson networks. Figure 3.7 shows an open Jackson network with single server nodes, which we will analyze to find the network equilibrium probabilities. Suppose the arrival and service parameters for the nodes and the routing probabilities for the network (where Node 0 is outside the network) are s1 = 2
s2 = 3
µ1 = 3
r12 = 0.5 r13 = 0.5
µ2 = 5
µ3 = 3
r20 = 0.7 r21 = 0.1 r23 = 0.2
(3.93)
r30 = 0.9 r33 = 0.1. Using (3.90), the arrival rate equation for each node is λ1 = s1 +
3 X
rj1 λj = 2.0 + 0.1λ2
(3.94)
rj2 λj = 3.0 + 0.5λ1
(3.95)
rj3 λj = 0.5λ1 + 0.2λ2 + 0.1λ3 .
(3.96)
j=1
λ2 = s2 +
3 X j=1
λ3 = s3 +
3 X j=1
Rusty O. Baldwin
Chapter 3. Analytic Network Analysis Techniques
63
Solving these equations yields λ1 = 2.42, λ2 = 4.21, λ3 = 2.28. Equation (3.92) simplifies to the following for the ith node with a single server (i.e., an M/M/1 queue) pi (ni ) = (1 − ρi )ρni i (3.97) ρi =
λi . µi
Thus, by using (3.91) and (3.97) the equilibrium probability for any network configuration can be determined. The equations for the network in Figure 3.7 are p1 (n1 ) = 0.19(0.81n1 )
(3.98)
p2 (n2 ) = 0.158(0.842n2 )
(3.99)
p3 (n3 ) = 0.24(0.76n3 ).
3.3.1.2
(3.100)
BCMP Networks
BCMP networks can be used to analyze open, closed, or mixed networks where customers may require different classes of service. In [BCMP75], Jackson networks are extended to allow different customer classes, different service requirements, and service distributions other than exponential. Furthermore, customers can change classes after receiving service. Four different types of service centers (nodes) are defined [BCMP75]. (1) In a Type 1 service center, all customers have the same service distribution (exponential), and are served on a first-come-first-served (FCFS) basis. The service rate can be dependent on the number of customers at the node. (2) A Type 2 service center is a processor sharing service center. Each customer receives an equal share of the processor time. Each class of customer may have a distinct service distribution which must have a rational Laplace transform (e.g., exponential, hyper-exponential, hypo-exponential). This generally means that the service time distributions are represented by stages of exponential servers [All90].
Rusty O. Baldwin
Chapter 3. Analytic Network Analysis Techniques
64
(3) In a Type 3 service center, the number of servers always exceeds the number of customers; therefore, a customer always begins service immediately. Each class of customer may have a different service distribution, which must have a rational Laplace transform. (4) In a Type 4 service center, there is a single server and the service discipline is lastcome-first-served (LCFS) with preempt-resume (i.e., the preempted customer will be the next one served). As before, each class of customer may have a different service distribution, which must have a rational Laplace transform. The general probability equilibrium equation for a BCMP network is p(n) = cd(n)f1 (x1 )f2(x2 ) · · · fM (xM )
(3.101)
where c is a normalizing constant, d(n) is an arrival rate function dependent on the number of customers in the system, and fi (xi ) is a function for the ith node that has condition xi . The terms fi and xi in the equations above are defined differently for different types of service centers and networks. Before giving those definitions, we introduce the terms that appear in the definitions. Customers travel through the network and change classes according to transition probabilities. A customer of class a that leaves node i will go to node j as a class b customer with probability ri,a;j,b . These probabilities can be formed into a transition matrix R = [ri,a;j,b]. This can be considered as the one-step transition matrix for a Markov chain with states (i, a) where i represents the customer’s next state and a represents the customer’s next class. This Markov chain is assumed to be reducible into l ergodic subchains. The states contained in these subchains are represented by the sets E1 , E2 , . . . , El . For each set of these ergodic subchains, Ek , there is an arrival equation defined which is similar to the arrival equation (3.90) except that it is extended to distinguish between arrivals of different classes of customers. The arrival rate to node j of a customer of class b, λjb , is λjb = sjb +
X (i,a)∈El
ri,a;j,b λia ,
∀(j, b) ∈ Ek
(3.102)
Rusty O. Baldwin
Chapter 3. Analytic Network Analysis Techniques
65
Node 2 (Type 1) '$
S21
r2,1;0,12 1 r1,1;2,1��� &% �� @ � � @ r2,1;3,1 � � r3,1;3,1 @ r 2,1;1,1 � � @ � �A �� @ '$ �� '$ � AU � � R @ ) � S11r1,1;3,1 r3,1;0,1S12r r3,2;0,21,2;3,2 1 3 &% &%
µ
µ
µ
Node 1
Node 3
(Type 1)
(Type 2)
Figure 3.8: BCMP Network where sjb is the external arrival rate of class b customers to node j, ri,a;j,b is the probability that a customer of class a that leaves node i will go to node j as a class b customer, λia is the arrival rate to node i of a customer of class a, and (i, a) and (j, b) are states within the subchain Ek . As an example, consider the network shown in Figure 3.8 which is the same network as Figure 3.7, but includes customers of different classes, 1 and 2. Suppose the arrival and service parameters for the nodes and the routing probabilities for the network (where Node 0 is outside the network) are s11 = 2.0
s12 = 1.0
s21 = 3.0
µ1 = 4.0
µ2 = 6.0
µ3 = 4.0
r1,1;2,1 = 0.5 r1,1;3,1 = 0.5 r1,2;3,2 = 1.0
(3.103)
r2,1;0,1 = 0.7 r2,1;3,1 = 0.2 r2,1;1,1 = 0.1 r3,1;0,1 = 0.9 r3,1;3,1 = 0.1 r3,2;0,2 = 1.0. The transition matrix for the network is shown in Table 3.3. The subchain sets for this network are E1 = {(0, 1), (1, 1), (2, 1), (3, 1)} and E2 = {(0, 2), (1, 2), (3, 2)}. Constructing the arrival rate equations for E1 and E2 using (3.102) we have λ01 = s11 + s21
(3.104)
Rusty O. Baldwin
Chapter 3. Analytic Network Analysis Techniques
66
Table 3.3: BCMP Network Transition Matrix Next ⇒ Current ⇓ (0,1)
(0,2)
(1,1)
(1,2)
(2,1)
(3,1)
(3,2)
(0,1)
0.0
0.0
0.4
0.0
0.6
0.0
0.0
(0,2)
0.0
0.0
0.0
1.0
0.0
0.0
0.0
(1,1)
0.0
0.0
0.0
0.0
0.5
0.5
0.0
(1,2)
0.0
0.0
0.0
0.0
0.0
0.0
1.0
(2,1)
0.7
0.0
0.1
0.0
0.0
0.2
0.0
(3,1)
0.9
0.0
0.0
0.0
0.0
0.1
0.0
(3,2)
0.0
1.0
0.0
0.0
0.0
0.0
0.0
λ11 = s11 + r1,1;1,1λ11 + r2,1;1,1λ21 + r3,1;1,1λ31
(3.105)
λ21 = s21 + r1,1;2,1λ11 + r2,1;2,1λ21 + r3,1;2,1λ31
(3.106)
λ31 = s31 + r1,1;3,1λ11 + r2,1;3,1λ21 + r3,1;3,1λ31
(3.107)
λ02 = s12
(3.108)
λ12 = s12 + r1,2;1,2λ12 + r2,1;1,2λ32
(3.109)
λ32 = s32 + r1,2;3,2λ12 + r3,2;3,2λ32 .
(3.110)
Substituting the known values into these equations results in λ01 = 2.0 + 3.0
(3.111)
λ11 = 2.0 + 0.1λ21
(3.112)
λ21 = 3.0 + 0.5λ11
(3.113)
λ31 = 0.5λ11 + 0.2λ21 + 0.1λ31
(3.114)
λ02 = 1.0
(3.115)
λ12 = 1.0
(3.116)
λ32 = λ12 .
(3.117)
Solving these equations yields λ01 = 5.0, λ02 = 1.0, λ11 = 2.42, λ21 = 4.21, λ31 = 2.28, λ12 =
Rusty O. Baldwin
Chapter 3. Analytic Network Analysis Techniques
67
1.0, λ32 = 1.0. Now we define the terms of (3.101). For completeness, we describe the network state in general and then introduce a simpler form that works in most cases. The state of the network is n = (x1 , x2, · · · , xM ). The term xi has the following definitions depending on the service center type.
(1) Type 1: xi = (xi1, xi2 , . . . , xini ) where ni is the number of customers at node i and xij
(1 ≤ j ≤ ni , 1 ≤ xij ≤ Q) is the class of customer who is jth in the FCFS order,
and Q is the number of customer classes. An example of a Type 1 node, xi (for Q = 4), is xi = (1, 2, 1, 3, 1, 1). In this example, the first customer (i.e., the left-most) is a class 1 customer and is currently receiving service. There are ni = 6 customers at the node; 4 class 1, 1 class 2, 1 class 3, and no class 4. The next customer to receive service will be the class 2 customer. (2) Type 2 or 3: xi = (vi1, vi2 , . . . , viQ) where viq is a vector (m1q , m2q , . . . , muiq q ). The lth component of viq , mlq , is the number of customers of class q at node i in the lth stage of service. The uiq term is the number of stages for a class q customer at node i. An example of a Type 2 or 3 node, xi (for Q = 2, ui1 = ui2 = 2), is xi = ((0, 1), (1, 2)). In this example, there is 1 class 1 customer in the second stage of service and 3 class 2 customers; one in the first stage of service and two in the second stage of service. There are ni = 4 customers at the node. (3) Type 4: xi = ((r1, m1 ), (r2, m2), . . . , (rni , mni )) where ni is the number of customers at node i in LCFS order and (rj , mj ) is a pair describing the jth customer at the queue. The rj term is the class of the customer and mj is the stage of service. An example of a Type 4 node, xi (for Q = 2, ui1 = ui2 = 2 as in the Type 2 and 3 example), is xi = ((1, 1), (1, 2)). In this example, there is 1 class 1 customers in the first stage of service and 1 class 1 customer in the second stage of service. There are ni = 2 customers at the node.
Rusty O. Baldwin
Chapter 3. Analytic Network Analysis Techniques
68
While these definitions of xi are the most complete, usually a simpler state description will suffice, namely n = (y1, y2 , . . . , yM )
(3.118)
where yi = (ni1 , ni2 , . . . , niQ ) and niq is the number of customers of class q at node i. Readers that need to use the fuller state description should consult [BCMP75]. This simpler state description results in an equilibrium state probability equation p(n) = cd(n)g1 (y1)g2 (y2 ) · · · gM (yM ). For a Type 1 node, gi is
n
(3.119)
Q λiqiq ni ! Y gi (yi ) = ni µi q=1 niq !
(3.120)
where ni is the number of customers at node i, µi is the service rate at node i, niq is the number of customers of class q at node i, and λiq is the arrival rate of class q customers to node i. If the node is a Type 2 or 4 node, then n
Q Y
λiqiq g(yi ) = ni ! niq q=1 µiq niq !
(3.121)
where ni is the number of customers at node i, µiq is the service rate at node i for customer class q, niq is the number of customers of class q at node i, and λiq is the arrival rate of class q customers to node i. If the node is a Type 3 node, then Q Y
n
λiqiq g(yi ) = niq q=1 µiq niq !
(3.122)
where µiq is the service rate at node i for customer class q, niq is the number of customers of class q at node i, and λiq is the arrival rate of class q customers to node i. The term d(n) has two definitions depending on the type of arrivals and whether the network is closed. If the arrivals to the network are Poisson and depend on the total number of customers in the network, N, and the arrivals to nodes of different customer classes have fixed probabilities then d(n) =
NY −1 i=0
λ(i)
(3.123)
Rusty O. Baldwin
Chapter 3. Analytic Network Analysis Techniques
69
where λ(i) is the mean arrival rate at node i. If the arrivals to the network consist of l Poisson streams corresponding to the l subchains described above, E1 , E2 , . . . , El , nE −1
d(n) =
j l Y Y
j=1
λj (i)
(3.124)
i=0
where l is the number of subchains, nEj is the number of customers in the jth subchain, and λj is the mean arrival rate of the jth subchain. If the network is closed d(n) = 1.
(3.125)
As an example, we solve the network shown in Figure 3.8 for a particular network state to within the normalization constant c. The normalization constant for an open BCMP network generally does not have a closed form solution and must be determined numerically [RTW94]. The particular system state we solve for is described by (3.118) and is n = ((1, 1), (2, 0), (1, 1))
(3.126)
which states that there is one customer of class 1 and 2 at node 1, two customers of class 1 at node 2, and one customer of class 1 and 2 at node 3. Substituting in the network parameters of (3.103) and the solutions to (3.111)–(3.117) into (3.120) for Type 1 nodes and (3.121) for Type 2 nodes "�
� �
� #
2! 2.42 1 1 1 g1 ((1, 1)) = 2 = 0.3025 4 1! 1! "� � � � # 2! 4.21 2 0 0 = 0.4923 g2 ((2, 0)) = 2 6 2! 0! "� � � � � � � �1 # 1 2.28 1 1 1 g3 ((1, 1)) = 2! = 1.140. 1! 2 1! 2
(3.127) (3.128) (3.129)
Using (3.123) yields d(n) =
6−1 Y
6 = 66 = 46, 656.
(3.130)
i=0
Combining (3.127)–(3.129) yields the equilibrium probability p((1, 1), (2, 0), (1, 1)) = c(46, 656)(0.3025)(0.4923)(1.140) = 7.92c.
(3.131)
Rusty O. Baldwin
Chapter 3. Analytic Network Analysis Techniques
70
A closed form for c exists for the equilibrium probability that a node will have a given number of customers, irrespective of their class. For Type 1, 2, and 4 nodes, the equilibrium probability that a node will have a given number of customers is pi (ni ) = (1 − ρi )ρni i or for a Type 3 node pi (ni ) = e−ρi where for Type 1 nodes ρi = or for Type 2, 3, and 4 nodes ρi =
ρni i ni!
(3.132)
!
X
λiq q∈Qi µi X
λiq . q∈Qi µiq
(3.133)
(3.134)
(3.135)
where Qi = {q : class q customers that may require service at node i}. For this special case, (3.132) is similar to the Jackson network solution, (3.97), which corresponds to an M/M/1 queue. Similarly, (3.133) can be recognized as the equilibrium solution for the number of customers in an M/G/∞ queue.
3.3.2
Approximate Analysis Methods
3.3.2.1
Mean Value Analysis
Closed Networks The first approximation technique we examine is mean value analysis (MVA) for closed networks [Jai91]. MVA is an algorithm based on the observation [Sch79], [RL80] that for nodes that have an exponentially distributed service time, the average response time, ri , for the ith node as seen by an arriving customer is ri (N) = µ−1 i (1 + Qi (N − 1))
(3.136)
Rusty O. Baldwin
Chapter 3. Analytic Network Analysis Techniques
71
is the mean where ri (N) is the response of the ith node when the network has N jobs, µ−1 i service time of the ith node, and Qi (N − 1) is the average number of jobs at the ith node when the network has N − 1 jobs in it. The arriving job sees Qi (N − 1) jobs ahead of it; therefore, it will take µ−1 i Qi (N − 1) seconds before it will receive service. By including the arriving job’s service time, we have (3.136). Taking advantage of a set of relationships known as operational laws [Buz76] (i.e., assumptions that can be demonstrated by testing), we can recursively determine ri (N) for any number of jobs. These operational laws are r(N) =
M X
viri (N)
(3.137)
i=1
where r(N) is the network response time, vi is the number of visits to the ith node, M is the number of nodes in the network, and ri (N) is defined by (3.136). Network throughput is X(N) =
N r(N) + z
(3.138)
where r(N) is defined by (3.137) and z is the customer “think time” (cf., Section 3.2.7.2). The response time for a delay center (since all jobs receive immediate service) is ri (N) = µ−1 i .
(3.139)
Xi (N) = X(N)vi .
(3.140)
Individual node throughputs are
The node queue lengths with N jobs in the network are Qi (N) = Xi (N)ri (N) = X(N)vi ri (N).
(3.141)
Ui = X(N)µ−1 i vi .
(3.142)
Node utilizations are
Using (3.136)–(3.138) and (3.141) we can find performance parameters for a closed system with any number of jobs.
Rusty O. Baldwin
Chapter 3. Analytic Network Analysis Techniques
72
Let us use the network of Figure 3.3 and compare the results obtained by using the convolution algorithm (Section 3.2.7.2) and MVA. Setting µ1 = 2, µ2 = 3 and using Table 3.2, we find that the values for the normalization constants using the convolution algorithm are G(0) = 1, G(1) =
180 , 216
G(2) =
114 , 216
G(3) =
65 . 216
Using (3.86), (3.88), and (3.89) we find that
Q1 = 1.99, Q2 = 1.02, U1 = 0.88, U2 = 0.58, and X = 1.75. Applying the MVA equations (3.136)–(3.141) iteratively results in the values contained in Table 3.4. Using the values in the right-most column of Table 3.4 and (3.142), we find that the MVA values are Q1 = 2.0, Q2 = 1.03, U1 = 0.71, U2 = 0.47, and X = 1.42. These compare reasonably well with those obtained using the convolution algorithm.
Open Networks MVA also applies to open networks. The equations are similar, but do not require iterative application as in a closed network. The open network MVA equations are stated below. The average response time, ri , for the ith node as seen by an arriving customer is
ri =
µ−1 i , 1−Ui
Ordinary node, (3.143)
µ−1 ,
Delay centers
where ri is the response of the ith node, µ−1 is the mean service time of the ith node, and i Ui is the utilization of ith node. The system response time is r=
M X
viri
(3.144)
i=1
where vi is the number of visits to the ith node, M is the number of nodes in the network, and ri is defined by (3.143). Network throughput is (assuming equilibrium) simply X=λ
(3.145)
where λ is the job arrival rate. Individual node throughputs are Xi = Xvi .
(3.146)
Rusty O. Baldwin
Chapter 3. Analytic Network Analysis Techniques
Table 3.4: MVA Algorithm N⇒
0
1
2
3
r1(N) (3.136)
—
1 2
14 10
67 50
r2(N) (3.136)
—
1 3
11 15
58 75
r1(N) (3.137)
—
5 6
32 15
317 150
r1(N) (3.138)
—
18 5
45 32
450 317
r1(N) (3.141)
0
9 5
42 25
64 32
r1(N) (3.141)
0
6 5
33 25
33 32
73
Rusty O. Baldwin
Chapter 3. Analytic Network Analysis Techniques
74
Node utilizations are Ui = Xµ−1 i vi .
(3.147)
Ui . 1 − Ui
(3.148)
The node queue lengths are Qi =
In this discussion, we focused on MVA as it applies to fixed-capacity nodes (i.e., nodes where the service rate is independent of the number of jobs). In fact, MVA can be used to analyze more complex networks than those presented here. The interested reader should consult [Jai91].
3.3.2.2
Equilibrium Point Analysis
In Section 3.2.3, we mentioned the difficulty of analyzing discrete-time queues and, in Section 3.2.4, the difficulties introduced by interfering queues were discussed. In this section, we discuss an approximation technique called Equilibrium Point Analysis (EPA) which can be used to analyze these types of queueing networks. Although our discussion is limited to a rather simple packet radio network, this widely used technique can be applied to networks with bulk arrivals and service, discrete-time networks, networks with different customer classes, and local area networks such as Ethernet, token bus and token ring. The reader is encouraged to consult [Woo94] for details. This presentation of EPA is due to [Woo94]. As the name indicates, EPA is an approximation technique that applies only when the network is in equilibrium. This greatly simplifies the solution of the network since the network balance equations (c.f., Section 3.2.5) are not solved, but assumed. With EPA; however, we do not balance network state probabilities, we balance network customer flow, i.e., λi =
M X
λj rji ,
1≤i≤M
(3.149)
j=1
where λi is the mean arrival rate to the ith node, rji is the routing probability from node j to i, and M is the number of nodes in the system. We can write (3.149) in an equivalent
Rusty O. Baldwin
Chapter 3. Analytic Network Analysis Techniques
75
form by applying Little’s result (i.e., ni = λi µ−1 i ) to give E[ni ]µi =
M X
E[nj ]µj rji ,
1 ≤ i ≤ M.
(3.150)
j=1
The expected values, E[ni ], E[nj ], are then approximated by the point values, xi and xj , that solve the equations xi µi =
M X
xj µj rji ,
1 ≤ i ≤ M.
(3.151)
j=1
The equations formed by (3.151) are the equilibrium point equations. As with the other closed networks we have seen, one of the equations from (3.151) has a linear dependence and is replaced by M X
xi = N
(3.152)
i=1
where N is the number of customers in the network. Using (3.151) and (3.152), we have, as before, M independent equations that can be solved to obtain an equilibrium point xe = (xe1, xe2, . . . , xeM ).
(3.153)
This is done assuming that the state vector components are real-valued and not integers. The expected value of a network performance measure of interest, S(x), that is a function of x, is
Z
E[S(x)] =
S(x)δ(x − xe )dx = S(xe )
(3.154)
which states that mean values of performance measures can be approximated by their value at the equilibrium point. As an example, consider a slotted ALOHA packet radio network [Abr77] with a delayed first transmission. Figure 3.9 depicts a radio in the network. Each radio can be idle (Node 2) or waiting to transmit (Node 1). Time is slotted with state changes allowed only at set points in time. If the radio is idle (i.e., at Node 2), a packet can arrive during the time slot with probability σ. At the end of the time slot, the radio moves to Node 1 and is waiting to transmit. While at Node 1, the radio transmits during a time slot with probability p. If no other radios in the network transmit during that time slot, the transmission is successful and
Rusty O. Baldwin
Chapter 3. Analytic Network Analysis Techniques
76
Success ? '$ '$
2
σ
-
1
p
-
&% &% 6
Slotted ALOHA channel
-c
Collision
Figure 3.9: Slotted ALOHA Network the radio becomes idle (i.e., returns to Node 2). Otherwise, if two or more radios transmit during a time slot, there is a collision, the transmission is not successful and the radio remains waiting to transmit (i.e., at Node 1). The service rates of the nodes are µ1 = p, and µ2 = σ. The routing probability from Node 2 to Node 1 is r21 = 1. The routing probability r12 is the probability that only one customer at Node 1 attempts to depart or r12 = (1 − p)x1 −1 .
(3.155)
r11 = 1 − (1 − p)x1 −1 .
(3.156)
x = x1
(3.157)
Obviously r11 is
The system state is
since by knowing x1, we know x2 = N − x1 . Notice that (3.155) and (3.156) depend on the state of the system. This is an interfering queue as discussed in Section 3.2.4.
Rusty O. Baldwin
Chapter 3. Analytic Network Analysis Techniques
77
We apply EPA to this network by substituting in the service rates of the nodes and the routing probabilities, (3.155) and (3.156), into (3.151) to obtain x2σ = x1p(1 − p)x1 −1 .
(3.158)
Using (3.152), the second equation is x1 + x2 = N.
(3.159)
Solving (3.158) and (3.159) for x1, yields x1 =
N σp σ p
(3.160)
+ (1 − p)x1 −1
which is a fixed point equation of the form x1 = f(x1 ). These equations can be solved by using methods such as simple iteration or bisection [PFTV92]. The throughput of the network, given it is in state x1, is simply S(x1 ) = x1 p(1 − p)x1 −1 .
(3.161)
Using (3.154), the expected value of (3.161) is e
E[S(x1)] ≈ S(xe1 ) = xe1 p(1 − p)x1 .
(3.162)
Thus, the network in Figure 3.9 that could not be solved using exact network queueing analysis due to interfering queues is solved, quite simply, by an approximation.
3.4
Overview of Analysis Techniques
In this section, an overview of the analysis techniques discussed is presented. Recall that in most of the networks described, customers arrive according to a Poisson process and service times are exponentially distributed. An exception is BCMP networks in which customers arrivals and service time distributions that have rational Laplace transforms may also be analyzed.
Rusty O. Baldwin
Chapter 3. Analytic Network Analysis Techniques
78
Balance equations can be used to determine the probability of a network being in a given state for continuous-time networks that are either open or closed. Balance equations may also be used on reversible networks. The set of local balance and detailed balance equations may be easier to solve than the global balance equations. The solution to the local and detailed balance equations are also solutions to the global balance equations. Reversible networks may have a solution to the equilibrium state probability in a known canonical form. Often, reversibility is assumed and canonical forms are used to verify the assumption. Normalization constants can be used to determine many performance metrics of a network. Some of these metrics include queue length distributions, the probability of having a given number of customers at a node, node utilization, system throughput, and others. Jackson networks are used to determine the probability of a given network state. In a Jackson network each node is treated as if it were an independent M/M/c queue. Using BCMP networks, several different types of queues can be modeled. These include not only queues with Poisson arrivals and exponential service times but also queues in which: (1) the service rate can be dependent on the number of customers in the queue, (2) each customer receives an equal portion of the service time (processor sharing), (3) a customer always receives immediate service, and (4) the service discipline is last-comefirst-served. Additionally, BCMP networks support the analysis of networks with different customer classes and customers with service times that have rational Laplace transforms. Mean Value Analysis is an approximation technique that is based on the observation that the mean response time of a queue (the time until an arriving customer will receive service) is the mean service time times the number of customers ahead of the arriving customer. Using this simple observation, system response time, and node throughputs, utilizations, and queue lengths can be approximated. Equilibrium Point Analysis can be applied to discrete-time networks and networks with
Rusty O. Baldwin
Chapter 3. Analytic Network Analysis Techniques
79
interfering queues (cf., Section 3.2.4). EPA assumes rather than solves the balance equations discussed in Section 3.2.5. Some networks whose performance cannot be determined using the above techniques can be solved using EPA. Table 3.5 summarizes these analysis techniques and the networks that they may be applied to. The table is not a complete list of networks types that the analysis techniques can be applied to. For that information, the reader is encouraged to consult the supplied references for more detailed information.
3.5
Summary
The fundamental terms, concepts, and techniques of queueing network analysis have been presented. Terms used to classify queueing networks such as open, closed, and mixed were defined. The concepts of continuous-time, discrete-time, and interfering queues were presented and the impact of analyzing networks with these characteristics was discussed. We illustrated essential concepts such as balance (the conservation of customer flow) and reversibility (a network where state changes in forward or reversed time are statistically indistinguishable). We showed how balance equations can be used to determine the probability of a given network state. Several analytical analysis methods were discussed and their application and limitations demonstrated. These included “exact” analysis techniques including Jackson networks, and BCMP networks as well as approximations such as the Normalization Constant, Mean Value Analysis, and Equilibrium Point Analysis. We intended to present the essential concepts used in queueing network analysis without overwhelming the reader with technical details. Readers are encouraged to use the supplied references. These will enable the reader to apply queueing network analysis to more general classes of networks than could be covered here.
Rusty O. Baldwin
Chapter 3. Analytic Network Analysis Techniques
Table 3.5: Analysis Methods for Queueing Networks Network Type
Analysis Technique (Section) Global Balance Eqn. (3.2.5.1) Local Balance Eqn. (3.2.5.2) Detailed Balance Eqn. (3.2.5.3, 3.2.6.1) Canonical Form (3.2.6.2) Normalization Constant (3.2.7) Jackson Networks (3.3.1.1) BCMP (3.3.1.2) MVA (3.3.2.1) EPA (3.3.2.2)
Open or Open or Closed, Closed, ContinuousTime, ContinuousTime Reversible
× × × × × × × ×
× × × × × × × × ×
Open, Closed, or Mixed, Open, Continuous or DiscreteClosed, Time, or Mixed, Multi-Class ContinuousCustomers, Time, Interfering Multi-Class Queues Customers
× ×
×
80
Chapter 4 Objectives and Methodology This chapter presents the objectives and methodology used throughout this research. It is widely recognized that the research methodology employed can be as important as the capabilities of the researcher; therefore, the methodology must be carefully chosen. The research methodology used herein has been strongly influenced by [Jai91]. In that work, a systematic, ten-step approach to system performance evaluation is presented. The first eight steps (listed below), are discussed in this chapter. The other steps will be covered in the remaining chapters. 1. State goals and define system boundaries (Section 4.1) 2. List system services and possible outcomes (Section 4.2) 3. Select performance metrics (Section 4.3) 4. List system model parameters (Section 4.4) 5. Select factors (Section 4.5) 6. Select evaluation technique (Section 4.6) 7. Select workload (Section 4.7) 81
Rusty O. Baldwin
Chapter 4. Objectives and Methodology
82
8. Design experiments (Section 4.8) A summary of this chapter is presented in Section 4.9.
4.1
Problem Definition
Chapter 1 presented motivation for research into real-time data transport via wireless LANs. Chapters 2 and 3 discussed, among other things, some proposed methods for implementing real-time wireless LANs and difficulties experienced when analytically analyzing real-time systems. Generally, there have been two approaches used to reduce the inherent difficulty of analyzing the ability of a real-time system to meet deadlines. The first approach includes constraining the input to the system to a deterministic customer arrival rate, constraining the service times to a deterministic rate, and introducing restrictive assumptions about customer deadline characteristics. This type of approach is used in Rate Monotonic Analysis [KRPO93]. This approach, however, effectively limits a solution to those problems which can meet the (perhaps unrealistic) assumptions. In other words, the problem is forced to conform to the available solutions. The second typical approach has been to assume worst case arrival and service scenarios. This approach obviously results in underutilized systems and presumes that worst-case behavior can be determined. In this research, a less restrictive approach to specifying input and service characteristics is taken by using simulation to characterize and predict system behavior.
4.1.1
Research Thesis and Objectives
The thesis of this research is that the ability of an ad hoc packet data network to successfully transport real-time data will be dramatically improved by better utilization of channel capacity and by reducing packet collisions. The overall objectives of this research are to develop an ad hoc real-time wireless LAN
Rusty O. Baldwin
Chapter 4. Objectives and Methodology
83
that successfully delivers real-time data and to develop regression models of the real-time wireless LAN which accurately predicts the deadline performance of stations participating in the network. To meet these objectives, this research addresses the following specific areas. A new MAC protocol is developed (RT-MAC) which provides timely access to the wireless channel. This protocol uses the IEEE 802.11 MAC protocol as a point of departure. Modifications to the protocol include implementing a transmission control algorithm which prevents the transmission of packets that have (or will) exceed their deadline. A collision reduction algorithm dynamically alters the range of backoff values stations choose from as a function of the number of transmitting stations in the network. Also included in the collision reduction algorithm is the sharing of station backoff values with other stations in the network to reduce, via a distributed algorithm, packet collisions. Regression models are developed that predict the throughput, average delay, percentage of packet deadline failures, and percentage of packet collisions. The models incorporate the BER of the channel, the number of stations in the network, the offered load, as well as whether the network is using the IEEE 802.11 protocol or RT-MAC. Obviously, bit errors introduced by the channel will influence packet transmission times in the form of retransmissions. A two-state Markov model similar to the Gilbert model [Gil60] is used to introduce bursty bit errors into packets. In contrast to the well known Gilbert model where state transitions are “modulated” by packet transmissions (cf., Section 2.3.2), state transitions in the model used in this research are “modulated” by time. In real-time systems, the service discipline (or the order in which customers receive service) can have a dramatic effect on the ability of a system to meet deadlines. It has long been known [LL73] that in the context of processes running on a computer system, certain disciplines are optimal in meeting computational deadlines (e.g., earliest-deadline-first (EDF)). In application domains which permitted out of order packet delivery, several service disciplines were investigated to attempt to improve the deadline performance of the network. The focus and approach of this research is somewhat uncommon. It extends the existing body
Rusty O. Baldwin
Chapter 4. Objectives and Methodology
84
of knowledge within the real-time wireless network domain in several areas. To date, there have been no known attempts to improve, or even establish, the hard real-time transmission capabilities of IEEE 802.11. As was presented in Chapter 2, any modifications to the MAC protocol have been with the intent of improving data throughput or lowering mean delay. Incorporating channel induced bit errors into the performance analysis has seldom been done for real-time IEEE 802.11 systems—never in the context of hard real-time performance. In Chapter 2, it was shown that most research focused on the throughput of a network in the presence of collisions from other transmitting stations. In simulations, the probability of bit errors due to channel effects was either assumed to be virtually zero (as in wired channels) or constant. An exception to this was [CWKS96], which modeled bit errors using a Gilbert model [Gil60]. Finally, there have been no known regression models developed to predict the real-time performance of wireless computer networks. As was shown in Chapter 3, the real-time performance of networks with interfering queues cannot be determined analytically (other than average case behavior) given the current state of theoretic analysis of such networks. Computer networks have numerous parameters and can exist in numerous configurations. The following sections further define the network investigated by this research.
4.1.2
System Boundaries
The system considered in this research consists of an arbitrary number of stations networked together via a wireless LAN. This set of stations form (in IEEE 802.11 terminology) an independent basic service set (IBSS). The network operates independent of any other networks. That is, the network is not connected to a distribution system which could transport packets generated within the network beyond the transmission capacity of a station in the IBSS.
Rusty O. Baldwin 4.1.2.1
Chapter 4. Objectives and Methodology
85
Propagation Delay
Since stations in an IEEE 802.11 IBSS are necessarily situated close together, propagation delay is assumed to be zero with respect to packet transmission time.
4.1.2.2
Packet Length
The length of the packet can dramatically affect network performance. In real-time systems, it is advantageous to introduce predictability wherever practicable; therefore, fixed length packets are used to give the network a measure of predictability. The length of these packets is dependent on the application domain and is specified in Section 4.7.
4.1.2.3
MAC and Physical Layer Implementations
As stated in Chapter 1, adhering to standards offers the potential for low-cost implementations. It can also enhance acceptance in the marketplace. Therefore, the MAC protocol developed is compatible with IEEE 802.11. Further, the two protocols are interoperable. That is, they can co-exist within the same network. Although the physical layer implementation is assumed to be direct sequence spread spectrum (DSSS), this research does not depend on any physical layer attribute directly. Therefore, different physical layers can be used without any change in the MAC protocol (though some change in performance is to be expected).
4.2
System Services
Data communications by transmission of packets is the single service provided by the system. The class of service is guaranteed on-time delivery or hard deadlines. This class of service guarantees delivery of packets prior to the deadline of the packet expiring. There are three
Rusty O. Baldwin
Chapter 4. Objectives and Methodology
86
possible outcomes: delivery prior to packet deadline (success), delivery after packet deadline (failure), or no delivery (failure). Transmission of packets that have, or will certainly, miss their deadlines constitutes a double failure. One failure is the missed deadline itself, the other is the wasted channel capacity used to deliver an unusable packet. Therefore, when a station can detect that a packet will be delivered late prior to its transmission, that packet will be discarded and a failure recorded.
4.3 4.3.1
Performance Metrics Throughput
The most common system performance metric used when studying LANs is normalized throughput (the bits per second normalized to channel data rate). In this effort, however, throughput is of secondary importance. Since this research deals with real-time systems, the timeliness of the packet (i.e., the actual delivery time compared to the delivery deadline) is the critical performance measure. Throughput, however, is reported for purposes of comparison with other systems.
4.3.2
Mean Delay
Mean delay is another common performance metric. For the same reasons as throughput, mean delay is of secondary importance in this research but is reported for purposes of comparison with other systems.
Rusty O. Baldwin
4.3.3
Chapter 4. Objectives and Methodology
87
Missed Deadline Ratio
For guaranteed delivery service, the ratio of messages lost due to delivery failure is the primary performance metric. This is the number of packets that exceed their deadlines over the number of packets removed from the queue for transmission. A packet that is discarded (due to exceeding the transmission attempt count or due to the transmission control algorithm) is deemed to have exceeded its deadline.
4.3.4
Collision Ratio
To measure the effectiveness of the collision reduction algorithm, the packet collision ratio is tracked. This is the number of packet collisions over number of transmission attempts. Regardless of the number of packets involved in a collision, it is counted as a single collision. For example, if three stations transmit simultaneously, one collision is said to occur even though three packets are involved in the collision.
4.4
System Model Parameters
The following sections document the parameters in the network under consideration. The assumptions made about these parameters are intended to strike a balance between a system that has practical application and one that can be simulated in a reasonable amount of time.
4.4.1
Network Topology
The topology assumed for this effort is a bus. That is, every station in the network can receive the transmissions of every other station in the network. This assumption implies that the request to send/clear to send (RTS/CTS) capability of IEEE 802.11 will not be used.
Rusty O. Baldwin
4.4.2
Chapter 4. Objectives and Methodology
88
Capture
As explained in Chapter 2, capture is a technique whereby the receiving station may recover one signal from many that were transmitted, given sufficient signal strength and additional signal processing. In order to simplify the analysis and simulation, and reduce the number of parameters within the system that can be varied, stations in the network do not employ capture.
4.4.3
Power Considerations
IEEE 802.11 incorporates a power save (PS) mode whereby a station can “sleep” for a time in order to conserve power, then “wake up” at specified intervals to receive messages queued by other stations. This effort does not address any power saving features of IEEE 802.11. That is, a station never sleeps.
4.4.4
Wireless MAC Functions
As discussed in Section 2.2.3.1, the distributed coordination function (DCF) is used in the system model to access the transmission channel.
4.4.5
Number of Stations
The number of stations in a network can be a critical factor in network performance. The number of stations in the network under investigation varies from 2 to 80 depending on the application domain.
Rusty O. Baldwin
4.4.6
Chapter 4. Objectives and Methodology
89
Normalized Offered Load
Normalized offered load is the amount of traffic stations in a network generate for transmission relative to the maximum transmission capability of the network. The amount of traffic each station in the network offers to the network is equal, that is, the stations are homogeneous. The normalized offered load is the combined load offered by all the stations in the network.
4.4.7
Traffic Model
The characteristics of the arriving traffic have a significant influence on network performance. Different application domains are characterized by different traffic arrival patterns. The specific traffic models chosen for this effort are described below in Section 4.7.
4.4.8
Channel Model
The transmission channel is modeled as a dynamically changing environment. Errors occur in bursts and are introduced via a two-state model (described below in Section 4.5.3). In selected simulations, the effect of a static BER model on network performance is investigated.
4.4.9
MAC Protocol
The MAC protocol used in the network is either IEEE 802.11 or RT-MAC. RT-MAC is described fully in Chapter 5.
4.4.10
MAC Protocol Parameters
There are several important MAC protocol parameters. The minimum width of the contention window (cf., Section 2.2.3.1), CWmin, is 31. The maximum width of the contention
Rusty O. Baldwin
Chapter 4. Objectives and Methodology
90
window, CWmax, is 1023. The slot time is set to the default value for a DSSS system, 20µs. The short inter-frame space (SIFS) is set to 10µs, while the distributed IFS (DIFS) is calculated using other IEEE 802.11 parameters as defined in the standard. Also calculated using the definitions in IEEE 802.11 are the ACK length, PHY header length, and the value for the ACK timeout.
4.4.11
Physical Layer Parameters
The single significant physical layer parameter considered is the channel bit rate. For most simulations the 1 Mbps data rate is assumed. Selected simulation studies use bit rates up to 10 Mbps.
4.4.12
Other Parameters
There are numerous other parameters that are specified in IEEE 802.11 standard. Those that have been implemented in the simulation model are listed in Appendix A. Those not specifically mentioned above use the default values described in Appendix A.
4.5
System Factors
Factors are parameters that are varied during the simulation such that they significantly impact system performance when altered [Jai91]. Levels are the particular values that a factor can assume. The parameters discussed above that fit this criteria include the number of stations (N), normalized offered load (G), channel model (E), and the MAC protocol. A table with the factors and their levels can be found in Tables 4.1, 4.2 and 4.3.
Rusty O. Baldwin
Chapter 4. Objectives and Methodology
Table 4.1: Simulation Factors - Telemetry, Avionics Traffic Models Factor
Levels
Number of Stations (N)
5, 10, 20, 30, 40, 50
Offered Load (G)
0.3, 0.5, 0.7, 0.9
Channel Model (E)
ideal, bursty
MAC Protocol
IEEE 802.11, RT-MAC
Table 4.2: Simulation Factors - 1 Mbps Voice Traffic Model Factor
Levels
Number of Stations (N)
4, 10, 14, 20, 24, 30
Offered Load (G)
G = GRT + GN RT
GRT
0.0136N
GN RT
0.0, 0.2, 0.4, 0.6, 0.8
Channel Model (E)
ideal, bursty
MAC Protocol
IEEE 802.11, RT-MAC
Table 4.3: Simulation Factors - 10 Mbps Voice Traffic Model Factor
Levels
Number of Stations (N)
10, 20, 30, 40, 50, 60, 70, 80
Offered Load (G)
G = GRT + GN RT
GRT
0.00136N
GN RT
0.0, 0.2, 0.4, 0.6, 0.8
Channel Model (E)
ideal, bursty
MAC Protocol
IEEE 802.11, RT-MAC
91
Rusty O. Baldwin
4.5.1
Chapter 4. Objectives and Methodology
92
Number of Stations
An ad hoc network implies that the number of stations in the network can change arbitrarily. To determine the performance of this type of network, the levels of 5, 10, 20, 30, 40, and 50 stations were chosen for the telemetry and avionics traffic models. The levels of 4, 10, 14, 20, 24, and 30 were used for 1 Mbps voice traffic and 10, 20, 30, 40, 50, 60, 70, and 80 were used for 10 Mbps voice traffic.
4.5.2
Normalized Offered Load
The normalized offered load is the traffic generated by the stations in the network over the capacity of the channel. If the traffic generated by a network is 2 Mbps and the channel can transmit a maximum of 3 Mbps, the normalized offered load is 0.667. The normalized offered load used in this research was intended to range from a lightly loaded network to a heavily loaded network. For the telemetry and avionics traffic models (described below in Section 4.7) the levels used are 0.3, 0.5, 0.7, and 0.9. For the voice traffic model a mixture of real-time and non real-time traffic is generated by the stations. The real-time traffic offered to the network is a function of the number of stations in the network and is determined by the equation GRT = 0.0136 N where N is the number R of stations in the network, R is the channel data rate in Mbps, and 0.0136 is the fraction of the channel capacity used by a single station transmitting voice data (cf., Sections 2.3.1, 4.7). The non real-time traffic load levels, GN RT , are 0.0, 0.2, 0.4, 0.6, and 0.8. The total offered load, G, is simply G = GRT + GN RT . Note that this sometimes results in G > 1.0 for networks with large N.
Rusty O. Baldwin
4.5.3
Chapter 4. Objectives and Methodology
93
Channel Model
This effort used two levels for the channel model factor: bursty and ideal. As described in Section 2.3.2, the bursty error model is a two-state Markov model. In the “good” state (G), no bit errors occur. In the “bad” state (B), errors occur with a fixed probability, 1−h, where h is the probability of no bit error. The amount of time spent in each state is exponentially distributed with mean tG and tB for states G and B respectively. This research uses the parameter values used in [BBKT96], [BBKT97], [DRT97] where tG = 5.0 sec, tB = 0.1 sec, and h = 0.2. In the ideal channel, no bit errors ever occur. Since in the bursty error model state transitions are “time-modulated”, the actual BER varies depending on the offered load, G. A typical value for the BER is 2 × 10⁻² . This results in a packet error rate (PER) of between 1-5%. While this is quite high, recent proposals [Sak99] for evaluating errors induced by multipath effects suggest that a 10% PER should be used as rule of thumb for certain applications. In certain simulations, a static BER is employed. The value of the BER in the static channel model is 1 × 10⁻³ and 1 × 10⁻⁵ .
4.5.4
MAC Protocol
Two levels are used for the MAC protocol factor: IEEE 802.11 and RT-MAC. IEEE 802.11 is briefly described in Section 2.2.3 and completely described in [Edi97]. RT-MAC is described in Chapter 5.
4.6
Evaluation Technique
There are three techniques to evaluate performance: analytical modeling, simulation, and measurement [Jai91]. Chapter 3 surveys exact and approximate analytic techniques for evaluation of networks. It was not feasible to use this evaluation technique in this research since
Rusty O. Baldwin
Chapter 4. Objectives and Methodology
94
it could not provide the primary performance metric, the ratio of packet deadline failures. Since multiple stations share a common medium to transmit data, successful access to the medium in no longer independent of the other stations in the network—a key assumption for exact analysis in queuing networks. By using appropriate approximations, metrics such as mean throughput and delay can be determined, but metrics such as the ratio of packet deadline failures cannot. Direct measurement was prohibitively expensive given the desired number of stations in the network, so simulation was chosen as the only viable alternative. This research uses the simulation data collected to determine the performance of RT-MAC and to construct the regression models. The simulation implements a subset of capabilities specified in the full IEEE 802.11 implementation. It uses the System Description Language (SDL-92) [EHS97] description of IEEE 802.11 found in Appendix C of [Edi97] as a specification. Since this SDL description is normative for all IEEE 802.11 implementations, the simulation is a very accurate model of the behavior of an actual system. The simulation model, including its validation, is documented in Appendix A.
4.7
Traffic Models (Workload)
Three classes of traffic are investigated corresponding to three application domains: telemetry, avionics, and packetized voice. The telemetry traffic model is representative of the type of traffic that can be found on the MIL-STD-1553B data bus (cf., Section 2.3.1). The packet size is 83 bytes. Packets arrive at a constant periodic rate and packet deadlines are equal to the arrival period. That is, the packet must be delivered prior to the next packet arrival. The avionics traffic model is representative of the Boeing 777 data bus as described in [CDHC94]. The packet size is 775 bytes. Packets arrive according to a Poisson process (to approximate the 63 processes that periodically place packets on the bus). Packet deadlines are drawn from a truncated normal distribution with a mean of 380 ms. Deadlines have an upper bound of 1000 ms and a lower bound of 12 ms. In this class of traffic, a percentage
Rusty O. Baldwin
Chapter 4. Objectives and Methodology
95
of the packets that are discarded due to being late or due to a full transmission queue are assumed to still be useful to the receiving station. Therefore, 50% of the discarded packets are randomly chosen to be resubmitted to the transmission queue. The packetized voice traffic model uses an ON/OFF source to model speech (cf., Section 2.3.1). The time spent in the ON/OFF state is exponentially distributed with a mean of 1.00 seconds and 1.35 seconds respectively. In the ON state, the voice data is assumed to be encoded using the ITU G.726 encoding [Cox97]. Each packet contains 20 ms of speech at a 32 kbps rate or 80 bytes. The last packet in the ON state may be truncated if the time in the ON state is not a multiple of 20 ms. To investigate the effect of non-real-time traffic on the real-time voice traffic, various levels of background traffic are introduced into the network. The normalized offered load of the background traffic is 0.0, 0.2, 0.4, 0.6, and 0.8. Background traffic arrives according to a Pareto process (with parameter a = 1.6) to approximate self-similar interarrivals (cf., Section 2.3.1). Table 4.4 summarizes the three classes of traffic used in this effort.
4.8
Experimental Design
Since regression models are constructed using the simulation data gathered and further, since the power of today’s computers make it feasible, a full factorial experimental design was used for this research effort. In order to obtain a suitable confidence interval for the response variables, five replications of each combination of factors was chosen [Jai91], [Mac92]. For the factors and number of levels in the telemetry and avionics traffic models this resulted in a total of 480 simulation runs. For the 1 Mbps voice traffic model a total of 600 simulation runs were required. For the 10 Mbps voice traffic model a total of 900 simulation runs were required. The sections below describe the type of data collected and the termination criteria used for the simulation runs.
Rusty O. Baldwin
Model
Chapter 4. Objectives and Methodology
Factor
Table 4.4: Traffic Models Value
Telemetry Interarrival Distribution Deadline Distribution
Constant Constant (same as interarrival time)
Packet Size (bytes)
83
Discarded Packets Resubmitted 0% Avionics
Interarrival Distribution
Poisson
Deadline Distribution
Truncated Normal Mean = 380 ms, Min = 21 ms, Max = 1 sec
Packet Size (bytes)
775
Discarded Packets Resubmitted 50% Voice
Interarrival Distribution
ON/OFF (real-time) Pareto (non real-time)
Deadline Distribution
Constant (100 ms, real-time) None (non real-time)
Packet Size (bytes)
80 (real-time) 400 (non real-time)
Discarded Packets Resubmitted 0%
96
Rusty O. Baldwin
Chapter 4. Objectives and Methodology
97
************************************************************************************************************************************** =============================================SIMULATION TERMINATION CRITERIA (THROUGHPUT-ENABLED)===================================== [>AB< (>CD< Samples Req’d for Rqstd Wdth: >E< BER: >F< PER: >G< Conf. Int Wdth:
>H< Rqstd Wdth # (%): >I< (>JK< Current HRT Queue Size: >L< Current DATA Queue Size: >M
N< ======================================================================================================================================
=============================================SIMULATION TERMINATION CRITERIA (MEAN DELAY-ENABLED)===================================== [>AO< (>PQ< Samples Req’d for Rqstd Wdth: >R< Conf. Int Wdth: >S< Rqstd Wdth # (%): >T< (>UV< Pcnt Pkts Blckd at Q: >W< ======================================================================================================================================
=============================================SIMULATION TERMINATION CRITERIA (HRT FAILURES-ENABLED)=================================== [>AX< Failures (Trials): >Y< (>ZAA< Conf. Int Wdth: >BB< Rqstd Wdth # (%): >CC< (>DDEE< ======================================================================================================================================
=============================================SIMULATION TERMINATION CRITERIA (COLLISION-ENABLED)====================================== [>AFF< Collisions (Trials): >GG< (>HHII< Conf. Int Wdth: >JJ< Rqstd Wdth # (%): >KK< (>LLMM< ====================================================================================================================================== **************************************************************************************************************************************
Figure 4.1: Sample Simulation Output
4.8.1
Data Collected
In addition to the performance metrics described in Section 4.3, several other data items are collected during the simulation runs. Figure 4.1 shows a sample portion of a simulation output file. The confidence level used when calculating confidence intervals is 90%. The letter(s) surrounded by >< in Figure 4.1 (e.g., >A 0.3. Considered in isolation, the throughput of IEEE 802.11 would seem to indicate superior performance compared to RT-MAC. However, when packet deadlines are also considered, the opposite is indicated. For G > 0.3, virtually all the received IEEE 802.11 packets are late. Due to the transmission control algorithm of RT-MAC, none of the received packets are late. Hence, IEEE 802.11 throughput for G > 0.3 actually represents wasted capacity or a usable throughput of 0.0. Usable throughput, SU , is equal to the product of the throughput, S, and the failure ratio, F , or SU = S(1 − F ). A graph of usable throughput is shown in Figure 6.5 for an ideal channel. Similar results are obtained for a bursty channel. Therefore in terms of usable throughput, RT-MAC clearly outperforms IEEE 802.11 for G > 0.3.
Rusty O. Baldwin
Chapter 6. Simulation Results
111
0.34
0.33
0.32
0.31
0.30
Normalized Usable Throughput (S U )
5 Sta - 802.11
5 Sta - RT-MAC
0.27
10 Sta - 802.11
10 Sta - RT-MAC
20 Sta - 802.11
20 Sta - RT-MAC
30 Sta - 802.11
30 Sta - RT-MAC
0.28
40 Sta - 802.11
40 Sta - RT-MAC
50 Sta - 802.11
50 Sta - RT-MAC
0.29
0.9
0.7
0.5
0.3
Offered Load (G )
Figure 6.5: Usable Telemetry Throughput - Ideal Channel
6.1.2
Mean Delay
The mean delay of IEEE 802.11 and RT-MAC is shown in Figures 6.6 and 6.7. Mean delay is calculated as the arithmetic mean of the time difference from packet creation to successful reception of the last bit. Delay that discarded packets suffer do not contribute to mean delay since, in effect, their delay is infinite. For every network size considered in these simulations, IEEE 802.11 delay increases rapidly as G increases. It tends to stabilize at G ≥ 0.5. The magnitude of the maximum delay was quite large—1 to 10 seconds being typical. Due to the long delays, buffer overflow was common. The packet buffer size for this traffic model was 200 packets. Packets that arrived to a full buffer were discarded and counted as a missed deadline. The percentage of packets discarded due to a full buffer increased linearly with G with 0% being discarded at G = 0.3 and approximately 50% being discarded at G = 0.9. RT-MAC mean delay is inversely proportional to G. This is due to both the discarding
Rusty O. Baldwin
Chapter 6. Simulation Results
112
100
10
1 Delay (sec) (D ) Log scale
5 Sta - 802.11
10 Sta - 802.11
0.001 5 Sta - RT-MAC
10 Sta - RT-MAC
20 Sta - 802.11
30 Sta - 802.11
20 Sta - RT-MAC
0.01 30 Sta - RT-MAC
40 Sta - 802.11
50 Sta - 802.11
40 Sta - RT-MAC
50 Sta - RT-MAC
0.1
0.3
0.5
0.7
0.9
Offered Load (G )
Figure 6.6: Telemetry Mean Delay - Ideal Channel of late packets rather than transmitting them and due to the enhanced collision avoidance algorithm (cf., Chapter 5). Discarding late packets and avoiding collisions increases buffer throughput, and lowers the mean delay of packets that are transmitted. Since more and more packets are discarded as G increases (cf., Figure 6.8), the buffer throughput also increases and mean delay is decreased. No buffer overflow was experienced with RT-MAC. In terms of a statistical comparison, RT-MAC always performed better than IEEE 802.11 except in the case of N = 5 and 50, G = 0.3 for a bursty error channel, for which the performance was not different.
6.1.3
Missed Deadlines
Simulation results for missed deadlines are shown in Figures 6.8 and 6.9. The figures indicate that IEEE 802.11 is very susceptible to missed deadlines at even moderate loading. RT-MAC is more tolerant of network load and always performs dramatically better than IEEE 802.11.
Rusty O. Baldwin
Chapter 6. Simulation Results
113
100
10
1 Delay (sec) (D ) Log scale
5 Sta - 802.11
10 Sta - 802.11
0.001 5 Sta - RT-MAC
20 Sta - 802.11
10 Sta - RT-MAC
30 Sta - 802.11
0.01 20 Sta - RT-MAC
30 Sta - RT-MAC
50 Sta - RT-MAC 50 Sta - 802.11 40 Sta - RT-MAC 40 Sta - 802.11
0.1
0.3
0.5
0.7
0.9
Offered Load (G )
Figure 6.7: Telemetry Mean Delay - Bursty Error Channel Even so, at higher offered loads the missed deadline ratio is large and whether or not this is acceptable depends on the underlying application. Statistically, RT-MAC always performs better than IEEE 802.11. Consider the missed deadline ratio of IEEE 802.11 in Figure 6.8 for G = 0.3. As N increases from 5 to 10 stations, the missed deadline ratio decreases noticeably and does not appear to increase again until N = 50. That is, the missed deadline ratio for G = 0.3 is somewhat parabolic. This parabolic shape is shown in Figure 6.10. This presumably occurs because the packet deadline is equal to the interarrival time. To see why this is so, consider the mean interarrival time resulting from a given G in a network with N stations, a packet size of P bits, and a channel rate of C bps. The resulting mean interarrival time is T =
NP CG
seconds. As N decreases, the interarrival time decreases and
hence, the deadline decreases as well. The offered load however, remains constant. The net result is that as N decreases, a more stringent deadline requirement is presented to the stations for the same offered load.
30 Sta - 802.11
30 Sta - RT-MAC
20 Sta - 802.11
10 Sta - 802.11
10 Sta - RT-MAC
5 Sta - 802.11
40 Sta - RT-MAC
40 Sta - 802.11
20 Sta - RT-MAC
5 Sta - RT-MAC
50 Sta - RT-MAC 50 Sta - 802.11
40 Sta - RT-MAC
5 Sta - 802.11
5 Sta - RT-MAC
10 Sta - 802.11
10 Sta - RT-MAC
20 Sta - 802.11
20 Sta - RT-MAC
30 Sta - 802.11
30 Sta - RT-MAC
40 Sta - 802.11
0.5
0.4
0.3 0.5 0.7
0.6
0.5
0.4
0.5
0.7
Missed Deadline Ratio (F )
0.6
Missed Deadline Ratio (F )
50 Sta - RT-MAC 50 Sta - 802.11
Rusty O. Baldwin Chapter 6. Simulation Results 114
1.0
0.9
0.8
0.7
0.3
0.2
0.1
0.9 0.0
Offered Load (G )
Figure 6.8: Telemetry Missed Deadline Ratio - Ideal Channel
1.0
0.9
0.8
0.7
0.3
0.2
0.1
0.9
0.0
0.3
Offered Load (G )
Figure 6.9: Telemetry Missed Deadline Ratio - Bursty Error Channel
Rusty O. Baldwin
Chapter 6. Simulation Results
115
0.1 IEEE 802.11
Missed Deadline Ratio (F )
0.08
RT-MAC
0.06
0.04
0.02
G = 0.3
0 10
20
30 Stations (N )
40
50
Figure 6.10: Telemetry Missed Deadline Ratio (5-50 Stations) - Ideal Channel To confirm this hypothesis, simulations were run for networks with N = 2 and N = 4. The simulation results should show larger missed deadline ratios for networks with fewer stations. As Figure 6.11 shows, this is indeed the case. By inspecting Table B.5 in Appendix B, it can be seen that this also occurs for every G when using RT-MAC. For IEEE 802.11 with G > 0.3, the effect is masked since the missed deadline ratio is always 1.0 due to other factors.
6.1.4
Collisions
IEEE 802.11 and RT-MAC collision ratios are shown in Figures 6.12 and 6.13. As with IEEE 802.11 mean delay and missed deadline ratio, the collision ratio, C, increases rapidly with G and reaches a local maximum at G = 0.5. As G increases further the collision ratio tends to stay relatively constant. As N increases, the starting value and the maximum value of the collision ratio increase as well. Hence, IEEE 802.11 collisions are highly influenced by both G and N.
Rusty O. Baldwin
Chapter 6. Simulation Results
116
0.25 IEEE 802.11 RT-MAC
Missed Deadline Ratio (F )
0.2
0.15
0.1
0.05 G = 0.3 0 10
20
30
40
50
Stations (N )
Figure 6.11: Telemetry Missed Deadline Ratio (2-50 Stations) - Ideal Channel In contrast, RT-MAC collision ratio is very stable. Compared to IEEE 802.11, it is only slightly influenced by either G or N. Using N = 20 as an example, as G increases, RT-MAC collision ratio increases from about 0.033 to 0.037—an increase of about 12%. Over the same range the IEEE 802.11 collision ratio increases from about 0.148 to 0.256—an increase of over 72%. The RT-MAC enhanced collision avoidance scheme (cf., Section 5.2), therefore, is very effective in reducing network collisions. Statistically, RT-MAC always performs better than IEEE 802.11.
6.1.5
Bursty Error Channel
While the bursty error channel did have a detectable effect on the above performance metrics, it is noteworthy that its impact was not very large. The average BER varied from about 1 × 10⁻² to 4 × 10⁻² —poor by any standard. This lack of impact (especially at higher loads) is further confirmed by the regression models discussed later in Chapter 7. When the channel model factor (ideal or bursty) was included in a regression model, it was found to be
0.3
0.5
Offered Load (G )
0.7
0.9
0.00
0.05
0.10
0.30
0.25
0.20
0.15
Collision Ratio (C )
50 Sta - RT-MAC
0.35
50 Sta - RT-MAC
0.40
50 Sta - 802.11
Figure 6.12: Telemetry Collision Ratio - Ideal Channel
50 Sta - 802.11
40 Sta - RT-MAC
40 Sta - 802.11
30 Sta - RT-MAC
0.10
40 Sta - RT-MAC
40 Sta - 802.11
30 Sta - RT-MAC
30 Sta - 802.11
20 Sta - RT-MAC
20 Sta - 802.11
0.05
30 Sta - 802.11
20 Sta - RT-MAC
20 Sta - 802.11
10 Sta - RT-MAC
0.00
10 Sta - RT-MAC
10 Sta - 802.11
0.3
10 Sta - 802.11
0.9
5 Sta - RT-MAC
0.5
5 Sta - RT-MAC
Offered Load (G )
5 Sta - 802.11
0.7
5 Sta - 802.11
Collision Ratio (C )
Rusty O. Baldwin Chapter 6. Simulation Results 117
0.40
0.35
0.30
0.25
0.20
0.15
Figure 6.13: Telemetry Collision Ratio - Bursty Error Channel
Rusty O. Baldwin
Chapter 6. Simulation Results
118
statistically significant but of limited impact to the overall model. This is most probably due to the effects of other factors such as collisions and since the amount of time the channel was in a “bad” state was small compared to the “good” state (cf., Section 4.5.3). To help confirm this, the effect of a static BER on the performance metrics is examined in Section 6.4.5.
6.2
Avionics Traffic Model
The avionics traffic model parameters are discussed in Section 4.7 and summarized in Table 4.4. The avionics traffic model is characterized by fixed-length packets (775 bytes), and by more than 60 processes that access the channel with various constant packet interarrival times. These interarrival times are approximated by using a Poisson process for packet arrivals. Packets deadlines are drawn from a truncated normal distribution with a mean of 380 ms. This traffic model is serves as a representative traffic model for an avionics bus. The packet size is moderate and the deadlines are not as stringent as the telemetry traffic model.
6.2.1
Normalized Throughput
For N = 5 and 10, IEEE 802.11 throughput (Figures 6.14 and 6.15) tends to monotonically increase to a maximum value as G increases. For N > 10, the throughput increases to a local maximum at G = 0.7 and then decreases for G > 0.7. This decrease can be attributed to an increase in the number of packet collisions (cf., Figure 6.27 and 6.28). In contrast, RT-MAC throughput for all N monotonically increases with G.
6.2.1.1
Throughput Performance Summary
A summary of the performance of RT-MAC versus IEEE 802.11 throughput is given in Figures 6.16 and 6.17 for the ideal and bursty error channels respectively. As before, unless
5 Sta - 802.11
5 Sta - RT-MAC
10 Sta - 802.11
10 Sta - RT-MAC
20 Sta - 802.11
20 Sta - RT-MAC
30 Sta - 802.11
30 Sta - RT-MAC
40 Sta - 802.11
40 Sta - RT-MAC
50 Sta - 802.11
50 Sta - RT-MAC
5 Sta - 802.11
5 Sta - RT-MAC
10 Sta - 802.11
10 Sta - RT-MAC
20 Sta - 802.11
20 Sta - RT-MAC
30 Sta - 802.11
30 Sta - RT-MAC
40 Sta - 802.11
40 Sta - RT-MAC
50 Sta - 802.11
50 Sta - RT-MAC
Rusty O. Baldwin Chapter 6. Simulation Results
0.60
0.3
0.3 0.5
0.5
0.7
0.60
0.7
119
0.90
0.80
0.70
Normalized Throughput (S )
0.50
0.40
0.30 0.9
Offered Load (G )
Figure 6.14: Avionics Throughput - Ideal Channel
0.90
0.80
0.70
Normalized Throughput (S )
0.50
0.40
0.9
0.30
Offered Load (G )
Figure 6.15: Avionics Throughput - Bursty Error Channel
Rusty O. Baldwin
0.9
Chapter 6. Simulation Results
B
B
B
B
B
B
120
Legend With respect to IEEE 802.11
Offered Load 0.7 (G) 0.5
N
N
N
N
B
B
N
N
N
N
N
N
0.3
N
N
N
N
N
N
5
10
20
30
40
50
B N W *
Better Not Different Worse Determined by t-test
Stations (N)
Figure 6.16: Avionics Throughput Performance Comparison - Ideal Channel otherwise noted, the level of significance used is 0.1. The region in the figures demarcated by thick lines is where RT-MAC performance is statistically better than IEEE 802.11.
6.2.1.2
Usable Throughput
The raw throughput of IEEE 802.11 and RT-MAC is similar for G ≤ 0.7. However, as with the telemetry traffic model, when packet deadlines are also considered, a different result is indicated. For G > 0.7, N ≤ 20 and G > 0.5, N > 20, IEEE 802.11 throughput represents wasted capacity or a usable throughput, SU , that rapidly approaches 0.0. Recall that SU = S(1−F ). Usable throughput is shown in Figure 6.18 for the ideal channel. Similar results are obtained for the bursty channel. In terms of throughput that can be used by the receiver, RT-MAC outperforms IEEE 802.11 for medium to high network loads.
6.2.2
Mean Delay
The mean delay of IEEE 802.11 and RT-MAC is shown in Figures 6.19 and 6.20. Mean delay is calculated in the same manner as described in the telemetry traffic model above.
Rusty O. Baldwin
Chapter 6. Simulation Results
B
0.9
B
B
B
B
B
121
Legend With respect to IEEE 802.11
Offered Load 0.7 (G) 0.5
N
W*
N
B
B
B
N
N
N
N
N
N
0.3
N
N
N
N
N
N
5
10
20
30
40
50
B N W *
Better Not Different Worse Determined by t-test
Stations (N)
Figure 6.17: Avionics Throughput Performance Comparison - Bursty Error Channel
0.90
0.80
0.70
0.60
Normalized Usable Throughput (S U )
0.50
5 Sta - 802.11
5 Sta - RT-MAC
10 Sta - 802.11
10 Sta - RT-MAC
20 Sta - 802.11
20 Sta - RT-MAC
30 Sta - 802.11
30 Sta - RT-MAC
40 Sta - 802.11
40 Sta - RT-MAC
50 Sta - 802.11
50 Sta - RT-MAC
0.40
0.3
0.5
0.7
0.30 0.9
Offered Load (G )
Figure 6.18: Usable Avionics Throughput - Ideal Channel
Rusty O. Baldwin
Chapter 6. Simulation Results
122
For G ≤ 0.5, it is difficult to make any general statements about IEEE 802.11 mean delay. For the ideal channel it was generally better than RT-MAC, while for the bursty error channel, it was comparable or better than RT-MAC. For G ≥ 0.7, IEEE 802.11 delay increases rapidly, sometimes reaching 10s of seconds. For N > 10, this increase began at G = 0.5. Due to these long delays, buffer overflow was common. The packet buffer size for this traffic model was 200 packets. The maximum percentage of packets discarded due to a full buffer was approximately 10% at G = 0.9. RT-MAC mean delay increases at a roughly constant rate throughout the range of offered loads, G. For G > 0.5, RT-MAC generally performed better than IEEE 802.11. Compared to the telemetry traffic model, relatively few of the RT-MAC packets are discarded due to lateness (cf., Figures 6.23 and 6.24). Therefore, the primary reason for the improved mean delay for G > 0.5 is presumed to be the low collision rate. No buffer overflow was experienced with RT-MAC. The reason for RT-MACs worse mean delay performance for G ≤ 0.5 can be attributed to two factors. First, RT-MAC CW size (cf., Section 5.2) is always larger than IEEE 802.11 so the probability that RT-MAC will wait longer to access the channel is greater. Second, the “penalty” (i.e., access delay) for this larger CW size is greater due to the larger packet size. For G > 0.5, other factors such as collisions and retransmissions in the IEEE 802.11 network negate this penalty.
6.2.3
Mean Delay Performance Summary
A summary of the performance of RT-MAC versus IEEE 802.11 throughput is given in Figures 6.21 and 6.22 for the ideal and bursty error channels respectively.
5 Sta - 802.11
5 Sta - RT-MAC
10 Sta - 802.11
10 Sta - RT-MAC
20 Sta - 802.11
20 Sta - RT-MAC
30 Sta - 802.11
30 Sta - RT-MAC
40 Sta - 802.11
40 Sta - RT-MAC
50 Sta - 802.11
50 Sta - RT-MAC
5 Sta - 802.11
5 Sta - RT-MAC
10 Sta - 802.11
10 Sta - RT-MAC
20 Sta - 802.11
20 Sta - RT-MAC
30 Sta - 802.11
30 Sta - RT-MAC
40 Sta - 802.11
40 Sta - RT-MAC
50 Sta - 802.11
50 Sta - RT-MAC
Rusty O. Baldwin Chapter 6. Simulation Results
0.3
0.3
0.5
0.5
0.7
1
0.7
123
100
10
1 Delay (sec) (D ) Log scale
0.1
0.01
0.001 0.9
Offered Load (G )
Figure 6.19: Avionics Mean Delay - Ideal Channel
100
10
Delay (sec) (D ) Log scale
0.1
0.9
0.01
Offered Load (G )
Figure 6.20: Avionics Mean Delay - Bursty Error Channel
Rusty O. Baldwin
0.9
Chapter 6. Simulation Results
B
B
B
B
B
B
124
Legend With respect to IEEE 802.11
Offered Load 0.7 (G) 0.5
B
B
B
N
B
B
W
W
W
W
W
W
0.3
W
W
W
W
W
W
5
10
20
30
40
50
B N W *
Better Not Different Worse Determined by t-test
Stations (N)
Figure 6.21: Avionics Mean Delay Performance Comparison - Ideal Channel
0.9
B
B
B
B
B
B
Legend With respect to IEEE 802.11
B Offered Load 0.7 (G) 0.5 N*
B
N
B
B
B
N
N
N
N*
W
N
N
W
W
W
W
5
10
20
30
40
50
0.3
B N W *
Better Not Different Worse Determined by t-test
Stations (N)
Figure 6.22: Avionics Mean Delay Performance Comparison - Bursty Error Channel
Rusty O. Baldwin
Chapter 6. Simulation Results
125 1.0 0.9
0.7 0.6 0.5 0.4
5 Sta - 802.11
10 Sta - 802.11
5 Sta - RT-MAC
10 Sta - RT-MAC
0.1 20 Sta - 802.11
30 Sta - 802.11
20 Sta - RT-MAC
40 Sta - 802.11
30 Sta - RT-MAC
0.2 40 Sta - RT-MAC
50 Sta - RT-MAC 50 Sta - 802.11
0.3
Missed Deadline Ratio (F )
0.8
0.3
0.5
0.7
0.0 0.9
Offered Load (G )
Figure 6.23: Avionics Missed Deadline Ratio - Ideal Channel
6.2.4
Missed Deadlines
Simulation results for missed deadlines are shown in Figures 6.23 and 6.24. As seen in the figures, IEEE 802.11 is susceptible to missed deadlines at moderate to heavy loading for N ≤ 20. At lighter loads, missed deadline ratios were poor for N > 20. RT-MAC is more tolerant of network load and for higher offered loads, always performs dramatically better than IEEE 802.11. For the ideal channel, the missed deadline ratio never exceeded 0.12.
6.2.5
Missed Deadline Performance Summary
A summary of the performance of RT-MAC versus IEEE 802.11 throughput is given in Figures 6.25 and 6.26 for the ideal and bursty error channels respectively. While the performance of RT-MAC for G ≤ 0.5 is comparable or worse than IEEE 802.11, the magnitude of the missed deadline ratio for both protocols is much less that 0.01 and therefore not a concern. Of some interest is the better performance of RT-MAC in the bursty error channel. This
Rusty O. Baldwin
Chapter 6. Simulation Results
126 1.0 0.9
0.7 0.6 0.5 0.4
5 Sta - 802.11
5 Sta - RT-MAC
10 Sta - 802.11
20 Sta - 802.11
10 Sta - RT-MAC
0.1
20 Sta - RT-MAC
30 Sta - 802.11
40 Sta - 802.11
30 Sta - RT-MAC
50 Sta - 802.11
0.2
40 Sta - RT-MAC
50 Sta - RT-MAC
0.3
Missed Deadline Ratio (F )
0.8
0.3
0.5
0.7
0.0 0.9
Offered Load (G )
Figure 6.24: Avionics Missed Deadline Ratio - Bursty Error Channel can be attributed to the fact that RT-MAC will discard a late packet while IEEE 802.11 will transmit until successfully received.
6.2.6
Collisions
IEEE 802.11 and RT-MAC collision ratios are shown in Figures 6.27 and 6.28. As with the IEEE 802.11 mean delay and missed deadline ratio, the IEEE 802.11 collision ratio increases with G. As N increases, the maximum value of the collision ratio increases as well. Therefore, as with the telemetry traffic model, IEEE 802.11 collisions are influenced to a large degree by both G and N. In contrast, RT-MAC collision ratio remains quite stable. Compared to IEEE 802.11, it is only slightly influenced by either G or N. Statistically, RT-MAC always outperformed IEEE 802.11. Thus far then, the enhanced collision avoidance scheme (cf., Section 5.2) has been seen to be quite effective in reducing collisions for two disparate types of traffic
Rusty O. Baldwin
0.9
Chapter 6. Simulation Results
B
B
B
B
B
B
127
Legend With respect to IEEE 802.11
Offered Load 0.7 (G) 0.5
B
B
B
B
B
B
N
N
W
W
W
W
0.3
N
N
W*
W
W
W
5
10
20
30
40
50
B N W *
Better Not Different Worse Determined by t-test
Stations (N)
Figure 6.25: Avionics Missed Deadline Performance Comparison - Ideal Channel
0.9
B
B
B
B
B
B
Legend With respect to IEEE 802.11
Offered Load 0.7 (G) 0.5
B
B
B
B
B
B
B
W
B
B
B
W
0.3
W
W
W
W
W
W
5
10
20
30
40
50
B N W *
Better Not Different Worse Determined by t-test
Stations (N)
Figure 6.26: Avionics Missed Deadline Performance Comparison - Bursty Error Channel
Rusty O. Baldwin
Chapter 6. Simulation Results
128
0.40
0.35
0.25 0.20
5 Sta - 802.11
0.00 5 Sta - RT-MAC
10 Sta - 802.11
20 Sta - 802.11
0.05 10 Sta - RT-MAC
30 Sta - 802.11
20 Sta - RT-MAC
40 Sta - 802.11
0.10 30 Sta - RT-MAC
50 Sta - 802.11
40 Sta - RT-MAC
50 Sta - RT-MAC
0.15
Collision Ratio (C )
0.30
0.3
0.5
0.7
0.9
Offered Load (G )
Figure 6.27: Avionics Collision Ratio - Ideal Channel models—telemetry and avionics.
6.2.7
Bursty Error Channel
Generally, the same observations made in Section 6.1.5 about the bursty error channel also applies to the avionics traffic case. That is, while the bursty error channel did have a detectable effect on the performance metrics, it was not very large. One exception to this, was the mean delay metric. In the figure illustrating the regression model for mean delay (Figure 7.12), the bursty channel is seen to increase the mean delay by a constant factor of about 4.46 ms. This was not seen in the telemetry traffic case, most likely, due to the large difference in packet sizes—83 bytes in the telemetry model versus 775 bytes for the avionics model. That is, in the telemetry model it takes much less time to retransmit a packet. So much so, that the effect on the overall mean delay is negligible.
Rusty O. Baldwin
Chapter 6. Simulation Results
129 0.40
0.35
0.25
0.20
0.15
Collision Ratio (C )
0.30
5 Sta - 802.11
0.00
5 Sta - RT-MAC
10 Sta - 802.11
10 Sta - RT-MAC
20 Sta - 802.11
30 Sta - 802.11
0.05
20 Sta - RT-MAC
40 Sta - 802.11
30 Sta - RT-MAC
50 Sta - 802.11
40 Sta - RT-MAC
50 Sta - RT-MAC
0.10
0.3
0.5
0.7
0.9
Offered Load (G )
Figure 6.28: Avionics Collision Ratio - Bursty Error Channel
6.3
Voice with Non Real-time Data Traffic Model
The voice traffic model has both real-time traffic (i.e., the packetized voice data) and non real-time traffic (or data with no deadlines). This model was chosen to determine how well RT-MAC performed with the very common application of transmitting voice data as well as to determine how well RT-MAC performed with various levels of non real-time data “interfering” with the delivery of the real-time data. A discussion of this traffic model is found in Section 4.7 and summarized in Table 4.4. A non preemptive head-of-line service discipline is used. If there are any real-time packets in the queue, they are serviced first. Only when there are no real-time packets to transmit are non real-time packets serviced. In the figures that follow, the term Offered Data Load refers to the normalized amount of non real-time (data) traffic that is offered in addition to the packetized voice traffic that each station in the network is generating. The amount of real-time traffic generated is a function of N, the number of stations in the network (cf., Section 4.5.2 and Table 4.2). Normalized
Rusty O. Baldwin
Chapter 6. Simulation Results
130
0.70
Normalized Throughput (S )
0.60 0.50 0.40 0.30 0.20 0.10
4 Sta - 802.11
4 Sta - RT-MAC
10 Sta - 802.11
10 Sta - RT-MAC
14 Sta - 802.11
14 Sta - RT-MAC
20 Sta - 802.11
20 Sta - RT-MAC
24 Sta - 802.11
24 Sta - RT-MAC
30 Sta - 802.11
30 Sta - RT-MAC
0.00
0
0.2
0.4
0.6
0.8
Offered Data Load (G NRT )
Figure 6.29: Voice Throughput - Ideal Channel (1 Mbps) throughput, S, is the sum of the real-time and non real-time throughputs or S = SRT +SN RT . The quality of the voice channel was deemed usable if F ≤ 0.10 (cf., Section 2.3.1). Simulations using the voice traffic model were performed using two different channel capacities, 1 Mbps and 10 Mbps. The 1 Mbps channel is discussed first.
6.3.1
1 Mbps Data Rate
6.3.1.1
Normalized Throughput
As is evident from Figures 6.29 and 6.30, RT-MAC throughput is generally comparable to IEEE 802.11 for N < 14 and at modest offered data loads, GN RT . Outside of these limits, RT-MAC easily outperforms IEEE 802.11. Note that the throughput of the voice traffic can be determined by inspecting the figures along the axis where the Offered Data Load is equal to 0.0.
Rusty O. Baldwin
Chapter 6. Simulation Results
131
0.70
0.50
0.40
0.30
4 Sta - 802.11
4 Sta - RT-MAC
0.00 10 Sta - 802.11
14 Sta - 802.11
10 Sta - RT-MAC
20 Sta - 802.11
14 Sta - RT-MAC
24 Sta - 802.11
0.10 20 Sta - RT-MAC
30 Sta - 802.11
24 Sta - RT-MAC
30 Sta - RT-MAC
0.20
Normalized Throughput (S )
0.60
0
0.2
0.4
0.6
0.8
Offered Data Load (G NRT )
Figure 6.30: Voice Throughput - Bursty Error Channel (1 Mbps) 6.3.1.2
Throughput Performance Summary
A summary of the performance of RT-MAC versus IEEE 802.11 throughput is given in Figures 6.31 and 6.32 for the ideal and bursty error channels respectively. The region where RT-MAC performed better than IEEE 802.11 was the same for both channel models.
6.3.1.3
Usable Throughput
Before discussing usable throughput, the reader needs to be made aware of a caveat with regard to the IEEE 802.11 throughput data used to construct Figure 6.33. In terms of G, a known proportion of real-time and non real-time data is offered to the channel. In terms of total throughput, S, the proportion of real-time throughput (SRT ) versus non realtime throughput (SN RT ) data was not gathered and is therefore unknown. This makes it impossible to accurately determine SU since SU = SRT (1 − F ) + SN RT where F is the missed deadline ratio. For RT-MAC throughput data this does not pose a problem since all
Rusty O. Baldwin
Chapter 6. Simulation Results
0.8
B
B
B
B
B
B
0.6
N
B
B
B
B
B
Offered Data Load (GN RT ) 0.4
N
N
B
B
B
B
0.2
N
N
W*
B
B
B
0.0
N
N
N
N
W
B
4
10
14
20
24
30
132
Legend With respect to IEEE 802.11
B N W *
Better Not Different Worse Determined by t-test
Stations (N)
Figure 6.31: Voice Throughput Performance Comparison - Ideal Channel (1 Mbps)
0.8
B
B
B
B
B
B
0.6
N
B
B
B
B
B
Offered Data Load (GN RT ) 0.4
N
N
B
B
B
B
0.2
N
N
N
B
B
B
0.0
N
N
W*
N
W*
B
4
10
14
20
24
30
Legend With respect to IEEE 802.11
B N W *
Better Not Different Worse Determined by t-test
Stations (N)
Figure 6.32: Voice Throughput Performance Comparison - Bursty Error Channel (1 Mbps)
Rusty O. Baldwin
Chapter 6. Simulation Results
133
throughput is usable due to the transmission control algorithm which will not transmit a late packet. IEEE 802.11, however, will attempt to transmit a late packet and therefore some IEEE 802.11 throughput may in fact be late real-time packets. Therefore, an assumption must be made with regard to this proportion. (Note that this does not affect the previous usable throughput data discussed for the telemetry and avionics traffic models since all of the packets were real-time.) Usable throughput is shown in Figure 6.33. Figure 6.33 assumes that any IEEE 802.11 throughput is first due to real-time packets up to the limit of GRT and any throughput greater than GRT is due to non real-time packets. In effect, this changes the usable throughput equation from SU = SRT (1 − F ) + SN RT to SU = S − GRT F for S > GRT or SU = 0.0 for S ≤ GRT F . Obviously, then, the figure should only be considered representative of the actual performance. However, due to the head-of-line service discipline used (i.e., real-time packets are serviced first), the figure does give an indication of what the actual performance might be. When compared to Figures 6.29 and 6.30 it can be seen that for N > 4, the performance advantage of RT-MAC is intensified.
6.3.1.4
Mean Delay
The mean delay of IEEE 802.11 and RT-MAC is shown in Figures 6.34 and 6.35. As before, mean delay is calculated as the arithmetic mean of the time difference from packet creation to successful reception of the last bit. Delay that discarded packets suffer do not contribute to mean delay. For every network size considered, IEEE 802.11 delay increases more rapidly than the corresponding RT-MAC network. This is evident from the slope of the mean delay curves. The magnitude of the maximum delay was quite large—6 to 10 seconds being typical. Due to the long delays, buffer overflow for non real-time data was common in IEEE 802.11 networks— 25% of arriving packets being discarded was a typical value. For real-time packets, up to 3% were discarded. In RT-MAC networks, discarded non real-time packets rarely occurred
Rusty O. Baldwin
Chapter 6. Simulation Results
134
0.60
0.50
0.40
0.30
0.20
0.10
Normalized Usable Throughput (S U )
0.70
30 Sta - RT-MAC
30 Sta - 802.11
24 Sta - RT-MAC
24 Sta - 802.11
20 Sta - RT-MAC
20 Sta - 802.11
14 Sta - RT-MAC
Offered Data Load (G NRT )
0
14 Sta - 802.11
0.2
10 Sta - RT-MAC
0.4
10 Sta - 802.11
0.6
4 Sta - RT-MAC
0.8
4 Sta - 802.11
0.00
Figure 6.33: Representative Usable Voice Throughput - Ideal Channel (1 Mbps) and never exceeded 12%. No discarding of real-time packets occurred in RT-MAC stations. The real-time and non real-time packets each had a buffer capable of holding 500 packets. Note that the mean delay is seen to decrease for N = 4, GN RT = 0.2 from the value at N = 4, GN RT = 0.0. The mean delay is larger with no offered data load due to the way the mean delay is calculated. Real-time and non real-time mean delay is aggregated into a single statistic. Since the volume of real-time traffic is a small portion of the overall traffic the delay suffered by the non real-time traffic will dominate. As the number of stations increase, so too does the wait for channel access and the number of collisions. This increases the non real-time delay and so the mean delay begins to increase for G > 0.0 rather than decrease. RT-MAC mean delay, while typically comparable to IEEE 802.11 for smaller size networks and at low offered data loads, increased at a smaller rate. At larger network sizes and offered data loads, RT-MAC was typically better than IEEE 802.11.
4 Sta - 802.11
4 Sta - RT-MAC
10 Sta - 802.11
10 Sta - RT-MAC
14 Sta - 802.11
14 Sta - RT-MAC
20 Sta - 802.11
20 Sta - RT-MAC
24 Sta - 802.11
24 Sta - RT-MAC
30 Sta - 802.11
30 Sta - RT-MAC
0
0.2
0.4
4 Sta - 802.11
4 Sta - RT-MAC
10 Sta - 802.11
10 Sta - RT-MAC
14 Sta - 802.11
14 Sta - RT-MAC
20 Sta - 802.11
20 Sta - RT-MAC
24 Sta - 802.11
24 Sta - RT-MAC
30 Sta - 802.11
30 Sta - RT-MAC
Rusty O. Baldwin Chapter 6. Simulation Results
0.6
0
135
10
1
Delay (sec) (D ) Log scale 0.1
0.01
0.4 0.6 0.8
0.2 Offered Data Load (G NRT )
Figure 6.34: Voice Mean Delay - Ideal Channel (1 Mbps)
10
1 Delay (sec) (D ) Log scale
0.1
0.8
0.01
Offered Data Load (G NRT )
Figure 6.35: Voice Mean Delay - Bursty Error Channel (1 Mbps)
Rusty O. Baldwin
Chapter 6. Simulation Results
0.8
N
N
B
N
N
B*
0.6
N
B
B
B
B
B
Offered Data Load (GN RT ) 0.4
N
B
B
B
B
B
0.2
N
W
N
B
B
B
0.0
W
W
W
W*
N
B
4
10
14
20
24
30
136
Legend With respect to IEEE 802.11
B N W *
Better Not Different Worse Determined by t-test
Stations (N)
Figure 6.36: Voice Mean Delay Performance Comparison - Ideal Channel (1 Mbps) 6.3.1.5
Mean Delay Performance Summary
A summary of the performance of RT-MAC versus IEEE 802.11 throughput is given in Figures 6.36 and 6.37 for the ideal and bursty error channels. In contrast to most of the previous performance summaries, the region where RT-MAC is better than IEEE 802.11 is not contiguous. That is, there does not exist a region where RT-MAC always performs better than IEEE 802.11. This can be attributed to the Pareto distribution from which the non real-time packet arrivals times are drawn. As observed in Section 2.3.1, the shape parameter, a = 1.6, of the Pareto distribution is in the finite mean, infinite variance region. Given the infinite variance, it is to be expected that mean delay may also widely vary.
6.3.1.6
Missed Deadlines
Simulation results for missed deadlines are shown in Figures 6.38 and 6.39. IEEE 802.11 is susceptible to missed deadlines at light network loads, especially for N > 10. RT-MAC is more tolerant of network load and for higher offered loads, always performs better than
Rusty O. Baldwin
Chapter 6. Simulation Results
0.8 B*
B
B
N
N
B*
0.6
N
B
B
B
B
B
Offered Data Load (GN RT ) 0.4
B
N
B
B
B
B
0.2
N
N
B
B
B
B
0.0
N
N
N
N
N
B
4
10
14
20
24
30
137
Legend With respect to IEEE 802.11
B N W *
Better Not Different Worse Determined by t-test
Stations (N)
Figure 6.37: Voice Mean Delay Performance Comparison - Bursty Error Channel (1 Mbps) IEEE 802.11. Statistically, RT-MAC was always better than IEEE 802.11 except for the following cases where it was not different. For the ideal channel RT-MAC and IEEE 802.11 were not different for N = 4, GN RT = 0.0, 0.2 and N = 10, GN RT = 0.0; for the bursty error channel, RT-MAC and IEEE 802.11 were not different for N = 10, GN RT = 0.0.
6.3.1.7
1 Mbps Data Rate Missed Deadline Performance Summary
The maximum acceptable missed deadline ratio for voice traffic used in this research is F ≤ 0.10 (cf., Section 2.3.1). Figures 6.40–6.43 summarize the ability of IEEE 802.11 and RT-MAC to meet this level of performance. In the figures, areas to the left of the heavy line indicate areas where the maximum acceptable missed deadline ratio is not exceeded. As the legend in the figures indicate, “A” denotes acceptable performance, “M” indicates marginally acceptable performance, and “U” denotes unacceptable performance. For easy comparison, Figures 6.41 and 6.43 also circle the letters where RT-MAC performs better than IEEE 802.11. In no case did RT-MAC perform worse than IEEE 802.11 in terms of
4 Sta - 802.11
4 Sta - RT-MAC
10 Sta - 802.11
10 Sta - RT-MAC
14 Sta - 802.11
14 Sta - RT-MAC
20 Sta - 802.11
20 Sta - RT-MAC
24 Sta - 802.11
0
0.2
0.4
0.6
4 Sta - 802.11
4 Sta - RT-MAC
10 Sta - 802.11
10 Sta - RT-MAC
14 Sta - 802.11
14 Sta - RT-MAC
20 Sta - 802.11
20 Sta - RT-MAC
24 Sta - 802.11
24 Sta - RT-MAC
30 Sta - 802.11
30 Sta - RT-MAC
0
0.8
0.7
0.5 0.6
0.3 0.4
Missed Deadline Ratio (F )
30 Sta - RT-MAC 30 Sta - 802.11 24 Sta - RT-MAC
Missed Deadline Ratio (F )
Rusty O. Baldwin Chapter 6. Simulation Results
0.4
138
1.0 0.9 0.8
0.7
0.6
0.5
0.4
0.3
0.2
0.1
0.0
0.6 0.8
0.2 Offered Data Load (G NRT )
Figure 6.38: Voice Missed Deadline Ratio - Ideal Channel (1 Mbps)
1.0
0.9
0.2
0.0 0.1
0.8
Offered Data Load (G NRT )
Figure 6.39: Voice Missed Deadline Ratio - Bursty Error Channel (1 Mbps)
Rusty O. Baldwin
Chapter 6. Simulation Results
139
the performance measures “A”, “M”, and “U”. For the ideal channel, RT-MAC was able to improve performance in two areas (N = 4, GN RT = 0.8; N = 14, GN RT = 0.2) and operate in two additional areas where IEEE 802.11 could not (N = 10, GN RT = 0.4; N = 24, G = 0.0). For the bursty error channel, RT-MAC was able to improve performance in three areas (N = 4, GN RT = 0.6, 0.8; N = 20, GN RT = 0.0) and operate in three additional areas where IEEE 802.11 could not (N = 10, GN RT = 0.4; N = 20, GN RT = 0.2; N = 24, G = 0.0). While the performance of RT-MAC compared to IEEE 802.11 indicates an improvement, the maximum number of stations than could be supported (irrespective of non real-time data load) only increased from N = 20 to N = 24. Given the sometimes large performance improvements seen in the telemetry and avionics traffic models in RT-MAC networks, it seems plausible that a limit is being reached with respect to some other resource. The most likely resource limit being reached is the 1 Mbps channel data rate. To determine a theoretic maximum number of stations that can be supported using a 1 Mbps data rate, we use the simplifying assumptions of perfect scheduling, an ideal channel, and a deadline equal to the packet interarrival time. Voice traffic is generated by an ON/OFF source. When ON, packets arrive every 20ms and contain 80 bytes of data. A source is ON for an average of 1.0s and OFF for an average of 1.35s. To each packet, additional bits are added at the physical layer, therefore each 80 byte packet is expanded to 132 bytes or 1056 bits. In addition, an ACK packet must be received for each transmission which means an additional 308 bits must be transmitted. Further, each packet suffers at least a DIFS and SIFS (cf., Section 2.2.3.1) which totals 30 µs. Therefore, it takes each packet at least
(1056 + 308)bits + 30µs = 1.4ms 1 × 10⁶ bps to complete transmission. On average there are
N 1.0+1.35
(6.1)
stations generating voice packets.
Therefore, under the assumption of deadlines prior to the next packet arrival, perfect schedul-
Rusty O. Baldwin
Chapter 6. Simulation Results
0.8
M
U
U
U
U
U
0.6
A
U
U
U
U
U
140
Legend Missed Deadline Ratio (F )
Offered Data Load 0.4 (GN RT )
A
U
U
U
U
U
0.2
A
A
M
U
U
U
0.0
A
A
A
A
U
U
4
10
14
20
24
30
U M A
F > 0.10, Unacceptable 0.05 ≤ F ≤ 0.10, Marginal F < 0.05, Acceptable
Stations (N)
Figure 6.40: Voice Missed Deadline Ratio Summary - Ideal Channel (IEEE 802.11, 1 Mbps) ing (as well as immediate access to the channel), the maximum number of stations that can 20ms be supported is Nmax = b 1.4ms × 2.35c or Nmax = 33.
Using the same reasoning but substituting a 10 Mbps data rate, Nmax = 282. Since it appears that the channel data rate is a limiting factor, a data rate of 10 Mbps is investigated in Section 6.3.2.
6.3.1.8
Collisions
IEEE 802.11 and RT-MAC collision ratios are shown in Figures 6.44 and 6.45. As with the other traffic models, IEEE 802.11 collision ratio, C, increases rapidly with G and reaches a local maximum. As G increases further the collision ratio tends to stay relatively constant. As N increases, the starting value and the maximum value of the collision ratio increase as well. Hence, IEEE 802.11 collisions are highly influenced by both G and N. The RT-MAC collision ratio is very stable. As before, compared to IEEE 802.11, it is only slightly influenced by either G or N. Statistically, RT-MAC performed better than
Rusty O. Baldwin
Chapter 6. Simulation Results
141
��
0.8
A
U
��
U
U
U
U Legend
0.6
A
U
U
U
U
U
Offered Data Load 0.4 (GN RT )
A
A
U
U
U
U
0.2
A
A
A
U
U
U
0.0
A
A
A
A
4
10
14
20
��
�� ��
�� ��
M
U
24
30
��
Missed Deadline Ratio (F )
U M A
F > 0.10, Unacceptable 0.05 ≤ F ≤ 0.10, Marginal F < 0.05, Acceptable
� �Denotes improvement
compared to IEEE 802.11
Stations (N)
Figure 6.41: Voice Missed Deadline Ratio Summary - Ideal Channel (RT-MAC, 1 Mbps)
0.8
M
U
U
U
U
U
0.6
M
U
U
U
U
U
Legend Missed Deadline Ratio (F )
Offered Data Load 0.4 (GN RT )
A
U
U
U
U
U
0.2
A
A
U
U
U
U
0.0
A
A
A
M
U
U
4
10
14
20
24
30
U M A
F > 0.10, Unacceptable 0.05 ≤ F ≤ 0.10, Marginal F < 0.05, Acceptable
Stations (N)
Figure 6.42: Voice Missed Deadline Ratio Summary - Bursty Error Channel (IEEE 802.11, 1 Mbps)
Rusty O. Baldwin
Chapter 6. Simulation Results
142
��
0.8 0.6 Offered Data Load 0.4 (GN RT )
A
U
� �� �
A
U
U
U Legend
U
U
U
U
U
A
U
U
U
U
A
A
U
U
U
�� ��
A
U
�� ��
0.2
A
0.0
A
A
A
4
10
14
�� �� ��
A
M
U
20
24
30
�� ��
Missed Deadline Ratio (F )
U M A
F > 0.10, Unacceptable 0.05 ≤ F ≤ 0.10, Marginal F < 0.05, Acceptable
� �Denotes improvement
compared to IEEE 802.11
Stations (N)
Figure 6.43: Voice Missed Deadline Ratio Summary - Bursty Error Channel (RT-MAC, 1 Mbps) IEEE 802.11 with only one exception, N = 10, GN RT = 0.0, where it performed worse. The reason for this exception has not been determined.
6.3.2
10 Mbps Data Rate
6.3.2.1
Normalized Throughput
As with the 1 Mbps channel, in the figures that follow, the term Offered Data Load refers to the normalized amount of non real-time (data) traffic that is offered in addition to the packetized voice traffic that each station in the network is generating. The amount of real-time traffic generated is a function of N, the number of stations in the network (cf., Section 4.5.2 and Table 4.3). Normalized throughput, S, is the sum of the real-time and non real-time throughputs or S = SRT + SN RT . The quality of the voice channel was deemed usable if F ≤ 0.10 (cf., Section 2.3.1).
4 Sta - 802.11
4 Sta - RT-MAC
10 Sta - 802.11
10 Sta - RT-MAC
14 Sta - 802.11
14 Sta - RT-MAC
20 Sta - 802.11
20 Sta - RT-MAC
24 Sta - 802.11
24 Sta - RT-MAC
30 Sta - 802.11
30 Sta - RT-MAC
0
0 0.2
0.20
0.15
Collision Ratio (C )
4 Sta - 802.11
4 Sta - RT-MAC
10 Sta - 802.11
10 Sta - RT-MAC
14 Sta - 802.11
14 Sta - RT-MAC
20 Sta - 802.11
20 Sta - RT-MAC
24 Sta - 802.11
24 Sta - RT-MAC
30 Sta - 802.11
30 Sta - RT-MAC
Collision Ratio (C )
Rusty O. Baldwin Chapter 6. Simulation Results 143
0.35
0.30
0.25
0.20
0.15
0.10
0.05
0.00
0.4 0.6 0.8
Offered Data Load (G NRT )
Figure 6.44: Voice Collision Ratio - Ideal Channel (1 Mbps)
0.35
0.30
0.25
0.10
0.05
0.6 0.8 0.00
0.4 0.2 Offered Data Load (G NRT )
Figure 6.45: Voice Collision Ratio - Bursty Error Channel (1 Mbps)
Rusty O. Baldwin
Chapter 6. Simulation Results
144
0.60
Normalized Throughput (S )
0.50
0.40
0.30
0.20
10 Sta - 802.11
20 Sta - 802.11
10 Sta - RT-MAC
30 Sta - 802.11
20 Sta - RT-MAC
40 Sta - 802.11
30 Sta - RT-MAC
50 Sta - 802.11
40 Sta - RT-MAC
60 Sta - 802.11
Offered Data Load (G NRT )
0
70 Sta - 802.11
0.2
60 Sta - RT-MAC
0.4
70 Sta - RT-MAC
0.6
80 Sta - 802.11
0.8
80 Sta - RT-MAC
0.00
50 Sta - RT-MAC
0.10
Figure 6.46: Voice Throughput - Ideal Channel (10 Mbps) Figures 6.46 and 6.47 show that RT-MAC throughput is generally comparable to IEEE 802.11 at modest offered data loads, GN RT . In the cases where RT-MAC performed worse than IEEE 802.11, RT-MACs mean throughput was typically within 10% of the IEEE 802.11 mean throughput. For GN RT > 0.4, RT-MAC easily outperformed IEEE 802.11 in almost all cases.
6.3.2.2
Throughput Performance Summary
A summary of the performance of RT-MAC versus IEEE 802.11 throughput is given in Figures 6.48 and 6.49 for the ideal and bursty error channels respectively. The region where RT-MAC performed better than IEEE 802.11 was the same for both channel models except for the bursty channel where at GN RT = 0.2, N = 80 RT-MAC outperformed IEEE 802.11 as well.
Rusty O. Baldwin
Chapter 6. Simulation Results
145
0.60
Normalized Throughput (S )
0.50
0.40
0.30
0.20
10 Sta - 802.11
20 Sta - 802.11
10 Sta - RT-MAC
30 Sta - 802.11
20 Sta - RT-MAC
40 Sta - 802.11
30 Sta - RT-MAC
50 Sta - 802.11
40 Sta - RT-MAC
0
60 Sta - 802.11
Offered Data Load (G NRT )
70 Sta - 802.11
0.2
60 Sta - RT-MAC
0.4
70 Sta - RT-MAC
0.6
80 Sta - 802.11
0.8
80 Sta - RT-MAC
0.00
50 Sta - RT-MAC
0.10
Figure 6.47: Voice Throughput - Bursty Error Channel (10 Mbps)
0.8
B
B
B
B
B
B
B
B
0.6
B
B
B
B
B
B
B
B
Offered Data Load (GN RT ) 0.4
W
W
B
B
B
B
B
B
0.2 W*
W
W
W
W
W
N
N
N
N
N
N
N
N
N
N
10
20
30
40
50
60
70
80
0.0
Legend With respect to IEEE 802.11
B N W *
Better Not Different Worse Determined by t-test
Stations (N)
Figure 6.48: Voice Throughput Performance Comparison - Ideal Channel (10 Mbps)
Rusty O. Baldwin
Chapter 6. Simulation Results
0.8
B
B
B
B
B
B
B
B
0.6
B
B
B
B
B
B
B
B
Offered Data Load (GN RT ) 0.4
W
N
B
B
B
B
B
B
W
W*
N
N
B
0.2 W* W* W* 0.0
N
N
W
N
N
N
N
N
10
20
30
40
50
60
70
80
146
Legend With respect to IEEE 802.11
B N W *
Better Not Different Worse Determined by t-test
Stations (N)
Figure 6.49: Voice Throughput Performance Comparison - Bursty Error Channel (10 Mbps) 6.3.2.3
Mean Delay
The mean delay of IEEE 802.11 and RT-MAC is shown in Figures 6.50 and 6.51. Mean delay is calculated as the arithmetic mean of the time difference from packet creation to successful reception of the last bit. Delay that discarded packets suffer do not contribute to mean delay. Many of the observations made for the mean delay of the 1 Mbps channel (Section 6.3.1.4) can also be made about the 10 Mbps channel. In general, IEEE 802.11 delay increases more rapidly than the corresponding RT-MAC network. Due to the long delays, buffer overflow for non real-time data was common—as much as 35% of arriving packets were discarded in IEEE 802.11 networks, 27% in RT-MAC networks. In contrast to the 1 Mbps channel, no real-time packets were discarded. This is most likely due to the faster channel speed. As with the 1 Mbps channel, the mean delay is seen to decrease in many cases as GN RT increased from 0.0 to 0.2. This is due to the way the mean delay is calculated. Real-time and non real-time mean delay is aggregated into a single statistic. Since the volume of real-
Rusty O. Baldwin
Chapter 6. Simulation Results
147
10
1
Delay (sec) (D ) Log scale
10 Sta - 802.11
20 Sta - 802.11
0.001 10 Sta - RT-MAC
30 Sta - 802.11
20 Sta - RT-MAC
40 Sta - 802.11
30 Sta - RT-MAC
50 Sta - 802.11
40 Sta - RT-MAC
60 Sta - 802.11
50 Sta - RT-MAC
70 Sta - 802.11
0.01 60 Sta - RT-MAC
80 Sta - 802.11
70 Sta - RT-MAC
80 Sta - RT-MAC
0.1
0
0.2
0.4
0.6
0.8
Offered Data Load (G NRT )
Figure 6.50: Voice Mean Delay - Ideal Channel (10 Mbps) time traffic is a small portion of the overall traffic, the delay suffered by the non real-time traffic will dominate. The proportion of non real-time packets to real-time packets is quite high even when GN RT = 0.2. The proportion ranges from about 15 to 1 for N = 10 down to about 2 to 1 for N = 80. Therefore, the mean delay experienced by the non real-time traffic quickly masks the effect of the delay experienced by the real-time packets. Data for the delay suffered by real-time packets and non real-time packets separately was not collected.
6.3.2.4
Mean Delay Performance Summary
A summary of the performance of RT-MAC versus IEEE 802.11 mean delay is given in Figures 6.52 and 6.53 for the ideal and bursty error channels. As in the 1 Mbps case, the region where RT-MAC is better than IEEE 802.11 is not contiguous. That is, there does not exist a region where RT-MAC always performs better than IEEE 802.11. This can be attributed to the Pareto distribution from which the non real-time packet arrivals times are drawn. As observed in Section 2.3.1, the shape parameter, a = 1.6, of the Pareto distribution
Rusty O. Baldwin
Chapter 6. Simulation Results
148
10
1
Delay (sec) (D ) Log scale
10 Sta - 802.11
20 Sta - 802.11
0.001 10 Sta - RT-MAC
30 Sta - 802.11
20 Sta - RT-MAC
40 Sta - 802.11
30 Sta - RT-MAC
50 Sta - 802.11
40 Sta - RT-MAC
60 Sta - 802.11
50 Sta - RT-MAC
70 Sta - 802.11
0.01 60 Sta - RT-MAC
80 Sta - 802.11
70 Sta - RT-MAC
80 Sta - RT-MAC
0.1
0
0.2
0.4
0.6
0.8
Offered Data Load (G NRT )
Figure 6.51: Voice Mean Delay - Bursty Error Channel (10 Mbps) is in the finite mean, infinite variance region. Given the infinite variance, it is to be expected that mean delay may also widely vary.
6.3.2.5
Missed Deadlines
Simulation results for missed deadlines are shown in Figures 6.54 and 6.55. While obviously benefiting from the higher channel rate, IEEE 802.11 is still susceptible to missed deadlines at light network loads, especially for N > 20. RT-MAC is more tolerant of network load and for higher offered loads, always performs better than IEEE 802.11. There were a few instances where RT-MAC performed worse than IEEE 802.11 in terms of missed deadlines (cf., Tables B.30 and B.31). However, in these cases the ratio of missed deadlines for RTMAC was typically on the order of 0.00001 and therefore not significant. In the case of a bursty error channel, RT-MAC always performed better than IEEE 802.11 except for three cases where it was not different.
Rusty O. Baldwin
Chapter 6. Simulation Results
0.8
B
N
W
N
B
B
B
B
0.6
B
N
W
B
B
B
B
B
Offered Data Load (GN RT ) 0.4
B
N
B
B
B
B
B
B
0.2 W*
W
W
W
W
W
N
B
W
W
W
W
W
W
W
W
10
20
30
40
50
60
70
80
0.0
149
Legend With respect to IEEE 802.11
B N W *
Better Not Different Worse Determined by t-test
Stations (N)
Figure 6.52: Voice Mean Delay Performance Comparison - Ideal Channel (10 Mbps)
0.8
B
B
N
N
B
B
B
B
0.6
B
B*
N
B
B
B
B
B
Offered Data Load (GN RT ) 0.4 B*
N
B
B
B
B
B
B
N
N
N
N
N
N
B
B
0.0 B*
N
N
N
N
N
N
N
10
20
30
40
50
60
70
80
0.2
Legend With respect to IEEE 802.11
B N W *
Better Not Different Worse Determined by t-test
Stations (N)
Figure 6.53: Voice Mean Delay Performance Comparison - Bursty Error Channel (10 Mbps)
10 Sta - 802.11
10 Sta - RT-MAC
20 Sta - 802.11
20 Sta - RT-MAC
30 Sta - 802.11
30 Sta - RT-MAC
40 Sta - 802.11
40 Sta - RT-MAC
50 Sta - 802.11
50 Sta - RT-MAC
60 Sta - 802.11
60 Sta - RT-MAC
70 Sta - 802.11
70 Sta - RT-MAC
80 Sta - 802.11
80 Sta - RT-MAC
Missed Deadline Ratio (F )
10 Sta - 802.11
10 Sta - RT-MAC
20 Sta - 802.11
20 Sta - RT-MAC
30 Sta - 802.11
30 Sta - RT-MAC
40 Sta - 802.11
40 Sta - RT-MAC
50 Sta - 802.11
50 Sta - RT-MAC
60 Sta - 802.11
60 Sta - RT-MAC
70 Sta - 802.11
70 Sta - RT-MAC
80 Sta - 802.11
80 Sta - RT-MAC
Missed Deadline Ratio (F )
Rusty O. Baldwin Chapter 6. Simulation Results
1
0.9 0.8 0.7 0.6
0.5
0.4
0.3
0.2
0.1
0
0
0
0.8 0.6 0.4 0.2 Offered Data Load (G NRT )
Figure 6.54: Voice Missed Deadline Ratio - Ideal Channel (10 Mbps)
1
0.9
0.8
0.7
0.6
0.5
0.4
0.3
0.2
0.1
0
0.8 0.6 0.4 0.2 Offered Data Load (G NRT )
Figure 6.55: Voice Missed Deadline Ratio - Bursty Error Channel (10 Mbps)
150
Rusty O. Baldwin 6.3.2.6
Chapter 6. Simulation Results
151
10 Mbps Data Rate Missed Deadline Performance Summary
The maximum acceptable missed deadline ratio for voice traffic used in this research is F ≤ 0.10 (cf., Section 2.3.1). Figures 6.56–6.59 summarize the ability of IEEE 802.11 and RTMAC to meet this level of performance using a 10 Mbps channel. In the figures, areas to the left of the heavy line indicate areas where the maximum acceptable missed deadline ratio is not exceeded. As the legend in the figures indicate, “A” denotes acceptable performance, “M” indicates marginally acceptable performance, and “U” denotes unacceptable performance. For easy comparison, Figures 6.57 and 6.59 also circle the letters where RT-MAC performs better than IEEE 802.11. In no case did RT-MAC perform worse than IEEE 802.11 in terms of the summary performance measures “A”, “M”, or “U”. In Section 6.3.1.6, we speculated that the reason RT-MAC did not improve performance more when compared to IEEE 802.11 was due to the 1 Mbps channel data rate. The data obtained for the 10 Mbps channel seems to confirm this, especially considering the amount of GN RT that can be transmitted compared to IEEE 802.11. As a separate study, we discuss the maximum number of stations that can be supported using a 10 Mbps channel in Section 6.4.5.1.
6.3.2.7
Collisions
IEEE 802.11 and RT-MAC collision ratios are shown in Figures 6.60 and 6.61. As with the other traffic models, IEEE 802.11 collision ratio, C, increases rapidly with G and reaches a local maximum. As G increases further the collision ratio tends to stay relatively constant. As N increases, the starting value and the maximum value of the collision ratio increase as well. Hence, IEEE 802.11 collisions are highly influenced by both G and N. The RT-MAC collision ratio is very stable. As before, compared to IEEE 802.11, it is only slightly influenced by either G or N. In contrast to previous traffic models, however, RTMAC performs worse than IEEE 802.11 for N = 10 − 80; G = 0.0 and N = 10 − 50; G = 0.2
Rusty O. Baldwin
Chapter 6. Simulation Results
0.8
M
U
U
U
U
U
U
U
0.6
M
U
U
U
U
U
U
U
152
Legend Missed Deadline Ratio (F )
Offered Data Load 0.4 (GN RT )
A
0.2
A
A
A
A
A
A
M
U
0.0
A
A
A
A
A
A
A
A
10
20
30
40
50
60
70
80
A
U
U
U
U
U
U
U M A
F > 0.10, Unacceptable 0.05 ≤ F ≤ 0.10, Marginal F < 0.05, Acceptable
Stations (N)
Figure 6.56: Voice Missed Deadline Ratio Summary - Ideal Channel (IEEE 802.11, 10 Mbps)
�� �� �� ��
0.8
A
A
A
A
U
� � � � � � �� �� � �� �� �
U
U
U Legend
A
A
A
A
0.2
A
A
0.0
A
A
A
A
A
A
A
A
10
20
30
40
50
60
70
80
0.6 Offered Data Load 0.4 (GN RT )
A
A
U
U
U
U
A
A
A
U
U
U
A
A
A
A
A
A
�� �� � � � �� �� � ��
�� �� �� �� �� �� ��
Missed Deadline Ratio (F )
U M A
F > 0.10, Unacceptable 0.05 ≤ F ≤ 0.10, Marginal F < 0.05, Acceptable
� �Denotes improvement
compared to IEEE 802.11
Stations (N)
Figure 6.57: Voice Missed Deadline Ratio Summary - Ideal Channel (RT-MAC, 10 Mbps)
Rusty O. Baldwin
Chapter 6. Simulation Results
0.8
M
U
U
U
U
U
U
U
0.6
M
U
U
U
U
U
U
U
153
Legend Missed Deadline Ratio (F )
Offered Data Load 0.4 (GN RT )
A
M
U
U
U
U
U
U
0.2
A
A
A
A
A
M
U
U
0.0
A
A
A
A
A
A
A
A
10
20
30
40
50
60
70
80
U M A
F > 0.10, Unacceptable 0.05 ≤ F ≤ 0.10, Marginal F < 0.05, Acceptable
Stations (N)
Figure 6.58: Voice Missed Deadline Ratio Summary - Bursty Error Channel (IEEE 802.11, 10 Mbps)
�� �� �� ��
0.8 0.6 Offered Data Load 0.4 (GN RT )
A
A
A
A
U
U
� � � � � � �� �� � �� �� �
A
U Legend
A
A
M
U
U
U
U
A
A
A
A
U
U
U
�� � � � � � � �� �� �� ��
A
U
�� �� �� �� �� �� ��
0.2
A
A
A
A
A
A
A
A
0.0
A
A
A
A
A
A
A
A
10
20
30
40
50
60
70
80
�� �� ��
Missed Deadline Ratio (F )
U M A
F > 0.10, Unacceptable 0.05 ≤ F ≤ 0.10, Marginal F < 0.05, Acceptable
� �Denotes improvement
compared to IEEE 802.11
Stations (N)
Figure 6.59: Voice Missed Deadline Ratio Summary - Bursty Error Channel (RT-MAC, 10 Mbps)
Rusty O. Baldwin
Chapter 6. Simulation Results
154
for the ideal channel and with N = 10 − 80; G = 0.0 and N = 10; G = 0.2 for the bursty channel. This is shown in summary form in Figures 6.62 and 6.63. In terms of the magnitude of the collision ratio, IEEE 802.11 tends to range between 0.01 and 0.02 with RT-MAC being roughly twice that (i.e., 0.02 to 0.04). Given the previous performance of the RT-MAC enhanced collision avoidance algorithm (ECA), this change is curious. Before discussing the areas investigated to determine the cause for this collision performance, we list some aspects of IEEE 802.11 and RT-MAC collision behavior that have been previously noted. • A reduction in collisions was noted for a given IEEE 802.11 or RT-MAC network when the channel rate was increased from 1 Mbps to 10 Mbps. • IEEE 802.11 collisions were less that RT-MAC as noted in Figures 6.62 and 6.63 • Using the data collected in Section 6.4.5.1 to determine the maximum N that can be supported it was found that for N = 130, GN RT = 0.0 the collision ratios of IEEE 802.11 and RT-MAC were comparable. • For N = 130, GN RT = 0.2 and N = 140, GN RT = 0.0 the collision ratio of IEEE 802.11 was about 0.53 while RT-MAC was about 0.08.
Three areas were investigated to determine the cause for this collision performance: (1) differences in the way RT-MAC and IEEE 802.11 treat packets that arrive to an idle channel, (2) the range of backoff values used for the next backoff value (BV), and (3) the data being transported and the nature of its arrival including queueing behavior. If an IEEE 802.11 station is not in backoff (cf., Section 2.2.3.1) and a packet arrives to an empty queue it will be transmitted immediately (assuming an idle channel). In order to reduce to possibility of collisions among stations with simultaneous arrivals, RT-MAC will, in this situation, choose a backoff value rather than immediately transmit the packet (cf.,
Rusty O. Baldwin
Chapter 6. Simulation Results
155
Section 5.2). This behavior was changed to reflect the IEEE 802.11 algorithm with negligible effect. To investigate the second area, rather than choose the next BV from the range [0, CWmin], RT-MAC was modified to choose from [0, 3N]. The supposition being that perhaps the advertisement of the backoff values for the voice data was ineffective (due to the rapid packet transmission of the 10 Mbps channel) and that a wider contention window would reduce collisions. This, too, had a negligible effect on RT-MAC performance. For the third area investigated, note that the voice packets arrive every 20 ms when the voice source is on and transmission time for a voice packet is about 0.17 ms. No instance of more than one voice packet awaiting transmission was observed for either an IEEE 802.11 or RT-MAC network. That is, the current voice packet was always transmitted prior to the next packet arriving. Therefore, queued packets could not be a cause of the behavior. Additionally, simulations were run using Poisson arrivals as also used in the avionics traffic model. In those simulations, RT-MAC had a higher collision ratio at low offered loads as well. Therefore, it appears that the increase in collisions is not sensitive to the arrival patterns tested. Another rather obvious source for this increase in collisions is an implementation error in the protocol algorithm. This possibility was diligently investigated and while it cannot be ruled out, seems unlikely. Hence, we note the behavior and must leave it as an area for further investigation.
10 Sta - 802.11
10 Sta - RT-MAC
20 Sta - 802.11
20 Sta - RT-MAC
30 Sta - 802.11
30 Sta - RT-MAC
40 Sta - 802.11
40 Sta - RT-MAC
50 Sta - 802.11
50 Sta - RT-MAC
60 Sta - 802.11
60 Sta - RT-MAC
70 Sta - 802.11
70 Sta - RT-MAC
80 Sta - 802.11
80 Sta - RT-MAC
0.25
0.20
0
0
0.2
0.2
0.4
0.4
0.6
0.30
0.25
0.20
0.6
Collision Ratio (C )
0.30
Collision Ratio (C )
10 Sta - 802.11
10 Sta - RT-MAC
20 Sta - 802.11
20 Sta - RT-MAC
30 Sta - 802.11
30 Sta - RT-MAC
40 Sta - 802.11
40 Sta - RT-MAC
50 Sta - 802.11
50 Sta - RT-MAC
60 Sta - 802.11
60 Sta - RT-MAC
70 Sta - 802.11
70 Sta - RT-MAC
80 Sta - 802.11
80 Sta - RT-MAC
Rusty O. Baldwin Chapter 6. Simulation Results 156
0.50
0.45
0.40
0.35
0.15
0.10
0.05
0.8 0.00
Offered Data Load (G NRT )
Figure 6.60: Voice Collision Ratio - Ideal Channel (10 Mbps)
0.50
0.45
0.40
0.35
0.15
0.10
0.05
0.8
0.00
Offered Data Load (G NRT )
Figure 6.61: Voice Collision Ratio - Bursty Error Channel (10 Mbps)
Rusty O. Baldwin
Chapter 6. Simulation Results
0.8
B
B
B
B
B
B
B
B
0.6
B
B
B
B
B
B
B
B
Offered Data Load (GN RT ) 0.4
B
B
B
B
B
B
B
B
0.2
W
W
W
W
W
B
B
B
0.0
W
W
W
W
W
W
W
W
10
20
30
40
50
60
70
80
157
Legend With respect to IEEE 802.11
B N W *
Better Not Different Worse Determined by t-test
Stations (N)
Figure 6.62: Voice Collision Ratio Performance Comparison - Ideal Channel (10 Mbps)
0.8
B
B
B
B
B
B
B
B
0.6
B
B
B
B
B
B
B
B
Offered Data Load (GN RT ) 0.4
B
B
B
B
B
B
B
B
0.2
W
N
B
B
B
B
B
B
0.0
W
W
W
W
W
W
W
W
10
20
30
40
50
60
70
80
Legend With respect to IEEE 802.11
B N W *
Better Not Different Worse Determined by t-test
Stations (N)
Figure 6.63: Voice Collision Ratio Performance Comparison - Bursty Error Channel (10 Mbps)
Rusty O. Baldwin
6.4
Chapter 6. Simulation Results
158
Other Simulations Studies
6.4.1
RT-MAC Enhancements Study
Originally, three enhancements were proposed to IEEE 802.11 (cf., Section 4.1.1)—an EDF service discipline, a transmission control (TC) algorithm, and an enhanced collision avoidance (ECA) algorithm. The purpose of this simulation study was to establish the relative effect on the performance metrics of these enhancements in isolation and in all possible combinations. The question this simulation study seeks to answer is whether one enhancement alone provides the best improvement in a particular performance metric, or whether a combination of the three enhancements provides the best improvement. For instance, it may be found that collisions are reduced the most when both the ECA and the TC algorithms are enabled, rather than when the ECA alone is enabled. We may then conclude that the TC control algorithm helps to reduce collisions as well (presumably by a reduction in packet transmissions). Conversely, it may be found that enhancements in combination degrade performance. The network employed throughout this study uses an ideal channel with the avionics traffic model and N = 40, G = 0.7. This network was chosen since it provided a traffic model with deadlines which are drawn from a normal distribution and therefore might benefit from an EDF service discipline, as well as having a large number of stations to induce collisions. Figure 6.64 shows the mean results obtained by this study. As with the previous simulations, five replications were performed. Each combination of enhancements are compared to three “reference” networks: IEEE 802.11, RT-MAC, and the enhancement plus an EDF service discipline. For example, if the network is simulated with only the ECA algorithm running, those results are compared to an IEEE 802.11 network, an RT-MAC network, and a network with ECA and the EDF service discipline.
Rusty O. Baldwin
Chapter 6. Simulation Results
159
0.7 0.6 0.5 0.4 0.3 0.2 0.1 0.0
Normalized Throughput (S)
Mean Delay (sec) (D)
Missed Deadline Ratio (F)
Collision Ratio (C)
TC/ECA/EDF
0.6937
0.0388
0.0062
0.0091
ECA/EDF
0.6977
0.0415
0.0074
0.0092
TC/EDF
0.6868
0.0310
0.0120
0.0756
TC/ECA (RT-MAC)
0.6918
0.0384
0.0069
0.0091
Transmission Control (TC) only
0.6858
0.0313
0.0127
0.0774
Earliest-Deadline-First (EDF) only
0.6325
11.2508
0.6878
0.3136
Enhanced Collision Avoidance (ECA) only
0.6948
0.0410
0.0079
0.0096
NONE (IEEE 802.11)
0.6421
10.8162
0.5928
0.2879
Figure 6.64: RT-MAC Enhancements Study Mean Results 6.4.1.1
Throughput
Figure 6.65 shows the results in terms of the throughput performance metric. As with previous simulations, the means and corresponding CIs were used to arrive at a statistical comparison of the reference systems (cf., Section C.1). Any combination of the proposed enhancements performed better than IEEE 802.11 in terms of throughput except for EDF which was not different. When compared to a network using the proposed enhancement and the EDF service discipline, no difference in terms of throughput was found. With respect to an RT-MAC network, any combination of enhancements either performed worse or were not different. One exception was the ECA/EDF network which had a higher throughput than RT-MAC. By inspecting the mean throughput, however, it can be seen that the performance advantage was not exceptional (0.6977 vs. 0.6918).
Rusty O. Baldwin
Chapter 6. Simulation Results
TC/ECA/EDF
B
—
N
ECA/EDF
B
—
B*
B
—
160
Legend
TC/EDF
Enhancements Enabled
TC/ECA (RT-MAC) TC
B
B
N
N*
W*
—
W*
EDF
N
—
W
ECA
B
N
N
NONE (IEEE 802.11)
—
N
W
With respect to Reference Network
B N W * TC ECA EDF —
Better Not Different Worse Determined by t-test Transmission Control Enhanced Collision Avoidance Earliest-Deadline-First Not Applicable
IEEE Enhan- RT-MAC 802.11 cement w/EDF Reference Network Figure 6.65: RT-MAC Enhancements Study Throughput Performance Comparison
Rusty O. Baldwin 6.4.1.2
Chapter 6. Simulation Results
161
Mean Delay
Mean delay performance is shown in Figure 6.66. As with throughput, any combination of the proposed enhancements performed better than IEEE 802.11 in terms of mean delay except for EDF which was not different. When compared to a network using the proposed enhancement and the EDF service discipline, no difference in terms of mean delay was found. For an RT-MAC network, the results varied. The TC/EDF and the TC network were better than RT-MAC. All others were either not different or worse. Thus far, then, we see that the EDF service discipline does not provide any advantage with respect to throughput or mean delay. Given that EDF is only a reordering of packets, this is not unexpected. Note also that the TC algorithm alone (or with EDF) provides a better mean delay than RT-MAC. This too could have been predicted given that the ECA algorithm works by delaying pending transmissions. Evidently, the resulting increase in collisions is not of such a magnitude that it greatly affects the mean delay.
6.4.1.3
Missed Deadline
Missed deadline performance is shown in Figure 6.67. Again, any combination of the proposed enhancements performed better than IEEE 802.11 in terms of missed deadline except for EDF which was worse. This worse performance of EDF may be due to the retransmission scheme of IEEE 802.11. With a FCFS discipline, a packet with a deadline far in the future might possibly meet its deadline even when retransmitted. And while packets behind it may be late due to this, the currently transmitted packet, at least, was on time. With a EDF discipline, it is conceivable that the packet being retransmitting (say, Packet A) has already missed its deadline and during the retransmission Packet B (whose deadline is next) also misses its deadline. When Packet B is being transmitted, it may cause the next packet to miss its deadline and so on. Since the packets are in an EDF order, it may be a while before a packet that has not missed its deadline is reached. Therefore, a purely EDF service discipline may be a disadvantage in a multiple access network. Obviously, the preceding
Rusty O. Baldwin
Chapter 6. Simulation Results
TC/ECA/EDF
B
—
N
ECA/EDF
B
—
W
B
—
162
Legend
TC/EDF
Enhancements Enabled
TC/ECA (RT-MAC) TC
B
B
N
N
B
—
B
EDF
N
—
W
ECA
B
N
W
NONE (IEEE 802.11)
—
N
W
With respect to Reference Network
B N W * TC ECA EDF —
Better Not Different Worse Determined by t-test Transmission Control Enhanced Collision Avoidance Earliest-Deadline-First Not Applicable
IEEE Enhan- RT-MAC 802.11 cement w/EDF Reference Network Figure 6.66: RT-MAC Enhancements Study Mean Delay Performance Comparison
Rusty O. Baldwin
Chapter 6. Simulation Results
163
conjecture needs to be studied further before a firm conclusion on the observed behavior can be reached. The RT-MAC network was better than all of the combinations except for the RT-MAC network with EDF (i.e., TC/ECA/EDF). As with the throughput metric, the magnitude of this improvement was not exceptional (0.0062 vs. 0.0068).
6.4.1.4
Collisions
Figure 6.68 shows the collision performance. Any combination of the proposed enhancements performed better than IEEE 802.11 except for EDF. Given that EDF only involves a reordering of the packets, it is not clear why EDF performance was worse in this area. With respect to an EDF service discipline, performance was either not different or in the case of a TC, performance was worse. The RT-MAC network was better than all of the combinations or in the case of ECA/EDF and TC/ECA/EDF, RT-MAC was not different.
6.4.1.5
Summary
Based on the above results, the EDF service discipline was not included in RT-MAC in favor of a FCFS discipline. There were several reasons for this. First, on each station in the network, a single application is assumed to be providing the entire offered load. Most applications require either an in-order delivery or a reordering on the receiving station. Second, the performance advantage gained by using the EDF service discipline was only evident in the missed deadline case—and it was not an exceptional improvement. Third, FCFS is easier to realize in an actual implementation. This being said, it still remains to be determined whether a significant performance improvement in terms of missed deadlines could be achieved by using a service discipline other than FCFS for stations with multiple applications. In this scenario, the relative ordering of the packets within an particular application would remain the same, but one application might
Rusty O. Baldwin
Chapter 6. Simulation Results
TC/ECA/EDF
B
—
B
ECA/EDF
B
—
W
B
—
164
Legend
TC/EDF
Enhancements Enabled
TC/ECA (RT-MAC) TC
B
B
W
W
W
—
W
EDF
W
—
W
ECA
B
W
W
NONE (IEEE 802.11)
—
B
W
With respect to Reference Network
B N W * TC ECA EDF —
Better Not Different Worse Determined by t-test Transmission Control Enhanced Collision Avoidance Earliest-Deadline-First Not Applicable
IEEE Enhan- RT-MAC 802.11 cement w/EDF Reference Network Figure 6.67: RT-MAC Enhancements Study Missed Deadline Performance Comparison
Rusty O. Baldwin
Chapter 6. Simulation Results
TC/ECA/EDF
B
—
N
ECA/EDF
B
—
N
B
—
165
Legend
TC/EDF
Enhancements Enabled
TC/ECA (RT-MAC) TC
B
B
N
W
W
—
W
EDF
W
—
W
ECA
B
N*
W
NONE (IEEE 802.11)
—
B
W
With respect to Reference Network
B N W * TC ECA EDF —
Better Not Different Worse Determined by t-test Transmission Control Enhanced Collision Avoidance Earliest-Deadline-First Not Applicable
IEEE Enhan- RT-MAC 802.11 cement w/EDF Reference Network Figure 6.68: RT-MAC Enhancements Study Collision Performance Comparison
Rusty O. Baldwin
Chapter 6. Simulation Results
166
get priority service over another application because it meets the service discipline criteria (i.e., earliest deadline, shortest job, etc.). In Section 6.4.3, different service disciplines were studied for stations running a single application where out of order delivery was permitted. Stations with multiple applications which require in-order delivery is left for future study. Given that FCFS has been adopted, we conclude that the combination of TC and ECA provides the best overall performance. Further, TC and ECA do not interfere with each other, rather, in all areas except mean delay, they perform better in when used together. The reason why mean delay performance is worse is probably due to the static contention window expansion used in the ECA algorithm. The static CW has been discussed above in Sections 6.1 and 6.2. It will be explored further in Section 6.4.4.
6.4.2
Contention Window Expansion Study
As discussed in Section 5.2, the enhanced collision algorithm (ECA) has two components: (1) a expansion of the contention window (CW), and (2) transmitting a station’s next backoff value. The purpose of this study was to establish that both components contributed to a reduction in collisions. This is similar in purpose to the study in Section 6.4.1. For this study, the network employed uses an ideal channel with the telemetry traffic model and N = 10, 50; G = 0.7. This network was chosen since it would have a large number of collisions. Since the contention window expansion is a function of N, two values of N were selected to observe the behavior for a small and a large station network. The contention window is also a function of the channel data rate and therefore the simulations were performed for both a 1 and 10 Mbps data rate. Figure 6.69 shows the collision ratios for a 10 and 50 station network with CW expansion only and CW expansion in addition to transmitting the next backoff value for the 1 Mbps channel. For reference, the IEEE 802.11 values are also shown. The results and statistical analysis clearly show that both the CW expansion and transmission of a station’s next backoff values contribute to the collision reduction. The results for the 10 Mbps channel were statistically
Rusty O. Baldwin
Chapter 6. Simulation Results
167
0.4
0.35
Collision Ratio (C )
0.3
0.25
0.2
0.15
0.1
0.05
0 10 Station
50 Station
Transmit Next Backoff Value and CW Expansion CW Expansion Only IEEE 802.11
Figure 6.69: Contention Window Study Results - Collision Ratio not different when compared to the 1 Mbps channel and therefore the same conclusion holds for the 10 Mbps channel collision ratios as well.
6.4.3
Service Disciplines Study
As discussed in Section 6.4.1.5, the purpose of this study was to determine the effect of different service disciplines for stations transmitting data from a single application where out-of-order delivery was permitted. The service disciplines used were: earliest-deadline-first (EDF), first-come-first-served (FCFS), random, last-come-first-served (LCFS), shortest-jobfirst (SJF), and longest-job-first (LJF). The network parameters used in this study are the same as the IEEE 802.11 avionics traffic model using an ideal channel (cf., Table 4.4) with the following exceptions: N = 40, G = 0.95, 0% of late packets were resubmitted for later transmission, and the packet size was drawn from a geometric distribution with a mean of 775 bytes. The packet size was varied so that the SJF and LJF service discipline could be studied and a high offered load was chosen to help ensure the stations transmission buffers
Rusty O. Baldwin
Chapter 6. Simulation Results
168
always had packets to transmit. Figure 6.70 shows the mean results of the simulations. Note that the y-axis stops at 1.0. Since all the mean delays were greater than 1.0, refer to the table below the graph for those values. As would be expected, there were no significant differences in the collision ratio for the different service disciplines. Throughput was generally no different except that it was better for a LJF discipline and worse for a SJF discipline. This is because if a packet is transmitted successfully, the longer packets would tend to result in a higher throughput due to the lower overhead. Conversely, short packets have a higher overhead. The best performance in terms of mean delay and missed deadlines is clearly LCFS with SJF being next. In terms of missed deadlines only, LJF was next in terms of performance. Interestingly, for this network EDF was statistically worse than any other service discipline in terms of missed deadlines. Thus, our initial premise that an EDF service discipline would reduce the number of missed deadlines (cf., Section 4.1.1) is not supported by this data. Therefore, while it has long been known that the EDF service discipline is optimal with respect to meeting computing deadlines [LL73], this does not seem to hold with multiple access communications systems. We speculate that this is because with computing tasks, the computer system will always successfully perform the computation (though not necessarily on time), while in a multiple access communication system, the “task” (i.e., packet transmission) may need to be repeated due to failures from collisions or bit errors. Further, these errors can greatly reduce the utilization of the transmission channel which further degrades the ability of the communication system to meet deadlines.
6.4.4
Networks with RT-MAC and IEEE 802.11 Stations
The purpose of this study was to investigate how RT-MAC performs within mixed networks; those with both RT-MAC and IEEE 802.11 stations. In this study, the telemetry and avionics traffic models were used (cf., Table 4.4). Each simulation looked at six different network configurations: (1) a network with 100% RT-MAC stations, (2) a 20/80% IEEE 802.11/RT-
Rusty O. Baldwin
Chapter 6. Simulation Results 1.0 0.9 0.8 0.7 0.6 0.5 0.4 0.3 0.2 0.1 0.0
Normalized Throughput (S)
Mean Delay (sec) (D)
Missed Deadline Ratio (F)
Collision Ratio (C)
EDF
0.520
32.164
0.985
0.361
FCFS
0.519
31.749
0.984
0.361
Random
0.518
25.506
0.967
0.362
LCFS
0.518
3.172
0.690
0.362
SJF
0.503
6.587
0.771
0.359
LJF
0.557
26.495
0.890
0.363
169
Figure 6.70: Service Disciplines Study Results MAC station network, (3) a 40/60% IEEE 802.11/RT-MAC station network, (4) a 60/40% IEEE 802.11/RT-MAC station network, (5) a 80/20% IEEE 802.11/RT-MAC station network, and (6) a 100% IEEE 802.11 station network. These configurations were chosen on the supposition that there may be a point where RT-MAC provided no useful benefit due to a large proportion of IEEE 802.11 stations. The data (including confidence intervals) upon which the following figures were based may be found in Section B.4.
6.4.4.1
Telemetry Traffic Model
Recall that the telemetry traffic model was used to stress the network due to the high overhead that it induced (Section 6.1). Using this traffic model, offered loads of G = 0.3, 0.9 (with N = 20) were simulated to see if the amount of traffic on the channel might also be a factor which affects performance. Figure 6.71 shows the results of the simulation for G = 0.9. In the figure, the four performance metrics are shown: throughput, mean delay, missed deadline ratio, and collision ratio. For reference, the left-most side of a graph shows
Rusty O. Baldwin
Chapter 6. Simulation Results RT-MAC/IEEE Network Throughput (S )
170
RT-MAC/IEEE Network Mean Delay (sec) (D )
0.36
10
0.35 1 Telemetry Traffic Model 20 Station, 0.1 0.9 Load (Log Scale) 0.01
0.34 Telemetry Traffic Model 0.33 20 Station, 0.32 0.9 Load 0.31 0.30 0.29 RT-MAC
20% IEEE
40% IEEE
60% IEEE
80% IEEE
100% IEEE
Throughput 0.299733 0.298753 0.359296 0.318002 0.312501 0.307812
0.001 RT-MAC
RT-MAC/IEEE Network Missed Deadline Ratio (F )
40% IEEE
60% IEEE
80% IEEE
100% IEEE
RT-MAC/IEEE Network Collision Ratio (C )
1.00
Telemetry Traffic Model 20 Station, 0.9 Load
20% IEEE
Mean Delay 0.007824 0.008482 0.019417 6.720084 10.42958 7.111742
0.27
0.95
0.24
0.90
0.75
0.21 Telemetry Traffic Model 0.18 20 Station, 0.15 0.9 Load 0.12
0.70
0.09
0.85 0.80
0.65
0.06
0.60 RT-MAC
20% IEEE
40% IEEE
60% IEEE
80% IEEE
Missed Deadline Ratio 0.609798 0.629498 0.726492 0.995155 0.998102
100% IEEE 1
0.03 RT-MAC
20% IEEE
40% IEEE
60% IEEE
80% IEEE
100% IEEE
Collision Ratio 0.037695 0.066685 0.121002 0.190738 0.230582 0.256375
Figure 6.71: Mixed RT-MAC/IEEE 802.11 Network, G = 0.9 the 100% RT-MAC network performance while the right-most side of a graph shows the 100% IEEE 802.11 network performance. In the cases of throughput, mean delay and missed deadline ratios, the 40/60% network is the point at which the benefit provided by RT-MAC is overcome by the population of IEEE 802.11 stations. Significantly though, in terms of collisions, RT-MAC reduced collisions even when the mix was as high as 80/20%. The large increase in throughput at the 40/60% point is due to the IEEE 802.11 stations using a CW range of [0-31] for their BVs while the RT-MAC stations are using a CW range of [0-159]. Thus, the channel is being utilized more often by the IEEE 802.11 stations. Beyond this point, the throughput decreases due to an increase in collisions. The same network was tested with G = 0.3. Using this load, even the IEEE 802.11 network was able to meet almost all deadlines. Figure 6.72 shows the results of this simulation. As before, the four performance metrics are shown. The conclusion to draw from these graphs is that even with a low offered load, using RT-MAC shows an improvement in the performance metrics. Further, the degradation in the performance metrics as the ratio of IEEE 802.11
Rusty O. Baldwin
Chapter 6. Simulation Results RT-MAC/IEEE Network Throughput (S )
171
RT-MAC/IEEE Network Mean Delay (ms) (D )
0.2860
20.0
0.2855
Telemetry 19.0 Traffic Model 20 Station, 18.5 0.3 Load 18.0
19.5
Telemetry Traffic Model 20 Station, 0.2850 0.3 Load
0.2845
17.5 0.2840
RT-MAC
20% IEEE
40% IEEE
60% IEEE
80% IEEE
17.0
100% IEEE
Throughput 0.284932 0.284881 0.284887 0.284867 0.284833 0.285005
RT-MAC Mean Delay 17.3728
RT-MAC/IEEE Network Missed Deadline Ratio (F )
20% IEEE
40% IEEE
60% IEEE
80% IEEE
100% IEEE
18.7166
18.8212
19.0726
19.3928
19.8538
80% IEEE
100% IEEE
RT-MAC/IEEE Network Collision Ratio (C )
0.0016
0.15
0.0014
0.13
Telemetry 0.0012 Traffic Model 0.0010 20 Station, 0.3 Load 0.0008
Telemetry 0.11 Traffic Model 0.09 20 Station, 0.3 Load
0.0006
0.07 0.05
0.0004 0.0002 RT-MAC
20% IEEE
40% IEEE
60% IEEE
80% IEEE
100% IEEE
Missed Deadline Ratio 0.00031 0.00049 0.00055 0.00073 0.00114 0.00149
0.03 RT-MAC
20% IEEE
40% IEEE
60% IEEE
Collision Ratio 0.033217 0.05452 0.080757 0.103849 0.132348 0.147892
Figure 6.72: Mixed RT-MAC/IEEE 802.11 Network, G = 0.3 stations increase is quite linear. So virtually any amount of RT-MAC stations in the network provides a benefit.
6.4.4.2
Avionics Traffic Model
As a further test for mixed networks the avionics traffic model was used with G = 0.9 and N = 40. Those results are shown below in Figure 6.73. The same observations made about the simulations using the telemetry traffic model above can be made here. Note that with the avionics model, though, the network does not begin to degrade significantly until the percentage of IEEE 802.11 stations is 60%. Note also that the mean delay actually improved as IEEE 802.11 stations were added. Further, the missed deadline ratio improved slightly as well. These improvements are most likely due to the CW expansion in RT-MAC (cf., Section 5.2). For this size network, the initial IEEE 802.11 CW ranges from [0-31], where the initial CW for an RT-MAC station ranges from [0-319]. This expanded CW would likely lead to a longer delay for packets. To confirm this, the same load and traffic model were
Rusty O. Baldwin
Chapter 6. Simulation Results RT-MAC/IEEE Network Throughput (S )
172
RT-MAC/IEEE Network Mean Delay (sec) (D )
0.85
0.25
0.80
0.2
Avionics Traffic Model 40 Station, 0.15 0.9 Load (Log Scale)
Avionics Traffic Model 0.75 40 Station, 0.70 0.9 Load
0.1
0.65 0.60 RT-MAC
20% IEEE
40% IEEE
60% IEEE
80% IEEE
100% IEEE
Throughput 0.807836 0.809444 0.805844 0.801312 0.700271 0.602197
0.05
RT-MAC
20% IEEE
40% IEEE
60% IEEE
80% IEEE
100% IEEE
Mean Delay 0.124105 0.107125 0.09316 0.080157 6.12594 27.06137
RT-MAC/IEEE Network Missed Deadline Ratio (F )
RT-MAC/IEEE Network Collision Ratio (C ) 0.40
1.00
0.35 0.80
Avionics Traffic Model 40 Station, 0.9 Load
0.30
Avionics 0.25 Traffic Model 0.20 40 Station, 0.9 Load 0.15 0.10
0.60 0.40 0.20
0.05 0.00
RTMAC
20% IEEE
40% IEEE
60% IEEE
80% 100% IEEE IEEE
Missed Deadline Ratio 0.1104 0.0977 0.1011 0.1129 0.8424 0.9779
0.00 RT-MAC
20% IEEE
40% IEEE
60% IEEE
80% IEEE
100% IEEE
Collision Ratio 0.025764 0.032007 0.040234 0.055583 0.221627 0.366775
Figure 6.73: Mixed RT-MAC/IEEE 802.11 Network, Avionics Traffic Model simulated with N = 5. Using this network, the RT-MAC CW would be [0-39], very close to the IEEE 802.11 CW of [0-31]. Figure 6.74 seems to confirm this. Note that the magnitude of the slope of the mean delay, while still negative (i.e., improving), is less than before. The missed deadline ratio slope has changed from a slightly negative slope, indicating better performance as IEEE 802.11 stations are added, to a positive slope, indicating worse performance as IEEE 802.11 stations are added. These simulation results also highlight that the static initial CW expansion algorithm used ˆ should likely be is less than optimum. That is, the initial CW value used, (2 + b √6R c)N, changed to a dynamically varying CW depending on the number of stations as well as the load (e.g., [BFO96]). Further indications that the fixed initial CW expansion fails to provide optimum performance can be seen in Section 6.3.2 above where the channel data rate is increased to 10 Mbps. Overall, however, these simulations show that RT-MAC is very robust. It will improve most
Rusty O. Baldwin
Chapter 6. Simulation Results RT-MAC/IEEE Network Throughput (S )
RT-MAC/IEEE Network Mean Delay (sec) (D )
0.85
0.25
0.83
0.20
Avionics 0.81 Traffic Model 5 Station, 0.79 0.9 Load 0.77
Avionics Traffic Model 0.15 5 Station, 0.9 Load 0.10
0.75 RT-MAC 20% IEEE 40% IEEE 60% IEEE 80% IEEE
100% IEEE
Throughput 0.824717 0.820761 0.815349 0.804522 0.794622 0.755053
0.05 RT-MAC
20% IEEE
40% IEEE
60% IEEE
80% IEEE
100% IEEE
Mean Delay 0.1218956 0.1163728 0.1070602 0.1042042 0.2856684 5.9169308
RT-MAC/IEEE Network Missed Deadline Ratio (F )
RT-MAC/IEEE Network Collision Ratio (C ) 0.10
1.00
Avionics Traffic Model 5 Station, 0.9 Load
173
0.80
0.08
0.60
0.06 Avionics Traffic Model 0.04 5 Station, 0.9 Load 0.02
0.40 0.20
0.00
0.00 RT-MAC
20% IEEE
40% IEEE
60% IEEE
80% IEEE
100% IEEE
Missed Deadline Ratio 0.074192 0.080209 0.084175 0.097539 0.320372 0.979172
RT-MAC
20% IEEE
40% IEEE
60% IEEE
80% IEEE
100% IEEE
Collision Ratio 0.018531 0.022097 0.027486 0.036286 0.058624 0.07897
Figure 6.74: Mixed RT-MAC/IEEE 802.11 Network, Avionics Traffic Model, 5 Stations performance metrics even when a significant portion of the network is not using the RT-MAC protocol.
6.4.5
Static BER Study
The purpose of this study was to observe how a network performs in a static BER environment as well provide a basis of comparison (however informal) between static and bursty BER models. In this study, the voice with non real-time data traffic model (cf., Section 6.3) with N = 14, GN RT = 0.0, 0.2, 0.4, 0.6, 0.8 and a 1 Mbps data rate is used. Three channel error models were investigated: (a) a static model with BER 1 × 10⁻⁵ , (b) a static model with BER 1 × 10⁻³ , and (c) the bursty error model (cf., Section 4.5.3). Simulations were run for both the IEEE 802.11 and RT-MAC networks. While there were differences between the IEEE 802.11 and RT-MAC networks performance, the effect of the different error models on the networks was similar. Therefore, for the sake of clarity in discussion and the figures, only the results of the RT-MAC simulations will be presented. Simulation data for both
Rusty O. Baldwin
Chapter 6. Simulation Results
174
1.00E+00
1.00E-01
1.00E-02 BER 1.00E-03
1.00E-04
1.00E-05
GNRT=0.0
GNRT=0.2
GNRT=0.4
GNRT=0.6
GNRT=0.8
BER=1E-3
1.68E-03
1.42E-03
1.28E-03
1.20E-03
1.19E-03
BER=1E-5
1.62E-05
1.40E-05
1.30E-05
1.24E-05
1.16E-05
Bursty
3.05E-02
1.84E-02
1.93E-02
1.68E-02
1.67E-02
Figure 6.75: Static BERs RT-MAC and IEEE 802.11 networks can be found in Appendix B. Figure 6.75 shows the BERs for the three different error models. The largest BER in terms of magnitude is the bursty error model. This model is described in Sections 2.3.2 and 4.5.3. While Figure 6.75 shows the raw BER, it is the packet error rate (PER) which has a larger influence on the performance of the network. This is because whether there is a single bit error in a packet or one hundred, the packet is discarded. The PER of the three different error models are shown in Figure 6.76. Note the similarity in PERs for the 1 × 10⁻⁵ model and the bursty model. This similarity will be seen to carry over to the different performance metrics as well. Figures 6.77–6.80 show the throughput, mean delay, missed deadline ratio, and collision ratio performance metrics for the three different error models. In terms of throughput and missed deadlines performance, the 1 × 10⁻³ model is clearly the worst as would be expected. In terms of mean delay and collision, however, it often performs better than the other two models. This is easily explained by the way in which these performance metrics are counted. Mean delay is determined by the aggregate delay of successfully transmitted packets. Packets
Rusty O. Baldwin
Chapter 6. Simulation Results
175
1.00E+00
1.00E-01
Packet Error Rate (PER) (Log Scale)
1.00E-02
1.00E-03
GNRT=0.0
GNRT=0.2
GNRT=0.4
GNRT=0.6
GNRT=0.8
BER=1E-3
6.51E-01
6.97E-01
7.52E-01
8.23E-01
8.37E-01
BER=1E-5
1.02E-02
1.45E-02
1.80E-02
2.54E-02
2.68E-02
Bursty
2.25E-02
1.74E-02
1.81E-02
1.73E-02
1.77E-02
Figure 6.76: Static BER, Packet Error Rate that are never successfully transmitted due to errors do not contribute to mean delay since their delay is infinite. The performance in terms of the collision ratio is similar (though the 1 × 10⁻³ model is statistically better in most cases). This is due to the transmission control algorithm in RT-MAC which discards late packets rather than transmit them. Since many of the packets in a high BER environment will need to be retransmitted, it is probable that many will be discarded due to a missed deadline rather than retransmitted. More interesting is the almost identical performance of the 1 × 10⁻⁵ model and the bursty error model across all performance metrics. The data seems to indicate that the bursty error model and the static model are almost identical in terms of the measured metrics. If, however, the error models were compared on the basis of metrics that were not measured such as mean queue length, channel access delay, transmission queue throughput and others, differences would undoubtedly be manifest. With respect to simulation efficiency, the bursty error model is more desirable since large blocks of error-free periods occur where error calculations do not need to be made, thus reducing simulation time. In light of these simulations, therefore, we conclude that: (1) RT-MAC performance in a
Rusty O. Baldwin
Chapter 6. Simulation Results
176
0.70
0.60
0.50
0.40 Throughput (S ) 0.30
0.20
0.10
0.00
GNRT=0.0
GNRT=0.2
GNRT=0.4
GNRT=0.6
GNRT=0.8
BER=1E-3
0.0944
0.0787
0.0609
0.0408
0.0375
BER=1E-5
0.1887
0.3770
0.5264
0.6153
0.6271
Bursty
0.1819
0.3770
0.5339
0.6275
0.6351
Figure 6.77: Static BER, Throughput
10.00
1.00 Mean Delay (sec) (D ) (Log Scale)
0.10
0.01
GNRT=0.0
GNRT=0.2
GNRT=0.4
GNRT=0.6
GNRT=0.8
BER=1E-3
0.10
0.11
0.13
0.54
3.39
BER=1E-5
0.02
0.03
0.22
1.75
8.45
Bursty
0.02
0.03
0.23
1.71
8.48
Figure 6.78: Static BER, Mean Delay
Rusty O. Baldwin
Chapter 6. Simulation Results
177
1.00 0.90 0.80 0.70 0.60 Missed Deadline Ratio (F )
0.50 0.40 0.30 0.20 0.10 0.00
GNRT=0.0
GNRT=0.2
GNRT=0.4
GNRT=0.6
GNRT=0.8
BER=1E-3
0.559
0.644
0.752
0.867
0.889
BER=1E-5
0.000
0.002
0.139
0.598
0.719
Bursty
0.013
0.015
0.160
0.592
0.716
Figure 6.79: Static BER, Missed Deadline Ratio
0.040 0.035 0.030 0.025 Collision Ratio (C )
0.020 0.015 0.010 0.005 0.000
GNRT=0.0
GNRT=0.2
GNRT=0.4
GNRT=0.6
GNRT=0.8
BER=1E-3
0.009
0.012
0.017
0.028
0.031
BER=1E-5
0.006
0.015
0.027
0.034
0.037
Bursty
0.006
0.015
0.027
0.033
0.037
Figure 6.80: Static BER, Collision Ratio
Rusty O. Baldwin
Chapter 6. Simulation Results
178
static BER environment is comparable to that in an equivalent bursty error environment, and (2) the bursty error model is roughly analogous in its effect to a static BER of 1 × 10⁻⁵ with respect to the performance metrics being measured. Namely, throughput, mean delay, missed deadline ratio, and collision ratio.
6.4.5.1
10 Mbps Maximum Capacity Study
In Section 6.3.1.7, it was determined that the 1 Mbps data rate was a factor limiting the effectiveness of RT-MAC with voice traffic. In Section 6.3.2, a 10 Mbps data rate was investigated but the time required to run the 400 simulations prevented the determination of a maximum number of stations that could be supported. However, since the 10 Mbps data rate effectively removed the only known limiting factor with regard to RT-MAC performance, it became interesting to consider the maximum number of stations that could be supported by an RT-MAC network. In Section 6.3.1.7, we derived a theoretic maximum of N = 282 at 10 Mbps to justify investigating a higher data rate channel. However, the simplifying assumptions used in that analysis left the actual performance of a 10 Mbps channel using RT-MAC or IEEE 802.11 an open question. Therefore, further simulations were performed to determine the maximum number of voice stations that could be supported. Due to the increasingly large amount of simulation time required to study these larger networks, multiple replications were not performed. Therefore, the results presented below should be considered preliminary or indicative in nature. In this study, we continue to use the criteria that F ≤ 0.10 constitutes usable voice quality. The maximum number of stations that could be supported was found to be (for GN RT = 0.0) 130 ≤ N < 140 for both an RT-MAC and an IEEE 802.11 network. That is, at N = 130, F ≤ 0.10 and at N = 140, F > 0.10. Having found the maximum N, we set GN RT = 0.2 and found that the failure ratio was greater than 0.10 for both RT-MAC and IEEE 802.11. Table 6.1 summarizes the performance metrics of this study.
Rusty O. Baldwin
Chapter 6. Simulation Results N = 130, GN RT = 0.0
N = 130, GN RT = 0.2
179
N = 140, GN RT = 0.0
Performance Metric
RT-MAC
IEEE 802.11
RT-MAC
IEEE 802.11
RT-MAC
IEEE 802.11
Throughput (S)
1.21E-01
1.32E-01
2.16E-01
1.36E-01
1.22E-01
1.26E-01
Mean Delay (D)
5.57E-02
2.15E-02
2.23E-01
3.17E+00
6.91E-02
7.35E-01
Failure Ratio (F )
5.39E-02
4.74E-02
4.01E-01
9.80E-01
1.36E-01
7.97E-01
Collision Ratio (C)
7.44E-02
8.58E-02
8.72E-02
5.64E-01
7.53E-02
5.07E-01
Table 6.1: Maximum Capacity Study Results
The data in the table indicates that while RT-MAC in most cases improves performance metrics, since F must be less than 0.10 to be useful, the improvement is of no benefit. For the case N = 130, GN RT = 0.0, F is slightly higher for RT-MAC due to the increased delay caused by contention window expansion (cf., Section 5.2). For N = 130, GN RT = 0.2 and N = 140, GN RT = 0.0 F is reduced from 0.98 to 0.40 and 0.80 to 0.14 respectively. We note that the collision reduction algorithm is still quite effective at reducing collisions. Further, no packets were lost due to a full transmission queue. Therefore, the ability of the channel to support more voice traffic using either the RT-MAC or IEEE 802.11 protocol has simply been reached. This limit is probably close to the maximum number of stations that could be support using any random access MAC algorithm. To approach the theoretical limit of N = 282 discussed above, some type of scheduled access to the channel will need to be employed.
6.5
Summary
In this chapter, RT-MAC performance was compared to IEEE 802.11 for several different traffic models. Other simulations to investigate particular aspects of RT-MAC performance were performed. In Section 6.1, RT-MAC performance was investigated using a telemetry traffic model. Using the telemetry model, RT-MAC outperformed IEEE 802.11 in almost every area. Section 6.2, used an avionics traffic model to test RT-MAC. At higher data loads, RT-MAC outperformed IEEE 802.11 in every performance metric. Section 6.3 ad-
Rusty O. Baldwin
Chapter 6. Simulation Results
180
dresses the application of packetized voice data with increasing levels of non real-time data. It was found that while RT-MAC performed better in many instances, the channel data rate seemed to be a limiting factor. Therefore, a 10 Mbps channel was also investigated. Using the 10 Mbps channel, RT-MAC was able to transmit significantly more non real-time data than IEEE 802.11 while still meeting the performance requirements of the voice data. Section 6.4 explores other aspects of RT-MAC such as how different components of the RT-MAC algorithm performs individually, how RT-MAC performs in mixed RT-MAC/IEEE 802.11 networks, and performance under a static BER model along with several other simulation studies. It was found that RT-MAC is quite robust—scoring performance improvements even when up to 60% of the stations in the network were not RT-MAC stations. Further, RT-MAC performed equally well in a static and bursty BER environment. Overall, it was demonstrated that RT-MAC significantly improves the real-time performance of wireless networks.
Chapter 7 Regression Models In this chapter, the regression models developed from the simulation data are presented. Section 7.1 discusses the assumptions that must be satisfied for the linear regression to be valid. Section 7.2 presents the regression models themselves. In Section 7.3, the models are used to predict the behavior of networks using factors not previously simulated. These predictions are then compared with simulations of the same network. Section 7.4 summarizes the results presented in this chapter.
7.1
Linear Regression Assumptions
The models described in this chapter were developed using linear regression. This type of regression is probably the most common regression performed in data analysis. A complete description of it can be found in most texts on statistics or regression analysis including [Jai91], [All90], and [DS81]. Linear regressions make several assumptions which must be satisfied in order for the regression model to be valid. They are [Jai91]: (1) the true relationship between the response variable (e.g., throughput) and the predictor variables (e.g., offered load, stations) are linear, (2) the predictor variables are not stochastic and are specified
181
Rusty O. Baldwin
Chapter 7. Regression Models
182
without error, (3) model errors are statistically independent, and (4) errors are normally distributed. Each of the regression models presented in this chapter were tested against the assumptions listed above. In some cases, the relationship between the response variable and the predictor variables was not linear. In these cases, a suitable transformation of the response variable was performed in order to make the response as linear as possible. The requirement for non-stochastic predictor values was satisfied due to the nature of the predictors. That is, the number of stations, N, the offered load, G, and the channel model, bursty or ideal, can all be specified exactly. To verify that model errors were statistically independent, a visual test was employed. In this visual test, a scatter plot of the predicted response (i.e., the regression model) versus the residuals (i.e., errors) should contain no visible trends. Figure 7.1 shows an example of this. The figure shows the scatter plot for the IEEE 802.11 (telemetry traffic) throughput regression model predicted response and residuals. Data points are vertically stacked due to the five replications of each experiment. No trends are evident in the figure. To verify that errors are normally distributed, a quantile-quantile plot of model error versus the normal quantile is constructed for each model. If the normality assumption holds, a quantile-quantile plot should be quite linear. If the assumption does not hold, this means that the residuals contain some systematic effect not accounted for by the model. Figure 7.2 shows the quantile-quantile plot for the IEEE 802.11 (telemetry traffic) throughput model. It is quite linear. The solid line drawn through the data points is itself a regression line to determine just how linear the data points are. The high R2 value indicates that the assumption of normality is verified.
Rusty O. Baldwin
Chapter 7. Regression Models
183
0.02
0.01
Residuals
0.01
0.00
-0.01
-0.01
-0.02 0.27
0.28
0.29
0.3
0.31
0.32
0.33
0.34
Predicted Throughput
Figure 7.1: Residuals versus Predicted Response for IEEE 802.11 Telemetry Throughput Model
0.020 0.015
Residual quantile
0.010 R2 = 0.9885 0.005 0.000 -0.005 -0.010 -0.015 -0.020 -4
-3
-2
-1
0
1
2
3
4
Normal quantile
Figure 7.2: Normal Quantile-Quantile Plot for Residuals of IEEE 802.11 Telemetry Throughput Data
Rusty O. Baldwin
7.2
Chapter 7. Regression Models
184
Regression Model Tables and Figures
Tables 7.1–7.4 were constructed, in part, from the output of SAS [SAS] (cf., Appendix C). The tables contain the following items: the regression model itself, the model R2 value, the R2 value of the quantile-quantile plot, and the 90% confidence intervals for the mean predicted response for m future experiments. The confidence interval used herein is given by [DS81], [Jai91] as yˆ ∓ t[0.95;120]syˆm where yˆ is the mean response, t[0.95;120] is the t-value, and syˆm is the standard deviation of the sample mean for m experiments. This standard deviation is
syˆm = se
1 nef f
1 + m
!1 2
(7.1)
where se is the standard deviation of model error, nef f is the effective number of degrees of freedom in the model, and m is the number of future experiments performed. The term nef f is given by [Jai91]
nef f =
total number of simulation runs . 1+sum of DFs of parameters used in yˆ
(7.2)
For the t-value, t[p;n] , n = 120 is used, where n is the total number of simulation runs used in the model. In most cases, the value for n exceeds 120. However, the tables used for t-values only extend to n = 120 and then jump to n = ∞. Since the difference between the t-value for n = 120 and n = ∞ is small, n = 120 is used as an approximation when the number of simulation runs exceeds 120. In the following tables, two transformations were utilized to help meet the assumptions of the linear regression: the power transformation and the arcsin transformation. The power transformation consists in raising the response variable, y, to a power, a, (i.e., y a). This transformation was used for some IEEE 802.11 and RT-MAC delay models. In these models, the delays may range from 1 × 10⁻⁶ to 100.0 seconds. By applying the power transformation
Rusty O. Baldwin
Chapter 7. Regression Models
185
with a = 0.05 the range is reduced to (1 × 10⁻⁶ )0.05 = 0.501 to (100.0)0.05 = 1.26. This latter range is much easier to accurately build a model for than the former. After the regression model is constructed, the inverse transformation is performed on the model (i.e., the model is raised to the power a1 ). √ The arcsin transformation, arcsin( y), is used in some of the regression models that involve ratios such as missed deadlines and collisions. Since the data involves ratios that range from 0.0 to 1.0, the arcsin transformation helps to linearize the response variable. The inverse transformation is sin2 (y). The channel simulation factor, E, is conspicuous in the regression models by its absence. Indeed, it appears in only a few of thirty-three models presented. It was found that, while statistically significant, the effect of an errored channel was usually masked by the effects of either G, N, or both in high load situations. With respect to mean delay, this can be attributed to two causes. First, the mean amount of time in which errors can occur is quite small compared to the error-free time (cf., Section 4.5.3). Second, especially in the case of the telemetry traffic model, the amount of data that must be retransmitted when an error does occur is relatively small and much of the time in the errored state is spent waiting for an acknowledgement. By the time the next transmission occurs, much of the time in the errored state has past. In low and medium load situations, E was found to significantly affect the missed deadline statistic, F . Even though the simulation factor E does not appear in most models, it should not be concluded that bit errors do not have a discernible effect on network performance—the simulation data indicates they do. Rather, for the channel model employed, most of the regression models were influenced to a higher degree by the factors N and G.
Rusty O. Baldwin
7.2.1
Chapter 7. Regression Models
186
Telemetry Traffic Model
Table 7.1 shows the regression models for the IEEE 802.11 and RT-MAC networks with telemetry traffic. Model R2 is generally quite high (> 0.9), and the residual quantiles are linear. Following each regression model table are figures that show how the model behaves over the range of the predictor values. Figures 7.3–7.8 show the regression models behavior for throughput, mean delay, missed deadlines, and collisions for telemetry traffic respectively. In Section 6.5 we stated that RT-MAC stabilized the behavior of the response variables. The regression models in this chapter support this claim. Note that RT-MAC models, in general, requires fewer terms and those terms have fewer Gx N y interactions than the corresponding IEEE 802.11 models. Specifically, observe that in Table 7.1, FRT contains no N factor and CRT has no G factor. Table 7.1: Regression Model — Telemetry Traffic Model
Residual QuantileQuantile
R2
R2
m=1
m = 10
m=∞
0.922
0.989
±8.47E-03
±2.91E-03
±1.21E-03
0.910
0.996
± 9.81E-03
± 3.48E-03
± 1.65E-03
0.995
0.891
± 1.43E-02
± 5.14E-03
± 2.57E-03
0.996
0.940
± 1.12E-03
± 3.73E-04
± 1.24E-04
0.989
0.833
± 1.07E-01
± 3.75E-02
± 1.68E-02
−0.807G2 + 1.993G − 0.521
0.995
0.949
± 2.76E-02
± 9.19E-03
± 3.06E-03
−0.437G2 + 0.628G − 1.015 × 10⁻⁴ N 2
0.978
0.970
± 2.97E-02
± 1.02E-02
± 4.25E-03
0.905
0.993
± 4.10E-03
± 1.39E-03
± 5.24E-04
Response Variable Throughput
Regression Model S80211 =
− 6.156 ×
10−3 G2 N
−0.204G2 + 0.305G + 0.222
(IEEE 802.11) Throughput
5.292 ×
10−3 G3 N
90% Confidence Interval for Predicted Response for m Future Experiments
SRT =
−2.215 × 10⁻⁶ GN 3 + 1.782 × 10⁻⁴ GN 2 −3.091 × 10⁻³ GN + 1.394G3 − 2.821G2
(RT-MAC)
+1.796G − 0.0406 Delay (sec)
D80211 =
(−5.005 × 10⁻³ G2 N + 2.810 × 10⁻⁶ GN 3 −3.117 × 10⁻⁴ GN 2 + 1.682 × 10⁻² GN
(IEEE 802.11)
+4.870G3 − 10.187G2 + 6.866G − 0.499)20 Delay (sec)
DRT =
Missed Dead-
F80211 =
sin2 (27.574G3 − 58.055G2 + 39.670G +1.180 × 10⁻⁶ N 3 − 2.625 × 10⁻³ N
line Ratio
−7.186)
(IEEE 802.11) Missed Dead-
−8.048 × 10⁻⁴ GN + 1.080 × 10⁻³ N +3.002 × 10⁻⁴
(RT-MAC)
FRT =
line Ratio (RT-MAC) Collision
C80211 =
+0.0126N − 0.184
Ratio (IEEE 802.11) Collision Ratio
CRT =
5.445 × 10⁻⁷ N 3 − 6.258 × 10⁻⁵ N 2 +2.378 × 10⁻³ N + 9.898 × 10⁻³
(RT-MAC)
In Figure 7.3, the model predicts that throughput for IEEE 802.11 decreases as N increases.
Rusty O. Baldwin
Chapter 7. Regression Models
187
In Figure 7.4 a curious cyclic behavior of the throughput for RT-MAC is observed. In Section 6.1.1 we proposed that this behavior was due to an interaction between the expansion of the contention window and the transmission control algorithm in RT-MAC.
0.34
IEEE 802.11
Normalized Throughput (S)
G = 0.7, 0.9 0.32
G = 0.5 0.3 G = 0.3
0.28
0.26
10
20
30 Stations (N )
40
50
Figure 7.3: Normalized Throughput – Telemetry Traffic Model (1 of 2)
RT-MAC
Normalized Throughput (S)
0.34
0.32
G = 0.5
G = 0.7 0.3
0.28
G = 0.9
G = 0.3
0.26
10
20
30 Stations (N )
40
50
Figure 7.4: Normalized Throughput – Telemetry Traffic Model (2 of 2)
Figures 7.5 and 7.6 show the mean delay for the telemetry traffic model. The figures show
Rusty O. Baldwin
Chapter 7. Regression Models
188
that RT-MAC easily outperforms IEEE 802.11 in terms of mean delay. Figure 7.6 also shows that while RT-MAC mean delay increases with N, it decreases with G (cf., Section 6.1.2). Figures 7.7 and 7.8 show the models for missed deadlines and collisions respectively. RTMAC collision can be seen to be virtually independent of G and only slightly influenced by N. IEEE 802.11 15
Mean Delay (sec) (D)
G = 0.9 10
G = 0.7 G = 0.5
5
0 10
20
30 Stations (N )
40
50
Figure 7.5: Mean Delay – Telemetry Traffic Model (1 of 2) 80 G = 0.3
IEEE 802.11 RT-MAC
Mean Delay (msec) (D)
60
G = 0.3 40 G = 0.5 G = 0.7 20
G = 0.9
0 10
20
30 Stations (N )
40
50
Figure 7.6: Mean Delay – Telemetry Traffic Model (2 of 2)
Rusty O. Baldwin
Chapter 7. Regression Models
189
G=0.5–0.9
1
Missed Deadline Ratio (F )
IEEE 802.11 0.8
RT-MAC G = 0.9
0.6 G = 0.7 0.4 G = 0.5 0.2 G = 0.3 G = 0.3
0 10
20
30 Stations (N )
40
50
Figure 7.7: Missed Deadlines – Telemetry Traffic Model
0.4
IEEE 802.11 RT-MAC
Collision Ratio (C)
0.3
G = 0.9 G = 0.7 G = 0.5 G = 0.3
0.2
0.1 G = 0.3–0.9 0 10
20
30 Stations (N )
40
Figure 7.8: Collisions – Telemetry Traffic Model
50
Rusty O. Baldwin
7.2.2
Chapter 7. Regression Models
190
Avionics Traffic Model
Table 7.2 shows the regression models for the IEEE 802.11 and RT-MAC networks with avionics traffic. Model R2 is generally quite high (> 0.94), and the residual quantiles are linear. Figures 7.9–7.16 show the regression models behavior for throughput, mean delay, missed deadlines, and collisions. As with the telemetry traffic models above, we note that when using the avionics traffic model RT-MAC stabilized the behavior of the response variables. In Table 7.2, SRT and DRT are virtually independent of N. In contrast to IEEE 802.11, RT-MAC provides both better performance and a graceful degradation of performance in high network demand situations. Table 7.2: Regression Model — Avionics Traffic Model
Residual QuantileQuantile
R2
R2
m=1
m = 10
m=∞
0.992
0.825
± 2.24E-02
± 7.57E-03
± 2.86E-03
−1.496G3 + 2.165G2 + 0.143
0.999
0.886
± 9.37E-03
± 3.12E-03
± 1.04E-03
(−0.444G3 N + 0.763G2 N − 0.393GN
0.974
0.825
± 4.48E-02
± 1.61E-02
± 8.05E-03
0.991
0.992
± 7.35E-03
± 2.53E-03
± 1.05E-03
0.945
0.939
± 1.09E-02
± 4.32E-03
± 2.73E-03
0.974
0.832
± 1.73E-01
± 6.23E-02
± 3.12E-02
0.976
0.963
± 1.21E-02
± 4.16E-03
± 1.73E-03
0.973
0.968
± 6.33E-02
± 2.21E-02
± 9.89E-03
0.974
0.921
± 2.56E-03
± 8.81E-04
± 3.66E-04
Response Variable Throughput
Regression Model S80211 =
(IEEE 802.11) Throughput
−3
−5.072 × 10
3
G N − 2.088G
3
+ 2.658G
2
90% Confidence Interval for Predicted Response for m Future Experiments
+0.116 SRT =
(RT-MAC) Delay (sec)
D80211 =
+7.192G3 − 11.184G2 + 5.497G + 0.061N
(IEEE 802.11)
−0.043)20 Delay (sec)
DRT =
1.239G3 − 1.699G2 + 0.778G +4.459 × 10⁻³ E − 0.103
(RT-MAC) Missed Dead-
F80211 =
sin2 (0.103G3 + 9.967 × 10⁻¹ GE
line Ratio
(G ≤ 0.5)
+2.369 × 10⁻⁴ N E + 7.927 × 10⁻³ )
(IEEE 802.11)
F80211 =
sin2 (−0.916G3 N + 1.282G2 N − 0.411GN
(G > 0.5)
+9.507G3 − 10.888G + 4.300)
Missed Dead-
FRT =
8.616 × 10⁻⁴ G2 N + 1.810G3 − 2.666G2 +1.235G − 0.180
line Ratio (RT-MAC) Collision
C80211 =
sin2 (−0.376G3 N + 0.661G2 N − 0.341GN +0.357G3 + 0.0535N + 0.0336)
Ratio (IEEE 802.11) Collision Ratio (RT-MAC)
CRT =
5.995 × 10⁻² G3 − 2.626 × 10⁻² G2 −5.150 × 10⁻⁸ N 3 + 1.527 × 10⁻⁴ N +2.013 × 10⁻⁴
Throughput is shown in Figure 7.9. RT-MAC throughput is constant as N increases, whereas IEEE 802.11 throughput decreases with N. IEEE 802.11 mean delay is shown in Figures 7.10—7.11. It is highly influenced by both G and N for G ≥ 0.7 and has a maximum
Rusty O. Baldwin
Chapter 7. Regression Models
191
delay of about 35 secs. In contrast, RT-MAC mean delay (Figure 7.12) has a maximum of about 120 ms and is independent of N and only slightly influenced by the channel model, E. IEEE 802.11
RT-MAC
0.8
G = 0.9 G = 0.7
Normalized Throughput (S)
0.7
G = 0.7 0.6 G = 0.9
G = 0.5 0.5
0.4
0.3
G = 0.3
10
20
30 Stations (N )
40
50
Figure 7.9: Normalized Throughput – Avionics Traffic Model
The model for the IEEE 802.11 missed deadline ratio shown in Figure 7.13 is an instance where the effect of the channel factor E was significant enough to be included in the model. Given the small magnitude of F , one may wonder why it was not included in a single overall model. This approach was attempted but it was found that the model overestimated the actual missed deadline ratio by several orders of magnitude for G ≤ 0.5 when the simulation data for the entire range of G was included. Further, a single model resulted in F decreasing as N increased from 5 to 30—contrary to an increase in failures indicated by the simulation data. This behavior was caused by the fact that even though the model errors for F were large for G ≤ 0.5 with respect to orders of magnitude, they were insignificant when compared to the model errors in the overall model, especially for G ≥ 0.7. Therefore, the model for the IEEE 802.11 missed deadline ratio was split into two separate models. One model for the low/medium load case, and another for the high load case. The model for the high load IEEE 802.11 missed deadline ratio and the model for the RT-MAC missed deadline ratio is
Rusty O. Baldwin
Chapter 7. Regression Models
192
shown in Figure 7.14. 40 IEEE 802.11
Mean Delay (sec) (D)
30
20 G = 0.9
10
G = 0.7 0 10
20
30 Stations (N )
40
50
Figure 7.10: Mean Delay – Avionics Traffic Model (1 of 3)
80 IEEE 802.11
Mean Delay (msec) (D)
60
G = 0.7 40
20 G = 0.5 G = 0.3
0 10
20
30 Stations (N )
40
Figure 7.11: Mean Delay – Avionics Traffic Model (2 of 3)
50
Rusty O. Baldwin
Chapter 7. Regression Models
193
RT-MAC 120
Mean Delay (msec) (D)
100 Ideal Channel 80
Bursty Error Channel, BER ≈ 2 × 10⁻²
60
40
20 0.4
0.5 0.6 0.7 Normalized Offered Load (G)
0.8
Figure 7.12: Mean Delay – Avionics Traffic Model (3 of 3)
IEEE 802.11 Missed Deadline Ratio (F ) (Log scale)
0.02 0.01
Ideal Channel Bursty Error Channel, BER ≈ 2 × 10⁻²
0.005
G = 0.5
0.002
G = 0.3
0.001 G = 0.5
5×10⁻⁴ 2×10⁻⁴
G = 0.3
10−4 10
20 30 Stations (N )
40
50
Figure 7.13: Missed Deadlines – Avionics Traffic Model (1 of 2)
Rusty O. Baldwin
Chapter 7. Regression Models
194
1 Missed Deadline Ratio (F ) (Log scale)
0.5
G = 0.9
IEEE 802.11 RT-MAC
0.2
G = 0.7
G = 0.9
0.1 0.05
G = 0.7
0.02
G = 0.5
0.01 G = 0.3 0.005 0.002 10
20
30
40
50
Stations (N )
Figure 7.14: Missed Deadlines – Avionics Traffic Model (2 of 2)
The collision ratio for IEEE 802.11 is shown in Figure 7.15. It is strongly influenced by N for G ≥ 0.7. RT-MAC collision ratio is shown in Figure 7.16. It is virtually independent of N and quite small compared to IEEE 802.11. 0.5 IEEE 802.11
Collision Ratio (C)
0.4
G = 0.9
0.3
0.2 G = 0.7 0.1 G = 0.3
G = 0.5
0 10
20
30 Stations (N )
40
50
Figure 7.15: Collisions – Avionics Traffic Model (1 of 2)
Rusty O. Baldwin
Chapter 7. Regression Models
195
RT-MAC 0.025
G = 0.9
Collision Ratio (C)
0.02
0.015 G = 0.7 0.01
0.005
G = 0.5 G = 0.3
0
10
20
30 Stations (N )
40
50
Figure 7.16: Collisions – Avionics Traffic Model (2 of 2)
7.2.3
Voice Traffic Model
7.2.3.1
1 Mbps
Table 7.3 shows the regression models for the IEEE 802.11 and RT-MAC networks with 1 Mbps voice traffic. Model R2 > 0.90, and the residual quantiles are linear. In this table, the offered load, G, is understood to be the non real-time offered load GN RT . Figures 7.17– 7.24 show the regression models behavior for throughput, mean delay, missed deadlines, and collisions. Figure 7.17 shows that with IEEE 802.11, as N increases the throughput converges to approximately 0.3 for any GN RT . Since this is also the case for GN RT = 0.0, this strongly suggests that almost no non real-time traffic is transmitted as N approaches 30. In contrast, consider Figure 7.18 where throughput increases linearly with N except for GN RT = 0.8. Mean delay is shown in Figures 7.19–7.21. In Figure 7.20, IEEE 802.11 mean delay decreases
Rusty O. Baldwin
Chapter 7. Regression Models
196
slightly (although the magnitude is large at about 10 sec). This is due to the fact that, as noted above, non real-time traffic is virtually zero therefore most of that traffic is being blocked, hence not being counted in the mean delay calculation. RT-MAC mean delay is also increasing as seen in Figure 7.21 but we note that the throughput is also increasing meaning that at least some of the non real-time traffic is being transmitted as well. Table 7.3: Regression Model — Voice Traffic (1 Mbps) Model
Residual QuantileQuantile
R2
R2
m=1
m = 10
m=∞
0.964
0.956
± 4.09E-02
± 1.42E-02
± 6.17E-03
0.962
0.968
± 5.70E-02
± 1.91E-02
± 6.54E-03
0.906
0.978
± 6.45E-02
± 2.26E-02
± 1.04E-02
(0.408G2 + 2.795 × 10⁻³ N + 0.798)20
0.924
0.967
± 4.77E-02
± 1.57E-02
± 4.75E-03
0.969
0.879
± 1.87E-01
± 7.39E-02
± 4.67E-02
0.944
0.985
± 2.18E-01
± 7.84E-02
± 3.92E-02
0.954
0.988
± 8.22E-02
± 2.95E-02
± 1.48E-02
0.942
0.982
± 1.77E-01
± 6.00E-02
± 2.27E-02
0.930
0.960
± 8.98E-02
± 3.04E-02
± 1.15E-02
0.955
0.976
± 1.75E-02
± 5.94E-03
± 2.25E-03
Response Variable Throughput
Regression Model S80211 =
−5
3.311 × 10
2
G N
3
−2
− 5.698 × 10
GN
90% Confidence Interval for Predicted Response for m Future Experiments
−4.894 × 10⁻⁴ N 2 + 2.694 × 10⁻² N
(IEEE 802.11)
−0.794G2 + 1.647G − 0.0691 Throughput
SRT =
(RT-MAC) Delay (sec)
−2.075 × 10⁻² G3 N + 7.271 × 10⁻³ N +0.791G + 0.0918
D80211 =
(7.309 × 10⁻⁵ G3 N 3 − 0.117G2 N −3.240 × 10⁻³ GN 2 + 0.144GN + 1.003G2
(IEEE 802.11)
−0.572G + 9.880 × 10⁻⁶ N 3 + 0.794)20 Delay (sec)
DRT =
(RT-MAC) Missed Dead-
F80211 =
sin2 (−6.712 × 10⁻² G3 N 3 + 2.966G3 N 2
line Ratio
[G ≤ 0.2]
−1.244GN + 9.381 × 10⁻⁵ N 3 −1.345 × 10⁻³ N 2 + 3.264G
(IEEE 802.11)
+8.646 × 10⁻² E + 0.0235) F80211 =
sin2 (9.979 × 10⁻⁴ GN 3 − 5.515 × 10⁻² GN 2
[G > 0.2]
+0.828GN − 4.697 × 10⁻⁴ N 3 + 0.0235N 2 −0.255N − 2.0224G2 + 0.192)
Missed Deadline Ratio (RT-MAC)
Collision
FRT = [G ≤ 0.2] FRT =
+6.925 × 10⁻⁴ N 2 − 7.407 × 10⁻² )
C80211 =
sin2 (−2.670 × 10⁻² G2 N − 2.274 × 10⁻³ GN 2 +8.747 × 10⁻² GN + 6.189 × 10⁻⁴ N 2 +2.322 × 10⁻² )
(IEEE 802.11)
Ratio
sin2 (−5.519 × 10⁻³ G3 N 2 + 0.168G2 N
[G > 0.2]
Ratio
Collision
sin2 (9.248 × 10⁻³ G2 N 2 + 1.522 × 10⁻⁵ N 3 +5.965 × 10⁻² E − 3.234 × 10⁻³ )
CRT =
sin2 (−1.462 × 10⁻⁴ GN 2 − 1.603 × 10⁻⁴ N 2 +1.096 × 10⁻² N + 0.165G − 2.886 × 10⁻² )
(RT-MAC)
The GN RT = 0.0 curves in Figures 7.22 and 7.23 exhibit a similar behavior as discussed above in Section 7.2.2 for the IEEE 802.11 avionics failure model. That is, even though the magnitude of the model error was small for GN RT ≤ 0.2, when compared to the model error for GN RT > 0.2, when the data for GN RT ≤ 0.2 was included in an overall model, the prediction for missed deadline ratios for G ≤ 0.2 was off by several orders of magnitude. Further, the channel model used (ideal or bursty) had a significant effect on the models for
Rusty O. Baldwin
Chapter 7. Regression Models
197
GN RT ≤ 0.2. Therefore, the missed deadline ratio model was split into two separate models for both IEEE 802.11 and RT-MAC. In Figure 7.24, RT-MAC has fewer collisions than IEEE 802.11 in every case. 0.8 IEEE 802.11
Normalized Throughput (S)
GN RT = 0.8 0.6 GN RT = 0.6 GN RT = 0.4
0.4
GN RT = 0.2 0.2 GN RT = 0.0
0 5
10
15 20 Stations (N )
25
30
Figure 7.17: Normalized Throughput – Voice Traffic Model (1 Mbps) (1 of 2)
0.8 RT-MAC
Normalized Throughput (S)
GN RT = 0.8 0.6 GN RT = 0.6
GN RT = 0.4
0.4
GN RT = 0.2 0.2 GN RT = 0.0 0 5
10
15 20 Stations (N )
25
30
Figure 7.18: Normalized Throughput – Voice Traffic Model (1 Mbps) (2 of 2)
Rusty O. Baldwin
Chapter 7. Regression Models
198
100 GN RT = 0.2
IEEE 802.11 RT-MAC
Mean Delay (msec) (D)
80 GN RT = 0.4 60
GN RT = 0.4 GN RT = 0.0 GN RT = 0.2
40
20 GN RT = 0.0 5
10
15 20 Stations (N )
25
30
Figure 7.19: Mean Delay – Voice Traffic Model (1 Mbps) (1 of 3)
Mean Delay (sec) (D) (Log scale)
100
IEEE 802.11
GN RT = 0.8 10 GN RT = 0.6
GN RT = 0.4
1
GN RT = 0.2
GN RT = 0.0
0.1 5
10
15 Stations (N )
20
25
30
Figure 7.20: Mean Delay – Voice Traffic Model (1 Mbps) (2 of 3)
Rusty O. Baldwin
50
Chapter 7. Regression Models
RT-MAC GN RT = 0.8
20
Mean Delay (sec) (D) (Log scale)
199
10 5 GN RT = 0.6 2 1 GN RT = 0.4
0.5 0.2
GN RT = 0.2 0.1 5
10
15 Stations (N )
20
25
30
Figure 7.21: Mean Delay – Voice Traffic Model (1 Mbps) (3 of 3)
Missed Deadline Ratio (F ) (Log scale)
1
IEEE 802.11
0.1
0.01
GN RT GN RT GN RT GN RT GN RT
= 0.8 = 0.6 = 0.4 = 0.2 = 0.0
0.001
Ideal Channel Bursty Error Channel
10−4 5
10
15 Stations (N )
20
25
30
Figure 7.22: Missed Deadlines – Voice Traffic Model (1 Mbps) (1 of 2)
Rusty O. Baldwin
Chapter 7. Regression Models
Missed Deadline Ratio (F ) (Log scale)
1
200
RT-MAC
0.1 GN RT = 0.0 GN RT GN RT GN RT GN RT
0.01
= 0.8 = 0.6 = 0.4 = 0.2
0.001
Ideal Channel Bursty Error Channel
10−4 5
10
15 Stations (N )
20
25
30
Figure 7.23: Missed Deadlines – Voice Traffic Model (1 Mbps) (2 of 2)
IEEE 802.11 RT-MAC
Collision Ratio (C)
0.3
0.2
GN RT = 0.8 GN RT = 0.6 GN RT = 0.4 GN RT = 0.2
GN RT GN RT GN RT GN RT GN RT
GN RT = 0.0
0.1
= 0.8 = 0.6 = 0.4 = 0.2 = 0.0
0 5
10
15 20 Stations (N )
25
Figure 7.24: Collisions – Voice Traffic Model (1 Mbps)
30
Rusty O. Baldwin 7.2.3.2
Chapter 7. Regression Models
201
10 Mbps
Table 7.4 shows the regression models for the IEEE 802.11 and RT-MAC networks with telemetry traffic. Model R2 is generally quite high (> 0.92), and the residual quantiles are linear. As with Table 7.3, the offered load, G, is understood to be the non real-time offered load GN RT . Table 7.4: Regression Model — Voice Traffic (10 Mbps) Response Variable Throughput
Regression Model S80211 =
−2
3.614 × 10
3
−2
G N − 3.576 × 10
2
G N
Model
Residual QuantileQuantile
R2
R2
m=1
m = 10
m=∞
0.952
0.988
± 4.06E-02
±1.37E-02
±4.94E-03
0.977
0.979
±3.53E-02
±1.18E-02
±3.93E-03
0.942
0.888
± 9.17E-03
± 3.35E-03
± 1.76E-03
0.926
0.948
± 3.40E-01
± 1.20E-01
± 5.58E-02
0.978
0.888
± 4.69E-03
± 1.71E-03
± 8.91E-03
0.931
0.940
± 3.42E-01
± 1.18E-01
± 5.00E-02
0.924
0.955
± 2.52E-01
± 8.58E-02
± 3.31E-02
0.941
0.952
± 1.14E-01
± 3.71E-02
± 9.80E-03
0.946
0.987
± 1.05E-01
± 3.58E-02
± 1.38E-02
0.972
0.974
± 3.02E-02
± 1.01E-02
± 3.36E-03
90% Confidence Interval for Predicted Response for m Future Experiments
+1.280 × 10⁻⁵ N 2 − 1.114G2 + 1.427G
(IEEE 802.11)
+0.02417 Throughput
SRT =
Delay (sec)
−5.696 × 10⁻³ GN + 1.730 × 10⁻⁵ N 2 −0.878G2 + 1.372G + 0.0132
(RT-MAC) D80211 =
(5.232 × 10⁻³ GN + 2.357G3 E +1.946 × 10⁻⁴ N E − 9.264G3 + 0.142)2
(IEEE 802.11)
[G < 0.2; G = 0.2, N ≤ 50] D80211 =
(6.094 × 10⁻⁵ G3 N 3 − 5.468 × 10⁻⁵ G2 N 3 −0.345G2 N − 0.338GN + 4.193G2 −1.069 × 10⁻⁵ N 3 − 1.092 × 10⁻³ − 1.125)2 [G = 0.2, N > 50; G ≥ 0.2]
Delay (sec)
DRT =
(7.519 × 10⁻⁵ G3 N 3 − 9.603 × 10⁻³ G3 N 2 +0.0908G2 N + 1.186 × 10⁻⁶ N 2
(RT-MAC)
−1.887G2 + 0.824)20 [G < 0.2; G = 0.2, N < 40 ] DRT =
(2.355 × 10⁻⁵ G3 N 3 − 3.761 × 10⁻³ G3 N 2 +0.132G2 N − 21.906G3 + 36.052G2 −15.842G + 1.847)2 [G = 0.2, N ≥ 40; G > 0.2 ]
Missed Dead-
F80211 =
+2.524 × 10⁻⁵ GN 3 − 0.0719GN + 0.0158)
(IEEE 802.11) Missed Dead-
sin2 (7.374 × 10⁻⁵ G3 N 3 − 0.390G3 N −9.319 × 10⁻⁵ G2 N 3 + 0.444G2 N
line Ratio
FRT =
sin2 (−8.503 × 10⁻⁴ G3 N 2 +9.202 × 10⁻⁴ G2 N 2 + 0.0195)
line Ratio (RT-MAC) Collision
C80211 =
sin2 (3.573 × 10⁻³ G3 N 2 − 0.236G3 N −4.203 × 10⁻³ G2 N 2 + 0.253G2 N
Ratio
+7.029 × 10⁻⁶ GN 3 + 2.316 × 10⁻⁵ N 2
(IEEE 802.11)
+0.0339) Collision Ratio
CRT =
sin2 (−4.074 × 10⁻⁷ G2 N 3 + 2.450 × 10⁻³ N −0.225G3 + 0.522G + 7.560 × 10⁻³ )
(RT-MAC)
Figures 7.25–7.26 show the regression models behavior for throughput. IEEE 802.11 and RT-MAC throughput is comparable for G ≤ 0.4. RT-MAC is generally better for higher
Rusty O. Baldwin
Chapter 7. Regression Models
202
loads. For the same reasons already discussed in Section 7.2.2 for the avionics traffic model and in Section 7.2.3.1 for the 1 Mbps voice model, the regression models for mean delay (Figures 7.27–7.29) have been separated into two models. Figures 7.27 and 7.28 show the mean delay for IEEE 802.11. RT-MAC mean delay is shown in Figure 7.29. 0.6 IEEE 802.11
Normalized Throughput (S)
GN RT = 0.8 GN RT = 0.6 GN RT = 0.4
0.4
GN RT = 0.2
0.2
GN RT = 0.0 0 20
40 Stations (N )
60
80
Figure 7.25: Normalized Throughput – Voice Traffic Model (10 Mbps) (1 of 2)
0.6
Normalized Throughput (S)
RT-MAC
GN RT = 0.8 GN RT = 0.6
0.4 GN RT = 0.4 GN RT = 0.2 0.2
GN RT = 0.0 0 20
40 Stations (N )
60
80
Figure 7.26: Normalized Throughput – Voice Traffic Model (10 Mbps) (2 of 2)
Rusty O. Baldwin 30
Chapter 7. Regression Models
203
IEEE 802.11 Ideal Channel Bursty Error Channel
Mean Delay (msec) (D)
GN RT = 0.0 20
10 GN RT = 0.2
0 20
40 Stations (N )
60
80
Figure 7.27: Mean Delay – Voice Traffic Model (10 Mbps) (1 of 3)
10
IEEE 802.11 GN RT = 0.8
Mean Delay (sec) (D) (Log scale)
5
GN RT = 0.6 2 1
GN RT = 0.4 GN RT = 0.2
0.5 0.2 0.1 0.05 0.02 20
40 Stations (N )
60
80
Figure 7.28: Mean Delay – Voice Traffic Model (10 Mbps) (2 of 3)
Rusty O. Baldwin
Chapter 7. Regression Models
Mean Delay (sec) (D) (Log scale)
10
204
GN RT = 0.8
RT-MAC
GN RT = 0.6
1
GN RT = 0.4 GN RT = 0.2
0.1
GN RT = 0.0 0.01
[GN RT = 0.2, N ≥ 40; GN RT > 0.2 ] [GN RT < 0.2; GN RT = 0.2, N < 40 ]
0.001
20
40 Stations (N )
60
80
Figure 7.29: Mean Delay – Voice Traffic Model (10 Mbps) (3 of 3)
Figures 7.30 and 7.31 show the missed deadline ratio for IEEE 802.11 and RT-MAC respectively. The RT-MAC figure clearly shows that RT-MAC can transmit significantly more non real-time traffic than IEEE 802.11 while still meeting the real-time requirements. Collision for IEEE 802.11 and RT-MAC are shown in Figure 7.32.
Missed Deadline Ratio (F ) (Log scale)
1
IEEE 802.11
0.1 GN RT = 0.8 GN RT = 0.6 GN RT = 0.4 GN RT = 0.2 0.01
0.001 GN RT = 0.0
0
20
40 Stations (N )
60
80
Figure 7.30: Missed Deadlines – Voice Traffic Model (10 Mbps) (1 of 2)
Rusty O. Baldwin
Chapter 7. Regression Models
Missed Deadline Ratio (F ) (Log scale)
1
205
RT-MAC
GN RT = 0.8 GN RT = 0.6
0.1
GN RT = 0.4 0.01 GN RT = 0.2 0.001 GN RT = 0.0
0
20
40 Stations (N )
60
80
Figure 7.31: Missed Deadlines – Voice Traffic Model (10 Mbps) (2 of 2)
0.6
IEEE 802.11 RT-MAC
Collision Ratio (C)
GN RT = 0.6 GN RT = 0.8
0.4
GN RT = 0.4
GN RT GN RT GN RT GN RT GN RT
0.2
= 0.8 = 0.6 = 0.4 = 0.2 = 0.0
GN RT = 0.2
0 20
40 Stations (N )
60
Figure 7.32: Collisions – Voice Traffic Model (10 Mbps)
80
Rusty O. Baldwin
7.3
Chapter 7. Regression Models
206
Predictive Power of Models
In this section, several models were chosen as a representative sample to determine the predictive power of the models, i.e., how well the regression models predict simulation results. In this study, regression models are used to predict performance metric outcomes using network factor values that have not been simulated. These predictions are then compared to simulation results using those network factor values. Tables 7.5–7.8 contain the results for the throughput, mean delay, missed deadline ratio, and collision ratio, respectively. In the tables, the Model Prediction 90% C.I. contains the confidence interval of the regression model for m = 5 future experiments. The mean result for the simulation (with 5 replications) using the network factors is listed in column Simulation Mean. The last column (Simulation results agree with Model prediction?) contain a yes or no. A yes means that the simulation and regression model results and corresponding C.I.s have been compared using the method described in Section C.1 and have been found to be not different. A no means the comparison has determined that the model and simulation results are statistically different. Table 7.5: Predictive Power of Regression Models – Throughput Simulation results Traffic Model
Protocol
Telemetry
IEEE 802.11
RT-MAC
Avionics
IEEE 802.11
RT-MAC
Voice
IEEE 802.11
(1 Mbps) RT-MAC
Voice
IEEE 802.11
(10 Mbps) RT-MAC
Network Factors
Model Prediction
Simulation
agree with
90% C.I.
Mean
Model prediction?
G = 0.3, N = 35
[2.771E-01, 2.849E-01]
2.850E-01
no
G = 0.6, N = 25
[3.011E-01, 3.089E-01]
3.013E-01
yes yes*
G = 0.4, N = 25
[3.107E-01, 3.199E-01]
3.200E-01
G = 0.6, N = 25
[3.174E-01, 3.267E-01]
3.121E-01
no
G = 0.6, N = 25
[5.846E-01, 6.052E-01]
5.980E-01
yes
G = 0.8, N = 35
[6.474E-01, 6.680E-01]
6.164E-01
no
G = 0.6, N = 25
[5.949E-01, 6.035E-01]
5.978E-01
yes
G = 0.8, N = 35
[7.582E-01, 7.667E-01]
5.680E-01
no
GNRT = 0.1, N = 28
[2.869E-01, 3.251E-01]
3.068E-01
yes
GNRT = 0.25, N = 12
[3.593E-01, 3.974E-01]
4.087E-01
yes*
GNRT = 0.1, N = 28
[3.477E-01, 4.000E-01]
3.781E-01
yes
GNRT = 0.25, N = 12
[3.467E-01, 3.990E-01]
4.053E-01
yes* yes
GNRT = 0.3, N = 16
[3.004E-01, 3.378E-01]
3.192E-01
GNRT = 0.7, N = 46
[2.489E-01, 2.862E-01]
2.677E-01
yes
GNRT = 0.3, N = 16
[3.069E-01, 3.392E-01]
3.063E-01
yes*
GNRT = 0.7, N = 46
[3.809E-01, 4.132E-01]
3.420E-01
no
* - determined by t-test
Rusty O. Baldwin
Chapter 7. Regression Models
207
Table 7.6: Predictive Power of Regression Models – Mean Delay Simulation results Traffic Model
Protocol
Telemetry
IEEE 802.11
RT-MAC
Avionics
IEEE 802.11
RT-MAC
Voice
IEEE 802.11
(1 Mbps) RT-MAC
Voice
IEEE 802.11
(10 Mbps) RT-MAC
Network Factors
Model Prediction
Simulation
agree with
90% C.I.
Mean
Model prediction?
G = 0.3, N = 35
[3.982E-02, 5.343E-02]
3.668E-02
no
G = 0.6, N = 25
[1.003E+01, 1.005E+01]
1.071E+01
no
G = 0.4, N = 25
[1.874E-02, 1.976E-02]
2.059E-02
no
G = 0.6, N = 25
[1.472E-02, 1.574E-02]
1.434E-02
no
G = 0.6, N = 25
[7.246E-02, 1.150E-01]
1.756E-02
no
G = 0.8, N = 35
[1.967E+01, 1.971E+01]
1.715E+01
yes* yes
G = 0.6, N = 25
[1.592E-02, 2.276E-02]
2.159E-02
G = 0.8, N = 35
[6.256E-02, 6.940E-02]
1.967E-02
no
GNRT = 0.1, N = 28
[4.756E+00, 4.817E+00]
4.645E+00
yes
GNRT = 0.25, N = 12
[4.114E-01, 4.720E-01]
3.245E-02
no
GNRT = 0.1, N = 28
[5.623E-02, 9.974E-02]
1.048E-01
no
GNRT = 0.25, N = 12
[2.385E-02, 6.736E-02]
2.729E-02
yes yes
GNRT = 0.3, N = 16
[0.000E+00, 1.778E-01]
6.158E-03
GNRT = 0.7, N = 46
[4.714E+00, 5.035E+00]
4.541E+00
yes
GNRT = 0.3, N = 16
[0.000E+00, 1.665E-01]
6.980E-03
yes
GNRT = 0.7, N = 46
[3.615E+00, 3.933E+00]
2.507E+00
no
* - determined by t-test
Table 7.7: Predictive Power of Regression Models – Missed Deadline Ratio Simulation results Traffic Model
Protocol
Telemetry
IEEE 802.11
RT-MAC
Avionics
IEEE 802.11
RT-MAC
Voice
IEEE 802.11
(1 Mbps) RT-MAC
Voice
IEEE 802.11
(10 Mbps) RT-MAC
Network Factors
Model Prediction
Simulation
agree with
90% C.I.
Mean
Model prediction?
G = 0.3, N = 35
[0.000E+00, 8.591E-02]
3.112E-03
yes
G = 0.6, N = 25
[9.471E-01, 1.000E+00]
1.000E+00
yes
G = 0.4, N = 25
[1.342E-01, 1.595E-01]
5.940E-02
no
G = 0.6, N = 25
[3.707E-01, 3.960E-01]
3.831E-01
yes
G = 0.6, N = 25
[0.000E+00, 1.424E-01]
5.993E-02
yes
G = 0.8, N = 35
[8.189E-01, 9.838E-01]
9.013E-01
yes
G = 0.6, N = 25
[2.253E-03, 1.350E-02]
1.814E-03
no
G = 0.8, N = 35
[5.624E-02, 6.749E-02]
1.408E-03
no
GNRT = 0.1, N = 28
[7.569E-01, 9.438E-01]
9.698E-01
no
GNRT = 0.25, N = 12
[1.316E-01, 3.389E-01]
3.151E-02
no
GNRT = 0.1, N = 28
[1.147E-01, 1.928E-01]
2.553E-01
no
GNRT = 0.25, N = 12
[0.000E+00, 1.011E-01]
4.779E-04
yes
GNRT = 0.3, N = 16
[0.000E+00, 1.382E-01]
0.000E+00
yes
GNRT = 0.7, N = 46
[8.116E-01, 1.000E+00]
8.363E-01
yes
GNRT = 0.3, N = 16
[0.000E+00, 5.275E-02]
0.000E+00
yes
GNRT = 0.7, N = 46
[7.027E-02, 1.733E-01]
9.569E-02
yes
Rusty O. Baldwin
Chapter 7. Regression Models
208
Table 7.8: Predictive Power of Regression Models – Collision Ratio Simulation results Traffic Model
Protocol
Telemetry
IEEE 802.11
RT-MAC
Avionics
IEEE 802.11
RT-MAC
Voice
IEEE 802.11
(1 Mbps) RT-MAC
Voice
IEEE 802.11
(10 Mbps) RT-MAC
Network Factors
Model Prediction
Simulation
agree with
90% C.I.
Mean
Model prediction?
G = 0.3, N = 35
[2.688E-01, 2.965E-01]
2.581E-01
no
G = 0.6, N = 25
[2.734E-01, 3.011E-01]
3.034E-01
no
G = 0.4, N = 25
[3.684E-02, 4.062E-02]
3.829E-02
yes
G = 0.6, N = 25
[3.684E-02, 4.062E-02]
4.033E-02
yes
G = 0.6, N = 25
[3.241E-02, 9.175E-02]
3.194E-02
no
G = 0.8, N = 35
[2.979E-01, 3.572E-01]
3.496E-01
yes yes
G = 0.6, N = 25
[5.566E-03, 7.949E-03]
5.872E-03
G = 0.8, N = 35
[1.555E-02, 1.794E-02]
1.674E-02
no
GNRT = 0.1, N = 28
[2.476E-01, 3.305E-01]
3.180E-01
yes
GNRT = 0.25, N = 12
[3.116E-02, 1.141E-01]
5.183E-02
yes
GNRT = 0.1, N = 28
[1.645E-02, 3.265E-02]
2.548E-02
yes
GNRT = 0.25, N = 12
[5.166E-03, 2.137E-02]
1.305E-02
yes
GNRT = 0.3, N = 16
[6.999E-03, 1.044E-01]
2.438E-02
yes
GNRT = 0.7, N = 46
[4.317E-01, 5.291E-01]
4.041E-01
no
GNRT = 0.3, N = 16
[2.455E-02, 5.222E-02]
2.716E-02
yes
GNRT = 0.7, N = 46
[1.302E-01, 1.578E-01]
1.406E-01
yes
As the above tables indicate, the predictive power of a given regression model is quite varied. Due to the small number of cases considered, it is not possible to draw any general conclusions about the results. However, even in some cases where the model and the simulation have been determined to be different, they are quite close if one uses fewer significant digits than those listed. For example, in Table 7.5 for the telemetry traffic model, IEEE 802.11 protocol, and G = 0.3, N = 35, the simulation mean is 0.2850. The upper bound of the regression model C.I. is 0.2849. Therefore, even when not strictly within the C.I., the model prediction may in fact be quite adequate. Figures 7.33 and 7.34 show how the model predictions might be adequate even though they are not statistically the same as the results obtained by simulation. Figure 7.33 shows the IEEE 802.11 throughput regression models (dashed lines) overlaid with the actual simulation data (various symbols). For the network factors in Table 7.5 this regression model did not agree with the simulation data. Figure 7.34 shows the opposite. It shows the IEEE 802.11 collision ratio regression models overlaid with the actual simulation data. For the network factors in Table 7.8 this regression model did agree with the simulation data. As these two figures show, the regression models may be entirely adequate depending on the purpose for
Rusty O. Baldwin
Chapter 7. Regression Models
209
which they are used.
0.34
IEEE 802.11
Normalized Throughput (S)
◦?× ?× ◦ G = 0.7, 0.9 ◦?× ?× ◦
0.32
G = 0.5 0.3
? ◦× ?◦ ×
◦?× ◦? ×
G = 0.3
0.28
••
••
••
•
20
30 Stations (N )
◦?× •× ◦?
• •◦?× × ◦?
G = 0.9(?) G = 0.7(◦) G = 0.5(×) G = 0.3(•)
0.26
10
40
50
Figure 7.33: IEEE 802.11 Telemetry Throughput Model and Simulation Data
IEEE 802.11
Collision Ratio (C)
0.3
0.2
◦?∗?◦∗ × GN RT = 0.8 GN RT = 0.6 GN RT = 0.4
?∗?∗ ◦◦
• GN RT = 0.2
×
∗? × • 5
◦?∗× ◦?∗×
◦?∗◦?∗
GN RT = 0.0
0.1
◦× 0 •
?∗◦?∗ ◦× •
10
• •
•• 15 20 Stations (N )
• GN RT GN RT GN RT GN RT GN RT 25
= 0.8(∗) = 0.6(?) = 0.4(◦) = 0.2(×) = 0.0(•) 30
Figure 7.34: IEEE 802.11 1 Mbps Voice Collision Ratio Model and Simulation Data
Rusty O. Baldwin
7.4
Chapter 7. Regression Models
210
Summary
In this chapter, regression models from simulation data were developed. In Section 7.1, we discussed the assumptions that need to be satisfied to develop a valid regression. In Section 7.2, the regression models themselves were presented. In general, model R2 was above 0.9, indicating that the models accounted for most of the variance in the simulation data. Further, model errors were generally normally distributed indicating that most of the systematic effects had been accounted for. Therefore, the models presented can be characterized as very accurate for the particular network configurations simulated. In several cases, it was necessary to divide a model into low offered load case and a high offered load case. This was done to produce a more accurate model in the low offered load case. In most instances, when this was done, it was found that the channel model (ideal or bursty) became a significant factor for the low load case. As mentioned in Sections 6.1.5 and 7.2, the effect of the channel model in higher load cases is often masked by other factors such as N and G. In Section 7.3, the predictive power of the regression models was briefly examined. That is, the models ability to predict the performance of network configurations not specifically simulated was tested. The number of cases looked at was limited and the results were mixed. In many cases the predictions were within the expected confidence interval. Overall, about 61% of the selected cases the model correctly predicted the observed outcome. In some cases, the model predictions were quite close although not strictly within the required bounds.
Chapter 8 Conclusions and Recommendations This research effort focused on the development and evaluation of the RT-MAC wireless local area network medium access control protocol. RT-MAC dramatically improves the on-time delivery of real-time data through a combination of a transmission control protocol that discards late packets rather than transmit them and a distributed collision reduction algorithm. In many instances, throughput and mean delay are also improved. Simulation models were developed to verify performance improvements using telemetry, avionics, and voice traffic models. These simulations were used as a basis for comparison to the reference IEEE 802.11 system. Extensive studies were performed on various aspects of RT-MAC including, packet service disciplines, use of a static BER, and performance in the presence of IEEE 802.11 stations.
8.1
Summary of Research
Chapter 1 provided an introduction to the problem under investigation. The proliferation of real-time data and the challenges posed by transporting that data over a best effort or general purpose LAN is presented. The cost advantage and greater potential for market
211
Rusty O. Baldwin
Chapter 8. Conclusions and Recommendations
212
acceptance by using industry standards is emphasized. To date, research into real-time data transmission over a wireless link has been limited. Research that focused on improving or establishing the ability of an ad hoc network to transmit real-time data has seldom been done. Chapter 2 presented background information relevant to this effort. First, the OSI network models is discussed. This model provided a reference framework from which all other networks are compared. Early wireless medium access control protocols were examined including ALOHA, several ALOHA variants, CSMA, and IEEE 802.11. The operation and performance of these protocols are compared and contrasted. Next, protocols specifically designed to transport real-time data were discussed. These include virtual-time CSMA, reservation ALOHA, and Distributed-Queuing Request Update Multiple Access. An important part of any simulation effort is the choosing of appropriate traffic and channel models. Various traffic and channel models were discussed in Chapter 2. Methods used to perform analytical network analysis are surveyed in Chapter 3. Included in this survey were network classification, network balance, and a discussion of network reversibility. If a network is reversible, it may already have had a canonical solution developed for it, thus speeding the analysis. Exact analysis techniques are presented. However, since most real networks can have a large state space which makes exact analysis impractical, various approximation techniques are described as well including, Mean Value Analysis and Equilibrium Point Analysis. If nodes share an output channel, transmissions may fail due to collisions. This is known as an interfering queue. The intractability of analyzing real-time systems using these techniques is explored. Research objectives and methodology are the topic of Chapter 4. The chapter begins with the problem definition and the presents the thesis and objectives of this research. Performance metrics are presented and the system parameters and factors are discussed. This chapter also includes a presentation of the evaluation technique chosen, the traffic models, and the experimental design.
Rusty O. Baldwin
Chapter 8. Conclusions and Recommendations
213
Chapter 5 provides a description of RT-MAC. Its operation is described in detail. The transmission control protocol examines packets at three key points prior to transmission. If at any of these points the packet is determined to be late, it is discarded. The collision avoidance algorithm consists of both an expansion of the range from which backoff values are chosen, as well as transmitting the next backoff value to be used by the currently transmitting station. Chapter 6 contains the simulation results. This chapter contains the results from the telemetry, avionics, and voice (1 and 10 Mbps) traffic models. Also contained are various other studies performed to investigate particular aspects of RT-MAC. This chapter shows that RT-MAC performs dramatically better with respect to IEEE 802.11 in most of the networks considered for every performance metric. It always performed better under a high load situation especially with respect to missed deadlines. This chapter demonstrates that each of the different components of the RT-MAC transmission control algorithm and enhanced collision avoidance protocol contribute to the performance improvement. It also shows that RT-MAC performs well in both a static and dynamic error environment. Further, it was shown that RT-MAC provides a significant performance benefit even when a sizable percentage of the network stations are using IEEE 802.11 rather than RT-MAC. Chapter 7 presents the regression models for both the RT-MAC and IEEE 802.11 networks. This chapter demonstrates the quality of the models by showing that the models developed account for most of variation observed in the simulation data. Further, it is shown that the developed regression models are reasonably accurate in predicting the behavior of network configurations not specifically simulated. Therefore, these models can be used to great benefit in first-order estimates for network performance in the areas of throughput, mean delay, missed deadlines, and collisions. Appendix A contains extensive documentation of the simulation model including validation data. Appendices B and C contain data tables and output from the SAS statistical package.
Rusty O. Baldwin
8.2
Chapter 8. Conclusions and Recommendations
214
Conclusions
This research effort developed and evaluated a novel medium access control protocol for wireless LANs designed to effectively transport real-time data. In Section 4.1.1, the thesis of this research was stated. It is repeated here. “The thesis of this research is that the ability of an ad hoc packet data network to successfully transport real-time data will be dramatically improved by better utilization of channel capacity and by reducing packet collisions.” The RT-MAC transmission control algorithm embodies the effort to better utilize channel capacity. By not transmitting packets that have (or will) exceed their deadlines, transmission queue throughput is increased, collision probabilities are decreased (by a reduction in traffic), and channel capacity is freed for use by other stations. The RT-MAC enhanced collision avoidance algorithm embodies the effort to reduce packet collisions. By widening the contention window and sharing backoff values throughput the network, collisions were reduced significantly. Examples of the effectiveness of the approach are evident from the simulation data. For example, in a 50 station network with a normalized offered load of 0.7, mean delay is reduced from more than 14 seconds to less than 45 ms, late packets are reduced from 76% to less than 1%, and packet collisions are reduced from 36% to less than 1%. In a network with voice traffic, the number of conversations that can be supported increased 20% for a 1 Mbps channel and 60% for a 10 Mbps channel. Further, RT-MAC can simultaneously support a much greater level of non real-time traffic than can IEEE 802.11. Therefore, the results of this research strongly support our original thesis. Regression models are developed from simulation data to describe network behavior in terms of throughput, mean delay, ratio of late packets, and ratio of collisions. These models were shown not only to be quite accurate in accounting for the observed variance in the simulation data, but also to be effective in predicting the behavior of networks not simulated. In addition, the virtual independence of several RT-MAC regression models on the offered load
Rusty O. Baldwin
Chapter 8. Conclusions and Recommendations
215
or number of stations in the network indicate that RT-MAC stabilized the behavior of the network with respect to those performance metrics. By showing that the performance improvements are realized even in a network with a significant number of IEEE 802.11 stations, it was demonstrated that RT-MAC is a robust protocol exhibiting a graceful (almost linear) degradation. In the case of collision ratios, it was shown that a benefit can be realized even when 80% of the stations in the network are not RT-MAC stations. RT-MAC was evaluated using a wireless LAN. The improvements offered by the RT-MAC protocol, however, are not limited to wireless LANs or even to real-time data traffic. The results extend to any time-slotted LAN, wired or wireless. Further, the enhanced collision avoidance algorithm can be implemented independent of the data being transported.
8.3
Recommendations for Future Research
This research effort has extended the knowledge base of transporting real-time data over wireless local area networks. A novel protocol, RT-MAC, has been developed that significantly improves the ability of wireless LANs to successfully transmit such data. While the improvements are noteworthy, extensions of this work may provide even more benefit. It is recommended that the following research areas be investigated.
1. Analyze the performance of RT-MAC using several spread spectrum transceivers. 2. Investigate whether adaptively modifying the contention window width based on channel traffic will result in further performance improvements. 3. Analyze an RT-MAC network with stations offering non-homogeneous traffic loads. 4. Investigate performance improvement by utilizing different service disciplines for multiple application streams on a single station.
Rusty O. Baldwin
Chapter 8. Conclusions and Recommendations
5. Extend RT-MAC to apply to multi-hop networks. 6. Simulate RT-MAC using a video traffic model. 7. Use stochastic rather than fixed packet lengths. 8. Analyze RT-MAC transient network behavior. 9. Investigate tractable exact analysis methods for networks with interfering queues.
216
Bibliography [Abr70]
N. Abramson. The ALOHA system-another alternative for computer communications. In AFIPS Conference Proceedings 1970 Fall Joint Computer Conference, volume 37, pages 281–285, 1970.
[Abr77]
N. Abramson. The throughput of packet broadcasting channels. IEEE Transactions on Communications, COM-25(1):117–128, January 1977.
[All90]
A. O. Allen. Probability, Statistics, and Queueing Theory with Computer Science Applications - 2nd Edition. Academic Press, Inc., San Diego, CA, 1990.
[ASC78]
ASC/ENA Wright-Patterson AFB, OH, Wright-Patterson AFB, OH. Digital Time Division Command/Response Multiplex Data Bus, MIL-STD-1553B edition, September 1978.
[BB80]
S.C. Bruell and G. Balbo. Computational Algorithms for Closed Queueing Networks.
Operating and Programming Systems Series;7. Unknown, New
York:North-Holland, Amsterdam, 1980. [BBKT96] P. Bhagwat, P. Bhattacharya, A. Krishna, and S. Tripathi. Enhancing throughput over wireless LANs using channel state dependent packet scheduling. In Proceedings IEEE INFOCOM ’96, pages 1133–1140. Institute of Electrical and Electronics Engineers, 1996.
217
Rusty O. Baldwin
Bibliography
218
[BBKT97] P. Bhagwat, P. Bhattacharya, A. Krishna, and S. Tripathi. Using channel state dependent packet scheduling to improve tcp throughput over wireless LANs. Wireless Networks, 3:91–102, 1997. [BC89]
R. Ballert and Y.C. Ching. SONET: Now it’s the standard optical network. IEEE Communications Magazine, 29:8–15, 1989.
[BCMP75] F. Baskett, K. M. Chandy, R. R. Muntz, and F. G. Palacios. Open, closed, and mixed networks of queues with different classes of customers. Journal of Association for Computing Machinery, 22(2):248–260, April 1975. [BD96]
B. Baynat and Y. Dallery. A product-form approximation method for general closed queueing networks with several classes of customers. Performance Evaluation, 24:165–188, 1996.
[BDKM98] R. O. Baldwin, N. J. Davis IV, J. E. Kobza, and S. F. Midkiff. Real-time queueing theory: A tutorial presentation with an admission control application. Submitted for Publication, 1998. [BFO96]
G. Bianchi, L. Fratta, and M. Oliveri. Performance evaluation and enhancement of the CSMA/CA MAC protocol for 802.11 wireless LANs. The Seventh IEEE International Symposium on Personal, Indoor and Mobile Radio Communications PIMRC ’96, pages 392–396, October 1996.
[BG92]
D. Bertsekas and R. Gallagher. Data Networks. Prentice-Hall, New Jersey, 1992.
[Bha98]
V. Bharghavan. Performance evaluation of algorithms for wireless medium access. In IEEE International Computer Performance and Dependability Symposium. IPDS’98, pages 86–95. Institute of Electrical and Electronics Engineers, 1998.
[Bra69]
P. T. Brady. A model for generating on/off speech patterns in two-way conversations. Bell Systems Technical Journal, 48(7):2445–2472, September 1969.
Rusty O. Baldwin [Bra98]
Bibliography
219
C. R. Braun. Proposal highlights the need for speed. Wireless Systems Design, 3(9):13–16, September 1998.
[Buz73]
J. P. Buzen. Computational algorithms for closed queueing networks with exponential servers. Communications of the ACM, 16(9):527–531, 1973.
[Buz76]
J. P. Buzen. Fundamental operational laws of computer system performance. Acta Informatica, 7(2):167–182, 1976.
[CCG98]
F. Cal`ı, M. Conti, and E. Gregori. IEEE 802.11 wireless LAN: Capacity analysis and protocol enhancement. In INFOCOM ’98, Conference on Computer Communications, pages 142–149. Institute of Electrical and Electronics Engineers, 1998.
[CDHC94] T. Carpenter, K. Driscoll, K. Hoyme, and J. Carciofini. ARINC 659 scheduling: Problem definition. In 1994 Real-Time Systems Symposium, pages 165–169. Institute of Electrical and Electronics Engineers, 1994. [CFL79]
I. Chlamtac, W. R. Franta, and K. D. Levin. BRAM: The broadcast recognizing access method. IEEE Transactions on Communications, COM-27(8):1183–1189, August 1979.
[CN95]
K. Crisler and M. Needham. Throughput analysis of reservation ALOHA multiple access. Electronic Letters, 31(2):87–89, January 1995.
[Cox97]
R. V. Cox. Three new speech coders from the ITU cover a range of applications. IEEE Communications Magazine, 35(9):40–47, September 1997.
[CPR96]
F. Callegati, M. Pedrelli, and C. Raffaelli. Analysis of CSMA/CA protocol for wireless networking of ATM multiservice applications. In 5th International Conference on Universal Personal Communications, volume 1, pages 286–290. Institute of Electrical and Electronics Engineers, 1996.
Rusty O. Baldwin
Bibliography
220
[CWKS96] B. Crow, I. Widjaja, J. G. Kim, and P. Sakai. Performance of IEEE 802.11 wireless local area networks. In Proceedings of the SPIE, volume 2917, pages 480–491. The International Society of Optical Engineers, 1996. [Dij93]
N. M. Dijk. Queueing Networks and Product Forms: A Systems Approach. John Wiley and Sons Ltd., West Sussex, England, 1993.
[Dix94]
R. C. Dixon. Spread Spectrum Systems with Commercial Applications, Third Edition. John Wiley and Sons Ltd., New York, 1994.
[DMM88]
S. Dravida, M. J. Master, and C. H. Morton. A method to analyze performance of digital connections. IEEE Transactions on Communications, 36(3):298–305, March 1988.
[DR92]
D. Duchamp and N. F. Reynolds. Measured performance of a wireless LAN. In 17th Conference on Local Computer Networks, pages 494–499. Institute of Electrical and Electronics Engineers, September 1992.
[DRT97]
R. Dube, C. Rais, and S. K. Tripathi. Improving NFS performance over wireless links. IEEE Transactions on Computers, 46(3):290–298, March 1997.
[DS81]
N. R. Draper and H. Smith. Applied Regression Analysis, 2nd Edition. John Wiley and Sons Ltd., New York, NY, 1981.
[Edi97]
Editors of IEEE 802.11. Wireless LAN Medium Access Control (MAC) and Physical Layer (PHY) Specifications, Draft Standard 802.11, P802.11/D6.1. Institute of Electrical and Electronics Engineers, Inc., New York, May 1997.
[EHS97]
J. Ellsberger, D. Hogrefe, and A. Sarma. SDL, Formal Object-Oriented Language for Communicating Systems. Prentice Hall Europe, Hertfordshire, UK, 1997.
[FM94]
V. S. Frost and B. Melamed. Traffic modeling for telecommunications networks. IEEE Communications Magazine, 32(3):70–81, March 1994.
Rusty O. Baldwin [Fri67]
Bibliography
221
D. B. Fritchman. A binary channel characterization using partitioned Markov chains. IEEE Transactions on Information Theory, IT-13:221–227, 1967.
[FST76]
L. Kleinrock F. S. Tobagi. Packet switching in radio channels: Part III—polling and (dynamic) split-channel reservation multiple access. IEEE Transactions on Communications, COM-24(8):832–845, August 1976.
[Gil60]
E. N. Gilbert. Capacity of a burst-noise channel. Bell Systems Technical Journal, 39(2):1253–1265, 1960.
[GN67]
W. J. Gordon and G. F. Newell. Closed queueing systems with exponential servers. Operations Research, 15(2):254–265, 1967.
[Hay78]
J. F. Hayes. An adaptive technique for local distribution. IEEE Transactions on Communications, COM-26(8):1178–1186, August 1978.
[HNT95]
W. Henderson, B. S. Northcote, and P. G. Taylor. Triggered batch movement in queuing networks. Queueing Systems, 21:125–141, 1995.
[HPTvD90] W. Henderson, C. E. M. Pearce, P. G. Taylor, and N. M. van Dijk. Closed queueing networks with batch services. Queueing Systems, 6:59–70, 1990. [HS96]
W. Hsin and K. Sohraby. Cycle modulated sources and their correlation structure. In Proceedings IEEE International Conference on Communications — ICC 96, volume 3, pages 1619–1623. Institute of Electrical and Electronics Engineers, 1996.
[HT90]
W. Henderson and P.G. Taylor. Product form in networks of queues with batch arrivals and batch services. Queueing Systems, 6:71–88, 1990.
[HT91]
W. Henderson and P. G. Taylor. Some new results on queueing networks with batch movement. Journal of Applied Probability, 28:409–421, 1991.
Rusty O. Baldwin [ICH84]
Bibliography
222
G. Iazeolla, P. J. Curtois, and A. Hordijk, editors. Mathematical Computer Performance and Reliability, pages 417–428. Elseiver, North-Holland, 1984.
[ITU96]
ITU Rec. G.114. One-Way Transmission Time. International Telecommunications Union, February 1996.
[Jac57]
J. R. Jackson. Networks of waiting lines. Operations Research, 5(4):518–521, 1957.
[Jac63]
J. R. Jackson. Jobshop-like queueing systems. Management Science, 10(1):131– 142, 1963.
[Jai91]
R. Jain. The Art of Computer Systems Performance Analysis. John Wiley and Sons, Inc., New York, 1991.
[JBS92]
M. C. Jeruchim, P. Balaban, and K. S. Shanmugan. Simulation of Communications Systems. Plenum Press, New York, 1992.
[JK70]
N. L. Johnson and S. Kotz. Continuous Univariate Distributions–1. Houghton Mifflin Company, Boston, 1970.
[JR86]
R. Jain and S. A. Routhier. Packet trains—measurements and a new model for computer network traffic. IEEE Journal on Selected Areas in Communications, SAC-4(6):986–995, September 1986.
[KBS+98]
T. J. Kostas, M. S. Borella, I. Sidhu, G. M. Schuster, J. Grabiec, and J. Mahler. Real-time voice over packet-switched networks. IEEE Network, 12(1):18–27, January/February 1998.
[Kel79]
F. P. Kelly. Reversibility and Stochastic Networks. John Wiley and Sons Ltd., New York, 1979.
[Kle75]
L. Kleinrock. Queueing Systems Volume 1: Theory. John Wiley and Sons Inc., New York, 1975.
Rusty O. Baldwin [Kle76]
Bibliography
223
L. Kleinrock. Queueing Systems Volume 2: Computer Applications. John Wiley and Sons, Inc., New York, 1976.
[Kle78]
L. Kleinrock. Principles and lessons in packet communications. Proceedings of the IEEE, 66(11):1320–1329, November 1978.
[KLE95]
M. J. Karol, Z. Liu, and K. Y. Eng. Distributed-queueing request update multiple access (DQRUMA) for wireless packet (ATM) networks. In 1995 IEEE International Conference on Communications, pages 1224–1231. Institute of Electrical and Electronics Engineers, Inc., 1995.
[KRPO93] M. H. Klein, T. Ralya, B. Pollak, and R. Obenza. A Practitioner’s Handbook for Real-Time Analysis: Guide to Rate Monotonic Analysis for Real-Time Systems. Kluwer Academic Publishers, Boston, 1993. [KS80]
L. Kleinrock and M. O. Scholl. Packet switching in radio channels: New conflictfree multiple access schemes. IEEE Transactions on Communications, COM28(7):1015–1029, July 1980.
[KSY84]
J. F. Kurose, M. Schwartz, and Y. Yemini. Multiple-access protocols and timeconstrained communication. Computing Surveys, 16(1):43–70, March 1984.
[KT75]
L. Kleinrock and F. A. Tobagi. Packet switching in radio channels: Part I: CSMA modes and their throughput-delay characteristics. IEEE Transactions on Communications, COM-23(12):1400–1416, December 1975.
[KY80]
L. Kleinrock and Y. Yemini. Interfering queuing processes in packet-switched broadcast communication. In Proceedings IFIP Congress 80, pages 557–562. International Federation for Information Processing, 1980.
[Leh96]
J. P. Lehoczky. Real-time queueing theory. In Proceedings. 17th IEEE RealTime Systems Symposium, pages 186–195. Institute of Electrical and Electronics Engineers, Inc., December 1996.
Rusty O. Baldwin [Leh97a]
Bibliography
224
J. P. Lehoczky. Real-time queueing network theory. In Proceedings. 18th IEEE Real-Time Systems Symposium, pages 58–67. Institute of Electrical and Electronics Engineers, Inc., December 1997.
[Leh97b]
J. P. Lehoczky. Using real-time queueing theory to control lateness in real-time systems. Performance Evaluation Review, 25(1):158–168, June 1997.
[Leu95]
Y. W. Leung. Generalised multi-copy ALOHA. Electronic Letters, 31(2):82–83, January 1995.
[LEWW95] Win-Cheong Lau, A. Erramilli, J. L. Wang, and W. Willinger. Self-similar traffic generation: The random midpoint displacement algorithm and its properties. In Proceedings IEEE International Conference on Communications — ICC 95, volume 1, pages 466–472. Institute of Electrical and Electronics Engineers, 1995. [Liu96]
T. Liu. Performance Modeling and Design Trade-offs of Wireless Communication Networks with Heterogeneous Service Requirements. PhD thesis, University of Southern California, August 1996.
[LL73]
C. L. Liu and J. W. Layland. Scheduling algorithms for multi-programming in a hard real-time environment. Journal of the Association for Computing Machinery, 20(1):46–51, January 1973.
[LSP95]
T. Liu, J. A. Silvester, and A. Polydoros. Performance evaluation of R-ALOHA in distributed packet radio networks with hard real-time communications. In 1995 IEEE 45th Vehicular Technology Conference, volume 25, pages 554–558. Institute of Electrical and Electronics Engineers, Inc., July 1995.
[LTWW94] W. E. Leland, M. S. Taqqu, W. Willinger, and D. V. Wilson. On the selfsimilar nature of ethernet traffic (extended version). IEEE/ACM Transactions on Networking, 2(1):1–15, February 1994.
Rusty O. Baldwin [LvS97]
Bibliography
225
M. L¨otter, P. van Rooyen, and F. Swarts. Markov channel models for DS-CDMA communications. The Transactions of the South African Institute of Electrical Engineers, pages 43–48, June 1997.
[Mac92]
M. H. MacDougall. Simulating Computer Systems: Techniques and Tools. The MIT Press, Cambridge, MA, 1992.
[Mal94]
N. Malcolm. Hard Real-Time Communications in High Speed Networks. PhD thesis, Texas A&M University, December 1994.
[Mar79]
R. A. Marie. An approximate analytical method for general queueing networks. IEEE Transactions on Software Engineering, SE-5(5):530–538, September 1979.
[MIL97]
MIL 3, Inc., 3400 International Drive, NW Washington D.C., 20008. OPNET Modeler, 1997.
[MIL98]
MIL 3, Inc., 3400 International Drive, NW Washington D.C., 20008. OPNET Simulation Kernel Manual, Anim-Pk, Release 3.5A, 1998.
[MZ95]
N. Malcolm and W. Zhao. Hard real-time communications in multiple-access networks. Real-Time Systems, 8(1):35–77, January 1995.
[NKNS96]
G. T. Nguyen, R. H. Katz, B. Noble, and M. Satyanarayanan. A trace-based approach for modeling wireless channel behavior. In Proceedings of the 1996 Winter Simulation Conference, pages 597–604. Institute of Electrical and Electronics Engineers, 1996.
[Nor95]
I. Norros. The management of large flows of connectionless traffic on the basis of self-similar modeling. In Proceedings IEEE International Conference on Communications — ICC 95, volume 1, pages 451–455. Institute of Electrical and Electronics Engineers, 1995.
[PB86]
T. Pratt and C. W. Bostian. Satellite Communications. John Wiley and Sons, 1986.
Rusty O. Baldwin [PF95]
Bibliography
226
V. Paxson and S. Floyd. Wide area traffic: The failure of Poisson modeling. IEEE/ACM Transactions on Networking, 3(3):226–244, June 1995.
[PFTV92]
W. H. Press, B. P. Flannery, S. A. Teukolsky, and W. T. Vettering. Numerical Recipes in C, Second Edition. Cambridge University Press, 1992.
[Pru95]
P. Pruthi. Heavy-tailed on/off source behavior and self-similar traffic. In Proceedings IEEE International Conference on Communications — ICC 95, volume 1, pages 445–450. Institute of Electrical and Electronics Engineers, 1995.
[PSS96]
A. R. Prasad, B. Stavrov, and F. C. Schoute. Generation and testing of selfsimilar traffic in ATM networks. In Proceedings 1996 IEEE International Conference on Personal Wireless Communications, pages 200–205. Institute of Electrical and Electronics Engineers, 1996.
[Puj95]
G. Pujolle. Product form in discrete-time queueing networks: New issues. In Proceedings of the Third International Workshop on Modeling, Analysis, and Simulation of Computer and Telecommunication Systems, pages 148–153, 1995.
[Rap96]
T. S. Rappaport. Wireless Communications: Principles and Practice. PrenticeHall, Inc., New Jersey, 1996.
[RK96]
A. Rueda and W. Kinsner. A survey of traffic characterization techniques in telecommunication networks. In 1996 Canadian Conference on Electrical and Computer Engineering, pages 830–833. Institute of Electrical and Electronics Engineers, 1996.
[RL80]
M. Reiser and S. S. Lavenberg. Mean-value analysis of closed multichain queueing networks. Journal of the Association for Computing Machinery, 27(2):313– 322, 1980.
Rusty O. Baldwin [RTW94]
Bibliography
227
K.W. Ross, D.H.K. Tsang, and Jie Wang. Monte carlo summation and integration applied to multiclass queueing networks. Journal of the Association for Computing Machinery, 41(6):1110–1135, 1994.
[SAG94]
G. D. Stamoulis, M. E. Anagnostou, and A. D. Georgantas. Traffic source models for ATM networks: A survey. Computer Communications, 17(6):428– 438, June 1994.
[Sak99]
J. Sakatselis. Solving multipath problems in indoor WLAN designs. Wireless Design Online, 24 Feb 1999. URL: http://news.wirelessdesignonline.com/ design-features/19990224-6959.html.
[SAS]
SAS Institute, Inc. Cary, NC.
[SAS85]
SAS Institute, Inc. SAS User’s Guide: Statistics, Version 5 Edition, 1985.
[Sch79]
J.P. Schweitzer. Approximate analysis of multiclass closed networks of queues. In International Conference on Stochastic Control and Optimization, Amsterdam, 1979.
[Ser93]
R. F. Serfozo. Queueing networks with dependent nodes and concurrent movements. Queueing Systems, 13(1-3):143–183, 1993.
[SF94]
F. Swarts and H. C. Ferreira. Markov characterization of digital fading mobile vhf channels. IEEE Transactions on Vehicular Technology, pages 977–985, November 1994.
[SK96]
J. L. Sobrinho and A. S. Krishnakumar. Real-time traffic over the IEEE 802.11 medium access control layer. Bell Labs Technical Journal, pages 172–187, 1996.
[SL95]
S. Ben Slimane and T. Le-Ngoc. A doubly stochastic Poisson model for selfsimilar traffic. In Proceedings IEEE International Conference on Communications — ICC 95, volume 1, pages 456–460. Institute of Electrical and Electronics Engineers, 1995.
Rusty O. Baldwin [STE96]
Bibliography
228
G. Sfikas, R. Tafazolli, and B. G. Evans. ATM cell transmission over the IEEE 802.11 wireless MAC protocol. In 7th IEEE International Symposium on Personal, Indoor, and Mobile Radio Communications, volume 1, pages 173–177. Institute of Electrical and Electronics Engineers, 1996.
[TK75]
F. S. Tobagi and L. Kleinrock. Packet switching in radio channels: Part II— the hidden terminal problem in carrier sense multiple-access and the busy-tone solution. IEEE Transactions on Communications, COM-23(12):1417–1433, December 1975.
[TK77]
F. S. Tobagi and L. Kleinrock.
Packet switching in radio channels: Part
IV—stability considerations and dynamic control in carrier sense multiple access. IEEE Transactions on Communications, COM-25(10):1103–1119, October 1977. [TK78]
F. S. Tobagi and L. Kleinrock. The effect of acknowledgment traffic on the capacity of packet-switched radio channels. IEEE Transactions on Communications, COM-26(6):815–826, June 1978.
[VZ95]
M. A. Visser and M. El Zarki. Voice and data transmission over an 802.11 wireless network. In 6th IEEE International Symposium on Personal, Indoor, and Mobile Radio Communications, volume 2, pages 648–652. Institute of Electrical and Electronics Engineers, 1995.
[WM95]
H. S. Wang and N. Moayeri. Finite state Markov channel — a useful model for radio communication channels. IEEE Transactions on Vehicular Technology, pages 163–171, February 1995.
[Woo94]
M. E. Woodward. Communication and Computer Networks. IEEE Computer Society Press, Los Alamitos, California, 1994.
Rusty O. Baldwin [Woo97]
Bibliography
229
M. E. Woodward. Size-limited batch movement in product-form closed discretetime queueing networks. Performance Evaluation Review, 25(1):139–146, June 1997.
[WWW96] J. Weinmiller, H. Woesner, and A. Wolisz. Analyzing and improving the IEEE 802.11-MAC protocol for wireless LANs. In MASCOTS 96. Proceedings of the Fourth International Workshop on Modeling, Analysis, and Simulation of Computer and Telecommunication Systems, pages 200–206, February 1996. [WZ87]
K. Ramamritham W. Zhao. Virtual time CSMA protocols for hard real-time communication. IEEE Transactions on Software Engineering, SE-13(8):938– 952, August 1987.
[YH91]
H. Yu and R. L. Hamilton Jr. A buffered two-node packet radio network with product form solution. IEEE Transactions on Communications, 39(1):62–75, January 1991.
[ZC96]
Y. Q. Zhao and L. L. Campbell. Equilibrium probability calculations for a discrete-time bulk queue model. Queueing Systems, 22:189–198, 1996.
Appendix A Simulation Documentation This appendix presents the documentation for the simulation model used in this research effort. Section A.1 contains a discussion of the simulation tool. Section A.2 is a concise overview of the Specification and Description Language (SDL-92) symbols used to document the behavior of the simulation. A complete description of this language can be found in [EHS97]. The next section, A.3, presents the simulation model itself. It highlights the structure of the model and documents the behavior using SDL. SDL was used as the formal description language in the IEEE 802.11 standard. The next section, A.4, describe the simulation parameters which can be varied within the model. Section A.5 discusses the validation of the model and the appendix is concluded with a summary in Section A.6.
A.1
Simulation Tool
This research used the communication network simulator OPNET, version 3.5.A by MIL3, Inc. [MIL97]. Simulations in OPNET are organized in a hierarchical structure of models consisting of (from the highest to lowest level) network models, node models, process models, and parameter models. Network models essentially describe the physical location of nodes
230
Rusty O. Baldwin
Appendix A. Simulation Documentation
231
and how they are connected (i.e., radio, bus, ring, etc.). Nodes are the stations in the network. Node models describe connections between the process models. Processes specify behavior and parameter models define the data structures used by processes for inter-process communication. Parameter models also define the structure of the packets transmitted on the network itself. At a given level in the hierarchy, a model is defined using the models at the next lower level. For example, a network model consist of a set of node models arranged and connected in a particular way. Likewise, a node model consists of a number of process models connected in a given way. These different models can be thought of as objects, each with a set of attributes that can be modified. Thus, OPNET can be described as somewhat object-oriented in its approach to modeling components within the simulation program. Data from the simulation is collected by placing statistic “probes” at points of interest within the models. Data collected can be analyzed using the analysis tool provided or exported to be analyzed in external programs.
A.2
SDL Overview
The IEEE 802.11 specification has both a textual description of the standard and a formal description written in SDL-92. Both the textual and the formal description are normative. That is, if a system correctly implements the formal (and/or the textual) description, it is, by definition, an IEEE 802.11 implementation. This presents an obvious advantage to someone modeling the system since the model (correctly implemented) inherently conforms to the standard. Additionally, the formal description contains all of the subsystem interactions explicitly identified at the location where they occur and all subsystem interfaces are identified. Obviously, a complete description of SDL cannot be presented, however, the major components of the SDL language are quite intuitive and easily followed. Three fundamental objects in SDL are blocks, processes, and signals. Blocks determine
Rusty O. Baldwin
Appendix A. Simulation Documentation
232
Block
Signal Route -
Comment Signal List
@
Signal A, Signal B
Process @
Figure A.1: SDL Legend lexical scope and structural hierarchy while processes specify behavior using finite state machines. Processes operate concurrently and independently and they communicate using signals. Each block may contain other blocks and/or processes. These fundamental SDL objects are shown in Figure A.1. Note that this figure does not contain all (or even most) of the objects available in SDL. Figure A.2 is an example of an SDL diagram. It shows the subset of IEEE 802.11 functionality implemented in the simulation model. The solid line border that encloses the figure indicates the logical boundary of the object. At some point in a hierarchy of SDL blocks behavior is specified by including process objects. Using the Transmission block in Figure A.2, the process objects and the symbols used will be described. Figure A.3 shows the view inside of the block Transmission. Note how the input and output signals in Figure A.3 correspond to those in Figure A.2 as one would expect. More detail about which processes these signals go to or are received from is included at this level.
Rusty O. Baldwin
Appendix A. Simulation Documentation � � 6 MsduIndicate
IEEE 802.11 System Station
�
� ? This block implements the Distributed Coordination Function protocol of IEEE 802.11
PduRequest
Protocol Control STA
h This block handles transfers of Protocol Data Units to the Physical Layer
BkDone, TxConfirm
"
RxIndicate, NeedAck, RxCfAck, RxCfPoll
This block handles the reception of Protocol Data Units from the Physical Layer
# Backoff, Cancel, TxRequest
� ChangeNav
?
Busy, Idle, Slot
�
Transmission
�
#
"
?
� 6
6
i 6
Reception
�
� 6
PhyTxSignals
?
� PhyRxSignals
?
Figure A.2: IEEE 802.11 System Station �
Block Transmission
�6�
� TxConfirm
� BkDone
h
Backoff, Cancel
?
@
This process determines the backoff count and signals Protocol Control when backoff is done
Backoff Procedure
@
�
�
6"
# Busy, Idle, Slot
TxRequest
? This process places the Protocol Data Units on the Physical Layer and generates checksums
Data Pump
@
�
�
6
@ �
"
# Busy, Idle, Slot
PhyTxSignals
?
Figure A.3: Block Transmission
i
233
Rusty O. Baldwin
Appendix A. Simulation Documentation
� �
� Start
� � @
@
� State
@
� (signal from processes logically above or parallel to this process
Input Signal
Input Signal
@@
Output Signal
�
@
(signal from processes logically below this process
Output Signal
(signal from processes logically below this process
(signal from processes logically above or parallel to this process
Task
�Save Interrupt � � � @ @
Priority Signal
234
@
Decision
@ @ @
Figure A.4: Process Legend The process objects have their own symbols, some of which include: start, state, input signal, output signal, priority signal, decision, save interrupt, and task. These process object symbols are shown in Figure A.4. They are self-explanatory if one keeps in mind that the process is essentially a finite state machine. One exception is the task symbol, which indicates algorithmic steps that need to be accomplished within the process. Figure A.5 shows an extract of the process block for Data Pump in Figure A.3. In this process, a computational task block is encountered first. Next, the process enters the Tx Idle state where it remains until it receives one of the signals TxRequest, Busy, Idle, or Slot. If it receives TxRequest, the process transmits a packet via other processing not shown in the figure. If Data Pump receives Busy, Idle, or Slot, Data Pump sends the same signal to another process (in this particular example Backoff Procedure) and returns to state Tx Idle. The signal destinations are not explicitly identified in process objects. That information is contained in the appropriate SDL block. These SDL objects map quite nicely to OPNET objects. The IEEE 802.11 System Station shown in Figure A.2 corresponds to a node. The processes within lower level blocks (i.e.,
Rusty O. Baldwin
Appendix A. Simulation Documentation
�
�
�
�
235
Process Data Pump
dTx:=dUsec (aTxRfDelay+ aTxPlcpDelay
� � @
� Tx Idle
�
TxRequest
...
Busy
@ � �
Busy
� ? Tx Idle
Idle
@
@ �
Slot
@
Idle
�
@
@
Slot
�
Figure A.5: Process Block Data Pump and Backoff Procedure within Transmission) map to objects available within the OPNET Node Editor such as processors, queues, generators, etc. Referring to Figure A.5, the implementation of a process block corresponds to objects available within the OPNET Process Editor such as initial states, states, and transitions. SDL signals are implemented using OPNET interrupts combined with state transition conditions. A task would be implemented using Proto-C code in state enter/exit executives or transition executives. Figure A.6 summarizes these mappings. SDL has other objects to model more complex behavior but it was found that they can all be implemented with ease in a manner similar to the objects discussed. While metrics of programming errors were not collected, mapping the objects in the formal specification to OPNET objects seemed to greatly reduce the number of logical errors as well as reduce development time. This time included learning OPNET. In addition, the model was indeed a valid IEEE 802.11 implementation since it was translated directly from the
Rusty O. Baldwin
Appendix A. Simulation Documentation
SDL Objects
OPNET Objects Node
Block
Processor, Generator, Queue, Receivers, Transmitters, Antenna
Process
Input Signal
Start
Initial State
st_0
State
State
st_0
Input Signal
236
Output Signal
Task
Output Signal
Interrupt, Transition Condition Proto-C code in Entry/Exit Executive, Transition Executive
Entry Executive st_0 Exit Executive
Figure A.6: SDL to OPNET Object Mapping normative formal specifications.
A.3
Wireless LAN Simulation Model
This section documents the IEEE 802.11 simulation model. It begins at the node level and proceeds down the hierarchy to processes and parameters. The graphical portion of the SDL-92 specification language used in the IEEE 802.11 standard [Edi97] will also be used to document this simulation model. The specification contained in [Edi97] is a complete, valid SDL specification. The purpose of using SDL herein is to document the behavior of the simulation process models. Therefore, while elements of the SDL graphical language are used, it is not a complete SDL specification of the OPNET simulation model. The simulation model implements the distributed coordination function (DCF) of IEEE 802.11.
Stations (nodes) within the model form an ad hoc network (i.e., an indepen-
dent basic service set (IBSS) in IEEE 802.11 terms). IEEE 802.11 functions not in the
Rusty O. Baldwin
Appendix A. Simulation Documentation
237
model include: encryption, authentication, power-save mode functions, fragmentation/defragmentation, and the point coordination function (PCF).
A.3.1
Node Model
The highest level SDL block in the model hierarchy is the System Station. This block is shown in Figure A.7 below and contains other blocks which specify functions within System Station. This figure is very similar to Figure A.2. The difference is that the signal names match the state transition condition name or state executive statement name used in the OPNET process models. The corresponding node level OPNET implementation is shown enclosed in the dashed-line box in Figure A.8; the solid-line boxes are the MAC Service Access Point, and the PHYSICAL Service Access Point. These functions are external to the System Station and are not defined by IEEE 802.11. Within the OSI network model (cf., Section 2.1.2, Figure 2.1), the MAC Service Access Point is part of the Logical Link Control sublayer within the Data Link Control layer. The PHYSICAL Service Access Point corresponds to the Physical layer in the OSI model. The signals shown in Figure A.7 are generally implemented by interrupts in OPNET and do not appear explicitly in Figure A.8. The solid and dotted lines with arrows in Figure A.8 represent packet flows within the System Station. Moving down one level in the SDL hierarchy, the blocks within Figure A.7 (e.g., Protocol Control STA, Transmission, and Reception) are defined in terms of process models. Figures A.9, A.10, A.11 show the Protocol Control STA, Transmission, Reception blocks respectively.
A.3.2
Process Models
Process models describe the behavior of process objects (i.e., Data Pump, Backoff Procedure, Tx Coordination sta, Rx Coordination, etc. of Figures A.3 and A.9) and are essentially
Rusty O. Baldwin
Appendix A. Simulation Documentation
MAC Service Access Point
6
System Station
�
6
�
�
REQUESTCPPACKET
�
� SINKREQUEST
� PDUREQUEST
? Protocol Control STA
6
h
GETBACKOFF, TXREQUEST
BKDONE, TXTXCONFIRM, RXTXCONFIM, TXTXBLOCKED
i
? Transmission
6
h
FWD PACKET, NEEDACK
BUSY TO DATA PUMP, IDLE TO DATA PUMP, SLOT TO DATA PUMP, SENDNEXTBACKOFF
�
Reception
" �
i
�
RXMPDU FROM PHY, BUSY, IDLE
XMIT PACKET
? PHYSICAL Service Access Point
Figure A.7: SDL – System Station
#6
238
Rusty O. Baldwin
Appendix A. Simulation Documentation
239
System Station Transmission MAC Service Access Point
Backoff_Procedure
Packet_Queue
Source
PHYSICAL Service Access Point
Tx_Coordination_sta
Data_Pump
Transmitter
Protocol_ Control_STA Antenna
Rx_Coordination
Sink
Filter_MPDU
Receiver
Reception
Channel_State
Figure A.8: OPNET Node – System Station 6�
Block Protocol Control STA
6�
� REQUESTCPPACKET
�
� SINKREQUEST
� PDUREQUEST
h
GETBACKOFF, TXREQUEST
� I @ @ @
�
i
" @ @
BKDONE, TXTXCONFIRM, TXTXBLOCKED
@ @ �
TXREQUEST
?
� @ - Tx Coordination � sta #
� SENDGOTACK
@ �
� RXTXCONFIRM
-
@ Rx Coordination
@
6h
FWD PACKET, NEEDACK
Figure A.9: SDL – Block Protocol Control STA
i
Rusty O. Baldwin
Appendix A. Simulation Documentation 6
Block Transmission
"
6�
#
240
� BKDONE
TXTXCONFIRM, RXTXCONFIRM, TXTXBLOCKED
� ?
GETBACKOFF, SENDINGNEXTBACKOFF
�
@
Backoff Procedure
@ �
?
Data Pump
@ �
"
@ XMIT PACKET
� BUSY, IDLE, SLOT
TXREQUEST
�
6�
�
# BUSY TO DATA PUMP, IDLE TO DATA PUMP, SLOT TO DATA PUMP
� ?
Figure A.10: SDL – Block Transmission 6 "
Block Reception
"
FWD PACKET, NEEDACK SENDINGNEXTBACKOFF
#
# BUSY TO DATA PUMP, IDLE TO DATA PUMP, SLOT TO DATA PUMP
@
�
Channel State
�
@ � 6 BUSY, IDLE
6 "
# CLEARNAV, SETNAV, SETIFS
@ Filter MPDU
@ PP PP PP PP PP PP PP
6�
Figure A.11: SDL – Block Reception
� RXMPDU FROM PHY
Rusty O. Baldwin
Appendix A. Simulation Documentation
241
finite state machines. The following sections describe the process models in the IEEE 802.11 simulation model.
A.3.2.1
Source
The Source process model (cf., Figure A.8) is not specified in the IEEE 802.11 standard. Source generates the packets that the station transmits. Source can generate three classes of data packets: hard real-time (i.e., packets with deadlines that cannot be missed), soft real-time (i.e., packets with deadlines that can be met within a certain tolerance), and ordinary data packets with no deadlines. Each class of data packets has up to three independent input streams that can be specified to simulate different applications running on the station. The packet arrival, size, and deadline distributions can be any of the predefined distributions supported by OPNET. In addition, the packet arrival distribution can be a Pareto distribution or an ON-OFF process. In an ON-OFF process stations are either transmitting (ON) at a specified rate or idle (OFF). The time spent in each state is exponentially distributed. Figure A.12 shows the OPNET implementation of the Source process model. The circles are states that the process can be in. Source has four states: Start, Create Packet, Resubmit Packet, and idle. Within these states, processing, in the form of C language statements, is performed. These C language statements are not shown. The large solid arrow indicates the state the process starts in. Typically, any needed initialization is performed in this state. The gray circles indicate that any processing associated with the state is performed and then the state is exited. OPNET terms this a “forced” state. A process remains in an black colored state until a transition condition becomes true. Transitions that occur in response to a particular condition are shown by a dotted line with an arrow. The condition that triggers the transition is shown in parenthesis beside the line (e.g., (CREATEPACKET) in Figure A.12). Solid lines with arrows show unconditional transitions. In all process models, these transition conditions are implemented by C language statements and are all disjoint. That is, only one of the transition conditions is true at a particular time.
Rusty O. Baldwin
Appendix A. Simulation Documentation
242
Create Packet
(CREATEPACKET) (default)
Start
idle
(RESUBMITTEDPACKET)
Resubmit Packet
Figure A.12: Source Process Model In the process Source, initialization occurs in the Start state. This initialization includes setting up the interrupts for the arriving packets and other OPNET specific initializations. After this is done, Source goes to the idle state. The only conditions which will cause Source to leave the idle state are CREATEPACKET and RESUBMITTEDPACKET. All other conditions cause idle to be exited and re-entered via the default transition. The CREATEPACKET condition is implemented in C and becomes true when any interrupt to create a packet occurs. When CREATEPACKET becomes true, the process goes to the Create Packet state. In this state, the interrupt source is determined, the particular class of packet indicated by the interrupt (i.e., hard, soft, or data) is created and sent to the process Packet Queue. Source then unconditionally returns to the idle state. RESUBMITTEDPACKET becomes true when a packet discarded prior to transmission because it is late is sent back to Source for retransmission. When this occurs, the process goes to the Resubmit Packet state and the packet is recreated with the same characteristics as the discarded packet except that the deadline is updated (with respect to the current time). Source then unconditionally returns to the idle state.
Rusty O. Baldwin
Appendix A. Simulation Documentation
243
Deliver (CP_REQUEST) (RCVDTXCONFIRM)
Start
Idle
Mark HOL
(ARRIVAL)/INC_ARRIVALS Insert
Figure A.13: Packet Queue Process Model A.3.2.2
Packet Queue
Packet Queue receives packets from Source and sends packets, upon request, to the process Tx Coordination sta. Figure A.13 is the process model for Packet Queue. Packet Queue, as with Source, is not part of the IEEE 802.11 specification. Packet Queue begins in the Idle state. If CP REQUEST (i.e., contention period packet request) become true, it goes to the Deliver state. If transmission control is true (cf., Section A.4.1.32), Packet Queue will check the packet to be delivered to see if can be transmitted before its deadline. If it can, it is delivered to Tx Coordination sta. Otherwise, it is discarded and the next eligible packet for delivery is chosen. The delivery order is by packet class; first, hard real-time packets, next, soft real-time packets, and finally, data packets. The queue discipline is either first-come-first-served (FCFS), last-come-first-served (LCFS), earliest-deadline-first (EDF), shortest-job-first (SJF), longest-job-first (LJF), or random (cf., Section A.4.1.26).
Rusty O. Baldwin
Appendix A. Simulation Documentation
244
ARRIVAL is true when a packet arrives from Source. Along with the transition condition ARRIVAL, there is also what is called an “executive” statement (e.g. (ARRIVAL)/ INC ARRIVAL). The statement INC ARRIVAL is executed after ARRIVAL becomes true and before entering the Insert state. INC ARRIVAL is simply a C statement that increments a counter to track the number of packet arrivals. The counter is used for statistical purposes to determine the percentage of packets blocked due to a full queue. After INC ARRIVAL is executed, the arriving packet is placed in the appropriate queue (i.e., hard, soft, or data). After a packet has been transmitted, RCVDTXCONFIRM becomes true. Packet Queue transitions to the Mark HOL state and marks the next packet to be selected for transmission with the current time. This is done for statistical purposes only. The number of packets that can be held in the queue can be set to any desired value by adjusting the appropriate parameter in the Node Editor. The default value is 200 packets for each subqueue; hard real-time, soft real-time, and data.
A.3.2.3
Sink
The Sink process receives packets from the Rx Coordination process. Currently, its only function is to destroy the packet. Its process model is not shown.
A.3.2.4
Transmitter, Receiver, and Antenna
The last process models which are not part of the IEEE 802.11 specification to be discussed are the transmitter, receiver, and antenna. The transmitter allows packets to be sent outside the node. Three types of transmitters are supported: point-to-point, bus, and radio. The receiver allows packets to be received from other nodes and has the same supported types as the transmitter. The antenna process model are used to specify antenna properties for radio transmitters and receivers. Attributes of the antenna such as antenna type, aiming parameters, and antenna patterns may be specified. The simulation model uses the default transmitter, receiver, and antenna (i.e., omni) available in the Node Editor. Their process
Rusty O. Baldwin
Appendix A. Simulation Documentation
245
models are not accessible to the user and are not shown.
A.3.2.5
Backoff Procedure
This process implements the backoff function of IEEE 802.11 and is shown in Figure A.14. After Start, the process is in the No Backoff state. This means that either the backoff counter is not active or has reached zero. Normally, it stays in this state until it gets a request to choose another backoff count (i.e., RCVDBACKOFF). If the RT-MAC (real-time MAC) protocol is active (cf., Section A.4.1.17), the RCVDNEXTBACKOFF and RCVDSLOT signals will cause the executives update backoff values() or decrement slot count() to be executed respectively (cf., Section A.3.2.2). These executives will also execute when RTMAC is not active but it that case, they will return immediately. When RT-MAC is active update backoff values() records backoff values (or slot counts) obtained from other stations transmissions (even if the packet was not meant for this station). The decrement slot count() executive decrements all the slot counts that have been received from the other stations in the network (if any). Refer to Chapter 5 for a complete description of the purpose and operation of this algorithm. When RCVDBACKOFF becomes true, Tx Coordination sta has requested a backoff timer be set and get slotCnt() is executed. This executive chooses an initial backoff value (if RT-MAC is active, it also ensures that the backoff value is not the same as any other stations backoff value) and then enters the Channel Busy state. In the Channel Busy state, backoff values received from other stations will be recorded if RT-MAC is active (via (RCVDNEXTBACKOFF)/ update backoff values()). If a cancel (i.e., RVCDCANCEL) is received from Tx Coordination sta (i.e., the packet waiting to be transmitted will not be transmitted after all) the process returns to the No Backoff state and send bkdone slotcnt() sends to Tx Coordination sta the current slot count value. If RCVDIDLE becomes true, the process goes to the Channel Idle state. If RCVDSLOT becomes true the executive decrement slot count from nobackoff() is executed prior to entering the Channel Idle state. The decrement slot count from nobackoff() executive decrements the
Rusty O. Baldwin
Appendix A. Simulation Documentation (RCVDNEXTBACKOFF)/update_backoff_values()
(RCVDSLOT)/decrement_slot_count()
(RCVDNEXTBACKOFF)/update_backoff_values()
(RCVDBACKOFF)/get_slotCnt() Channel_ Busy
No_ Backoff
Start
246
(default)
(RCVDBUSY) (default)
(RCVDCANCEL)/ send_bkdone_slotcnt()
(RCVDSLOT)/ decrement_slot_count _from_nobackoff()
(SLOT_COUNT_ZERO_AND_NOT_BUSY)/ send_bkdone_minus_one()
(RCVDCANCEL)/ send_bkdone_slotcnt()
(RCVDIDLE)
Channel_ Idle
(RCVDNEXTBACKOFF)/update_backoff_values()
(default)
(RCVDSLOT)/ decrement_slot_count()
Figure A.14: Backoff Procedure Process Model slot counts from other stations but does not decrement this stations slot count. In the Channel Idle state, the slot counters (this stations and the other stations) are decremented once for every slot (i.e., (RCVDSLOT)/decrement slot count()). If the channel becomes busy, the process returns to Channel Busy. When the backoff count reaches zero in the Channel Idle state, the BkDone signal is sent (i.e., (SLOT COUNT ZERO AND NOT BUSY)/ send bkdone minus one()). If a cancel is received in this state, the executive send bkdone slotcnt() is executed as in the Channel Busy state. The graphical SDL description of this part of the simulation model is shown in Figure A.15. This SDL description defines the behavior of the process and shows the computations that the executive statements and process states implement.
Rusty O. Baldwin
Appendix A. Simulation Documentation
Process Backoff Procedure
� �
� ?
� '$ �
�
Done
�
�
&%
mBkIP:=false
No Backoff
@
NextBackoff
�
Backoff
Add slot count received from other station to backoff value list
@ @
(< 0)
@ � ?
cnt
�
@
(≥ 0)
@ @
-
(true)
@ @
�
@
@
@ @
?
� Idle
@
call decrement slot count from nobackoff()
-
�
�
Slot
@
—
� ?
Busy
@
call decrement slot count()
� �
� �
—
�
�
@ �
@@
Cancel
@
@@
�
�
@
�
�
�
�
Channel Idle
�
?
Channel Busy
Busy
@
�
—
�
slotCnt:=cnt
�
�
� —
Enhanced (false) Algorithm
slotCnt:=call choose slotCnt(0,cw)
�
@
call update backoff values()
mBkIP:=true
Idle
�
�
�
Slot
� *
@
slotCnt=0
Cancel
� ?
� Channel Busy
�@
BkDone(-1)
BkDone(slotCnt)
@
'$'$ Done
Done
&%&%
Figure A.15: Backoff Procedure – SDL Description
247
Rusty O. Baldwin A.3.2.6
Appendix A. Simulation Documentation
248
Data Pump
Data Pump (Figure A.16) is the process that receives the packet to be transmitted and places it onto the channel. The process begins, as usual, in Start and immediately proceeds to the Tx Idle state. If the process receives a TXREQUEST, it obtains the packet to transmit and sends a busy signal to the station. Then it goes to the Wait TxStart state. It will stay in this state until an idle or a slot has been detected, whereupon it will go to the Send Frame state and, like Packet Queue, if transmission control is true will check the packet to see if can be transmitted before its deadline. If the packet cannot be transmitted prior to its deadline, it is discarded and Tx Coordination sta is informed. Otherwise, Data Pump transmits the frame. After transmitting the frame, it returns to the Tx Idle state. A similar procedure occurs from the Tx Idle state when the ACKREQUEST condition is true. In this case, however, the process does not need to wait for an idle or a slot to be detected since sending an ACK implies that this station alone needs to respond. Hence, there is no possibility of a collision occurring. The SDL description of Data Pump behavior is shown in Figure A.17 below.
A.3.2.7
Filter MPDU
This process determines whether a received packet is bound for the station that received it. In the simulation model, its function is greatly simplified since the process does not need to handle the point coordination function (PCF) control packets, authentication, or multicast packets and the like, which have not been implemented. The Filter MPDU process model is shown in Figure A.18. After beginning in the Start state, the process proceeds to Filter Idle. In this state, the process simply waits for an incoming packet. When a packet arrives, the process transitions to the Process Packet state. In this state the packet is examined and discarded if it is corrupt due to bit errors or collisions. If it is not corrupt, the process determines whether the packet is bound for this station. If so, it is sent on to Rx Coordination. If not, the Network Allocation Vector (NAV) contained in the packet
Rusty O. Baldwin
Appendix A. Simulation Documentation (default)
(default)
(TXREQUEST)/ get_packet_send_busy() Start
249
Tx_Idle
Wait_ TxStart
(BUSY_IDLE_SLOT)/pass_interrupt_on()
(IDLE_SLOT)
(ACKREQUEST)/ get_packet_send_busy()
Send_ Frame
Figure A.16: Data Pump Process Model (e.g., the amount of time the channel will be in use due to this transmission) is obtained, and then the packet is discarded. If RT-MAC is being used, the packet will also contain the next backoff value that the transmitting station will be using. This value will be sent to Backoff Procedure via the SENDBACKOFF signal. The process model is quite simple since most of the processing is contained within the Process Packet state. The SDL description of the process are shown in Figures A.19 and A.20. The cache referred to in the SDL description is a cache of packet identifiers to permit duplicate packet filtering. This allows the station to detect and discard packets that may have been resent due to a lost ACK.
A.3.2.8
Channel State
The state names in the Channel State process (Figure A.21) reflect the physical and virtual busy channel detection capability of an IEEE 802.11 station. The physical busy channel detection capability uses a standard carrier sensing (CS) process. The virtual busy channel detection capability uses a network allocation vector (NAV). The NAV is a value contained
Rusty O. Baldwin
Appendix A. Simulation Documentation
Process Data Pump
�
�
�
�
�
250
� Send Frame
�
� @
XMIT PACKET dTx:=aTxRfDelay +aTxPlcpDelay
@ �
� Tx Idle
�
@
@
�
�
Busy
@
Idle
@
Busy
�
� Wait Tx Start
Slot
�
@
�
—
Idle
-� ? @ @ Packet
@
Late AND Enhanced Algorithm
@
?
�
Send Frame
@
@
Slot
� �
@ @
@
@
Resubmit Packet
@ @ @
(true)
@
(false)
(true)
call discard packet
(false)
�
Slot
�
@ @
�
�
@
Idle
@
� �
� Tx Idle
�
TxRequest
Busy
TxConfirm
�
�
�
�
� ? Tx Idle
� �
Figure A.17: Data Pump – SDL Description
Resubmit
Rusty O. Baldwin
Appendix A. Simulation Documentation
251
(default)
(RXMPDU_FROM_PHY)
Filter_ Idle
Start
Process Packet
Figure A.18: Filter MPDU Process Model in an incoming packet which indicates the amount of time the channel will be needed to complete the current transmission (i.e., transmit an acknowledgment in response to a received packet). Stations in the network will not initiate a transmission for the duration of a NAV. This ensures that the ACK for the current packet does not collide with a new packet transmission. Both the CS and the NAV must indicate an idle channel for a station to initiate a transmission. The process will be in state Cs Nav when the channel is both physically (CS) and virtually (NAV) busy. The process will be in Cs noNav when the channel is physically busy but not virtually busy, and so on. As always, the process model begins in the Start state. From there it goes to the Cs noNav state. There are several transition conditions which are common to most states. Those common transition conditions are: RCVDCHANGENAV, DIFS OR EIFS, and SETNAV CLEARNAV. The condition RCVDCHANGENAV becomes true after the Filter MPDU process decodes a packet containing a NAV and determines that the current NAV needs to be changed. Channel State will update its NAV and return to whatever state it was in prior to the condition becoming true. When the condition DIFS OR EIFS is true, Channel State will update the value used for the inter-frame space (IFS) and then return to the state it was in prior to DIFS OR EIFS becoming true. The IFS is the amount of time the station waits after the channel is both physically and virtually idle before actually declaring the channel idle. The DIFS value is the smaller value and is used as the IFS when the packet cyclic redundancy code (CRC) is verified as good. If the CRC check fails, then the longer EIFS is used for the IFS. The condition SETNAV CLEARNAV becomes true after the Filter MPDU
Rusty O. Baldwin
Appendix A. Simulation Documentation
Process Filter MPDU
�
�
�
�
252
1 of 2
'$ dPsp:=aSifs Time+calcDur (first(import(mBrates)), stuff(aMpduDuration Factor, sAckCtsLng +aPlcpHdrLength) +aPreambleLength)
�
&%
src:=if rts=ftype(pdu) then rts else src fi
cache:= clearTuple Cache(cache)
�
not sta
� Filter Idle
@ @
�
@
durId(pdu)
@ @ @ (1:32767)
(49153:51159)
RxMpdu (pdu, endRx)
@
? dNav:=dPsp
dAck:=if (durID(pdu) > 32767) then dUsec (durId(pdu)) else 0 fi
? SetNav(dNav)
@
� '$ sta addr
� �
� Filter Idle
�
&%
Figure A.19: Filter MPDU – SDL Description (1 of 2)
(else)
Rusty O. Baldwin
Appendix A. Simulation Documentation
Process Filter MPDU
253
2 of 2
'$
'$
sta addr
uni cast
&%
&%
dNav:=dUsec (durID(pdu)), src:=misc
@ @
(=1)
@
retryBit (pdu)
@ @ @
(=0)
@ @
(true)
@
Bit Errors
@
dup:=searchTupleCache (cache,addr2(pdu), seq(pdu))
@ @ (false)
UseEifs
@ (true)
@ @
@
Collision
@
@ @ (false)
� �
� Filter Idle
UseDifs
�
SENDBACKOFF
(false) not sta
@ @
-?
(false)
(true)
? RxMpdu(pdu)
@
@ @
(else)
@
basetype (pdu)
@ @ @
addr1 (pdu)=aMac Address
@ &% @ @
@ @ @
@
@
@
'$
@ @ dup
(data,management)
@
NeedAck
@ (addr2(pdu))
(true)
'$ uni cast
cache:=updateTupleCache (cache,addr2(pdu), seq(pdu))
&% � �
-
?
Filter Idle
Figure A.20: Filter MPDU – SDL Description (2 of 2)
� �
Rusty O. Baldwin
Appendix A. Simulation Documentation
DIFS_OR_EIFS/ set_difs_or_eifs()
(default)
RCVDCHANGENAV/change_nav()
Cs_ noNav
RCVDCHANGENAV/ change_nav()
BUSY/BUSY_TO_DATA_PUMP
DIFS_OR_EIFS/ set_difs_or_eifs()
NoCs_ NoNav
RCVD_TIFS/send_ idle_and_set_slot_timer()
Start
Wait_IFS (default) (RCVDSETNAV)/ set_nav_timer() DIFS_OR_EIFS/ set_difs_or_eifs()
RCVDCHANGENAV/ change_nav()
(default)
RCVD_TSLOT/ send_and_set_slot _timer()
TIFS_NOT_ ACTIVE/ send_idle_and_ set_slot_timer()
RCVD_TNAV/set_ cursrc_and_tifs_timer()
254
(RCVDSETNAV)/ set_nav_timer_w_ busy()
RCVD_TNAV/set_ cursrc_and_tifs_timer()
DIFS_OR_EIFS/ set_difs_or_eifs()
RCVD_TSLOT/ send_and_set_slot _timer()
(BUSY) RCVD_TSLOT/ send_and_set_slot _timer()
noCs_ Nav
Cs_Nav
(default)
(IDLE) (default)
RCVDCHANGENAV/ change_nav()
RCVDCHANGENAV/ change_nav()
DIFS_OR_EIFS/ set_difs_or_eifs()
Figure A.21: Channel State Process Model process decodes a packet containing a NAV and determines that the NAV needs to be set or cleared. After setting or clearing the NAV the process again returns to the state it left from. There are two ways to go to another state from Cs noNav. First, the condition RCVDSETNAV becomes true, indicating that the process now has a non-zero NAV. This will take the process to the Cs Nav state and set the NAV timer. The second way to leave Cs noNav is for the channel to physically be detected as idle. When this happens the process sets a timer based on the current value for the IFS, and then goes to the Wait IFS state. In the Wait IFS state, there are three possibilities: (1) the condition RCVDSETNAV could become true, (2) the IFS timer could expire or be inactive, or (3) the channel could again become busy. If the RCVDSETNAV becomes true, the process goes to the Cs Nav state (even though the channel is only virtually busy) and sets the NAV timer. If the IFS timer expires or it is not active, the process will declare the channel idle, start a slot timer (to begin counting slots) and go to the noCs noNav state. If the channel is detected as busy prior to the IFS timer expiring, the process will go to the Cs noNav state. When the IFS
Rusty O. Baldwin
Appendix A. Simulation Documentation
255
timer does expire in the Cs noNav state, it will be ignored. The Cs Nav state will be left if the NAV timer expires or the channel is detected as idle. In the first case, the process will set the IFS timer and go to the Cs noNav state. In the second case, the process will simply go to the noCs Nav state. The noCs Nav state will be exited if the channel is detected as busy. In that case, the process will go to the Cs Nav state. The other way to exit this state is for the NAV timer to expire. When this happens, the process will set the IFS timer and go to the state Wait IFS. The noCs noNav state will be exited if the channel is detected as busy. When this happens, the process sends a busy interrupt to the process Data Pump and goes to Cs noNav. If the RCVDSETNAV condition becomes true in this state, the NAV timer is set with the appropriate value, a busy interrupt is sent, and the process goes to noCs Nav. The SDL description of Channel State are shown in Figures A.22 and A.23.
A.3.2.9
Tx Coordination sta
The Tx Coordination sta process model is shown in Figure A.24. After Start, Tx Coordination sta goes to the TxC Idle state. The process will leave TxC Idle when it detects that the station queue has a packet to transmit (i.e., PDUREQUEST is true). It will request the packet be delivered from the queue and then enter the state GET PACKET to wait for its arrival. From here, if NOELIGIBLEPACKET becomes true, the process returns to TxC Idle. NOELIGIBLEPACKET could become true if transmission control is true and Queue determines that no packet in the queue will arrive on time if transmitted. Once SENTPACKET is true, the process obtains the packet, makes a copy of it (for later retransmission if necessary), and then goes to the Wait MPDU Backoff state. It stays in Wait MPDU Backoff while the backoff timer is non-zero. When the backoff timer is determined to be zero (i.e., INTRPTNOTINBACKOFF is true), the packet is sent to the process Data Pump for transmission and the Wait Pdu Sent state is entered.
Rusty O. Baldwin
Appendix A. Simulation Documentation
256
Process Channel State
�
�
�
�
1 of 2
� �
dSifs:=aSifsTime, dRxTx:=aRxTx Turn aroundTime
@
dSlot:=aSlotTime, dDifs:=dSifs +2dSlot
not active(Tifs)
@
@
� Wait IFS
PHY(cs)
Tifs
� (idle)
dEifs:=aSifsTime+ calcDur(first(import(mBrates)),
� set(now+ dSlot,Tslot)
stuff(aMpdu DurationFactor, sAckCtsLng)+aPlcpHdrLength +aPreamble Length+dDifs)
� �
�
? —
��
noCs noNav
PHY(cs)
�
@
@
SetNav (dNav)
@
Tslot
cs:=busy, tNavEnd:=0 tNavEnd:= tRef+dNav
@
@ @ @ �(idle) ? ��
Cs noNav
@ @ @
�
—
@
�
Slot
@
�
@ @ (idle) @
�
—
set(tNavEnd, Tnav)
�
�@ � �
�
��
� �
Wait IFS
� noCs Nav
�
set(now+ dIfs,Tifs)
�� —
SetNav (dNav)
tNavEnd:= tRef+dNav
@ @ @ (busy) ? � �
set(now+dSlot, Tslot)
� Busy
@
-? ?
cs
? set(tNavEnd, Tnav)
cs
Busy
� �
(busy)
Cs noNav
�
PHY(cs)
�
@ @ @
@ @ @ ?(busy) � ��
dIfs:=dEifs
curSrc:=nosrc
@
cs
Idle
@
�
�
Figure A.22: Channel State – SDL Description (1 of 2)
�
� Cs Nav
�
Rusty O. Baldwin
Appendix A. Simulation Documentation
Process Channel State
�
noCs Nav
�
PHY(cs)
@ @
(idle)
cs
@ @ @ � �
? —
�
�
�
�
@
@
@
��
?
Cs Nav
set(now+dIfs, Tifs)
�
@
?
�
—
UseDifs
curSrc:=nosrc
(idle)
�
noCs Nav
�
�
�
ChangeNav (dNav)
set(now+dIfs, Tifs)
�
�
@
@
SetNav (dNav)
dIfs:=dEifs
dIfs:=dDifs
� set(tRxEnd +dIfs,Tifs)
@ @ @ (false)
@ @ @
@
� � �
@ @ @
tNew > tNavEnd
�
@ @ @
(true)
tNavEnd:=now, curSrc:=nosrc
-
(false) (false)
� tNavEnd:=0, curSrc:=nosrc
@ @ @
curSrc= rts
-
set(tNavEnd, Tnav)
(true)
� —
ClearNav (newSrc)
-
tNew:=tRef +dNav
@ @ @
�
�
@ Rts Timeout
(true)
dIfs:=dEifs, set(now,Tnav)
� Cs noNav
� noCs Nav, Cs Nav
newSrc= cswitch
Tnav
�
�
@
@
@ @ @
?
�� ��
� * /* all states */
@
� Wait IFS
�
UseEifs
@ @ @ �
�
�
cs
�
�
�
Cs Nav
(busy) curSrc:=nosrc
(busy)
��
2 of 2
�
PHY(cs)
Tnav
257
tNavEnd:=tNew, curSrc:=newSrc
�
? —
Figure A.23: Channel State – SDL Description (2 of 2)
�� ��
� —
�
Rusty O. Baldwin
Appendix A. Simulation Documentation
258
(PDUREQUEST)/REQUESTPACKET TxC_ Idle
Start
(NOELIGIBLEPACKET)
Get_ Packet
(default)
(SENTPACKET)/GETPACKET (default) (default)
Wait_ MPDU_ Backoff
(INTRPTNOTINBACKOFF)/ TXREQUEST (default)
Wait_ Pdu_Sent
(RVCDTXCONFIRM)/ set_trsp_wait_ack() (default)
Wait_ ACK (RVCDTRSP)/ack_lost()
(RVCDACK)/got_ack() TxC_ Backoff (GOTBKDONENOCONT)/RESETCONT
(GOTBKDONECONT)/ get_next_backoff_value()
Figure A.24: Tx Coordination sta Process Model If Data Pump sent the packet, RCVDTXCONFIRM will become true. A timer is then set to wait for the ACK from the receiving station and the process goes to Wait Ack. If the timer expires in this state, the packet is assumed to have been lost and a flag is set to reflect that assumption. If transmission control is true, the executive ack lost() will check to see if the packet is late. If so, or if the maximum number of retries has been exceeded, it will discard the packet. If the ACK is received, the same flag is set to reflect a received ACK and the process goes to TxC Backoff. In this state, another backoff count is obtained and the station waits for the backoff timer to expire. When this occurs, based on the value of the flag, the process goes to TxC Idle, if an ACK was received, or to Wait Mpdu Backoff, if the ACK was not received. If Data Pump discarded the packet (since it was late or would have arrived late), RCVDTXBLOCKED will become true and Tx Coordination sta will behave as above when an ACK is successfully received. The SDL description of Tx Coordination sta are shown in Figures A.25 and A.26.
Rusty O. Baldwin
Process Tx Coordination sta
Appendix A. Simulation Documentation
�
�
�
�
�
�
TxC Idle
� �
� @
Get Packet
�
�
�
�
1 of 2
� TxC Backoff
�
Done
� TxC Idle
�
@ Sent Packet
ccw:=aCWmin, dcfcw:=ccw, atimcw:=ccw
@
@ @ (false) Backoff@ @ @ @
Backoff(ccw,-1)
� TxC Idle
�
(fsdu)
ssrc:=0, slrc:=0
�
�
@ Pdu Request
dSifsDelay:= aSifsTime
�
�
259
(true)
@ @ (true) Idle @
@ @ @
(false)
�
@
Backoff(ccw,-1)
�
� ?
�
Wait Mpdu Backoff
�
@
not(mBkIP)
@
�
'$ ? - send mpdu &%
Figure A.25: Tx Coordination sta – SDL Description (1 of 2)
Rusty O. Baldwin
Appendix A. Simulation Documentation
260
Process Tx Coordination sta
2 of 2
'$
'$
send mpdu
ack fail
&% TxRequest (tpdu)
@
� �
&%
ccw:= if ccw=aCWmax then aCWmax else (2*ccw)+1 fi
� Wait Pdu Sent
�
@
Backoff(ccw,-1)
TxConfirm
@
tpdu:=setRetry (tpdu), ssrc:=ssrc +1
set(now+dUsec(aSifsTime+ calcDur(txrate,stuff(aMdpu DurationFactor,sAckCtsLng)) +aPlcpHeaderLength+ aPreambleLength+aSlotTime, Trsp)
� �
(false)
@ @ @
ssrc= aShortRetr yLimit
@ @ @
(true)
� Wait Ack
Ack
ccw:=aCWmin
�
@
@
� Trsp
�
-
?
TxC Backoff
'$
ccw:=aCWmin ssrc:=0,slrc:=0
ack fail
@
&%
Backoff(ccw,-1)
� �
� TxC Backoff
�
Figure A.26: Tx Coordination sta – SDL Description (2 of 2)
� �
Rusty O. Baldwin
Appendix A. Simulation Documentation
(default)/SAVEALLINTERRUPTS
(RCVD_SIFS)/TXREQUEST
Wait_Sifs
261
Wait_ TxDone
(RCVDTXCONFIRM)
(default)/SAVEALLINTERRUPTS
(RCVDNEEDACKNOCACHE)/ set_tifs_timer_and_build_ack() (VALID_INTERRUPT_ALL_CACHE)
RxC_ Idle
Start
(default)
Process_ Interrupt
Figure A.27: Rx Coordination Process Model A.3.2.10
Rx Coordination
The process model for Rx Coordination (Figure A.27) begins in Start and goes to Rx Idle. If an interrupt occurs or there are any saved interrupts (i.e., VALID INTERRUPT ALL CACHE) the process will transition to the Process Interrupt state, process the interrupts, and return to RxC Idle. The RCVDNEEDACKNOCACHE condition being true indicates that an ACK needs to be sent in response to a received packet. The process will set a timer, build the ACK and go to the Wait Sifs state. After the timer expires the process will send the ACK packet for transmission and enter the Wait TxDone state. After receiving confirmation of packet transmission, the process leaves Wait TxDone and returns to RxC Idle. The SDL description of Rx Coordination is shown below in Figure A.28.
Rusty O. Baldwin
Appendix A. Simulation Documentation
262
Process Rx Coordination sta
�
�
�
� �
dSifsDelay:= aSifsTime
� @
dRsp:=dUsec(aSifsTime+ calcDur(stuff(aMpdu DurationFactor,sAckCtsLng +aPlcpHeaderLength)+ aPreambleLength))
� �
�
� RxIndicate (pdu)
@
�
@ (pdu) @ @ rspdu:=MkCtl (ack,ackTo)
set(dSifsDly,Tsifs)
�
�
SINKREQUEST
Ack
� �
Wait Sifs
� RxC Idle
(ack)
@
@ �
—
�
� �
� RxC Idle
� �
� �
*
� �
�
@
�
@ @ (data) ftype @
*
� Wait TxDone
TxConfirm
@
� � @
�
dAck:=dAckif dAck > 0 then dRsp else 0 fi
�
�
Tsifs
TxRequest (rspdu)
� RxC Idle
NeedAck (ackTo)
� Wait Sifs
�
�
Figure A.28: Rx Coordination – SDL Description
�
Rusty O. Baldwin A.3.2.11
Appendix A. Simulation Documentation
263
Packet Format
The packets that are transmitted in the simulation model contain several fields, some of which are specified by IEEE 802.11 and some which are used to record information about the packet as it moves through the network. The packet format used in the simulation model is shown below in Table A.1. The fields Mean Time in Good State, Mean Time in Bad State, and Probability of Bit Error are used to pass error model information to the error model in the transceiver pipeline (Section A.4.6.3). This information is used to initialize the model and is needed only once, but there does not appear to be any other way to get the required information to the model within the transceiver pipeline.
A.3.2.12
Traffic Monitor
The purpose of Traffic Monitor is to gather statistics about the network. It acts as a network “sniffer” or oracle by receiving all transmissions and recording traffic statistics. The OPNET node model consists of a single processor node. The Traffic Monitor process model (Figure A.29) begins in Start and then goes to the Idle state. Upon reception of a packet it goes to Process Packet, records all the statistics and then returns to Idle. Several statistics of interest cannot be determined from packet traffic. These include transmission attempts, station queue size, packets turned away due to a full queue, and packets not transmitted due to deadline expiration. These statistics are sent to Traffic Monitor via RVCDATTEMPTSTAT, RVCDQSTAT, RCVDTURNEDAWAYSTAT, and RCVDBLOCKEDSTAT respectively. After recording the statistic, Traffic Monitor returns to Idle. The only stations’ queue size and % packets turned away tracked is that of Node 0. They are used as an indication of the behavior of the other stations.
Rusty O. Baldwin
Appendix A. Simulation Documentation
264
Table A.1: Simulation Model Packet Format Field Name Data Type Description Type
integer
Packet type
Subtype
integer
Packet subtype
Address 1
integer
Address of the destination station
Address 2
integer
Address of the source station
Duration/ID
integer
Network Allocation Vector
Deadline
double
Packet deadline
Retry
integer
Retry bit
Sequence Number
integer
Packet sequence number
Fragment Number
integer
Packet fragment number
Timestamp
double
General purpose timestamp
endRx
double
Time reception ended
Class
integer
Packet class
Xmit Duration
double
Transmit time
Debug Packet
integer
Debug packet flag
Data Octets
integer
Number of data octets in packet
Attempts
integer
Number of attempts to send original packet
Creation Time
double
Time original packet was created
Transmit Start Time
double
Starting time for current transmission
HOL Time
double
Time packet reached head-of-line in transmit queue
Deadline Variance
double
Allowable deadline variance
Next Backoff Value
integer
Sending stations next backoff value
Mean Time in Good State
double
Mean good time for error model
Mean Time in Bad State
double
Mean bad time for error model
Probability of Bit Error
double
Bit error probability for error model
Rusty O. Baldwin
Appendix A. Simulation Documentation
Update Queue Size (RCVDATTMPTSTAT)
(RCVDQSTAT)
265
Update Attempts
(END_SIMULATION)/ record_stats(“FINAL”)
(RXMPDU)
Start
Process Packet
Idle
(default)
Update Turned Away
(RCVDTURNEDAWAYSTAT)
(RCVDBLOCKEDSTAT)
Update Blocked
Figure A.29: Traffic Monitor Process Model
A.4
Simulation Parameters
There are two types of simulation parameters. One type controls the simulation model such as simulation length and data collection start time. The other defines a characteristic of the network such as the number of stations. These parameters are discussed in this section. The parameters are organized by node and process models. The parameters are presented within the node or process model section in which they are originally defined.
A.4.1
IEEE80211STA
IEEE80211STA is the node model which defines an IEEE 802.11 station within the simulation model. It defines the interconnections between the process models. It is shown in Figure A.8. Over 30 different parameters can be varied, most of which are IEEE 802.11 parameters. These parameters are described below.
Rusty O. Baldwin A.4.1.1
Appendix A. Simulation Documentation
266
aCCATime
This parameter specifies the amount of time within every slot the clear channel assessment (CCA) mechanism has to determine whether the channel is idle. Its default value is 15 usec.
A.4.1.2
aCWmax
This is the maximum value (in slots) of the contention window. Its default value is 1023.
A.4.1.3
aCWmin
This is the minimum value (in slots) of the contention window. Its default value is 31.
A.4.1.4
aMPDUMaxLength
This specifies the maximum supported MAC protocol data unit (PDU) length. Its default value is 8191 octets.
A.4.1.5
aPLCPHeaderLength
This parameter specifies the length of the header in the physical layer convergence protocol (PLCP). Its default value is 48 bits.
A.4.1.6
aPreambleLength
This parameter specifies the length in bits of the physical layer frame preamble. Its default value is 144 bits.
Rusty O. Baldwin A.4.1.7
Appendix A. Simulation Documentation
267
aRxPLCPDelay
This parameter specifies the delay introduced by the PLCP during frame reception. Its default value is 1 usec.
A.4.1.8
aRxRFDelay
This parameter determines the RF delay introduced during a reception. Its default value is 3 usec.
A.4.1.9
aRxTxTurnaroundTime
This parameter specifies the time the radio requires to change modes from receive to transmit or transmit to receive. The default value is 5 usec.
A.4.1.10
aShortRetryLimit
This parameter specifies how many attempts will be made to transmit a short packet. Its minimum value is 1. Its default value is 7.
A.4.1.11
aSifsTime
This parameter defines the short inter-frame space (SIFS) time. Its default value is 10 usec.
A.4.1.12
aSlotTime
This parameter specifies the width of a slot. Its default value is 20 usec.
Rusty O. Baldwin A.4.1.13
Appendix A. Simulation Documentation
268
aTxPLCPDelay
This parameter specifies the delay introduced by the PLCP. Its default value is 5 usec.
A.4.1.14
aTxRFDelay
This parameter determines the RF delay introduced during transmissions. Its default value is 1 usec.
A.4.1.15
ACK Length
This determines the length, in bits, of an ACK packet. The value specified here will override the value specified in sAckCtsLng. Its default value is Default which uses the sAckCtsLng value.
A.4.1.16
ACK Timeout
This determines the length of time the station will wait for an ACK. This is normally calculated by the station but can be specified. Its default value is Default, which uses the internal calculation.
A.4.1.17
Backoff Algorithm
This parameter changes the algorithm used to determine the contention window size and the collision avoidance algorithm. The possible values are “Enhanced Algorithm” (RT-MAC) and “Standard IEEE 802.11.” Its default value is Standard IEEE 802.11.
Rusty O. Baldwin A.4.1.18
Appendix A. Simulation Documentation
269
MACHeaderLength
This parameter determines the length, in bits, of a MAC packet header. Normally the value is calculated internally. Specifying a value here will override this internal calculation. Its default value is Default.
A.4.1.19
Mean Time in Bad State
This determines the mean number of seconds the IEEE 802.11 channel is in a “bad” (i.e., error) state. The accepted values are any number greater than or equal to zero or “Static BER”. The default value is 0.1 seconds. The “Static BER” choice flags the simulation to use a static BER model rather than the bursty BER model (even if Static BER is not selected in Mean Time in Good State below). The static BER model can be thought of as always being in the “bad” state. The Probability of Bit Error (Section A.4.1.25) is used to set the average BER in the Static BER model.
A.4.1.20
Mean Time in Good State
This determines the mean number of seconds the IEEE 802.11 channel is in a “good” (i.e., no bit error) state. The default value is 5.0 seconds. The “Static BER” choice flags the simulation to use a static BER model rather than the bursty BER model (even if Static BER is not selected in Mean Time in Bad State above). The static BER model can be thought of as always being in the “bad” state. The Probability of Bit Error (Section A.4.1.25) is used to set the average BER in the Static BER model.
A.4.1.21
Number of Stations
This parameter informs the station how many stations are in the network. It is used only to determine the set of valid station addresses to transmit to. Its default value is 0 and should
Rusty O. Baldwin
Appendix A. Simulation Documentation
270
be changed to reflect the number of stations in the network.
A.4.1.22
Packet format
This parameter determines the packet format to be used in the station. Its default value is IEEE80211frame. Note the simulation accesses many fields within this frame format. Specifying another frame format that does not include the fields in IEEE80211frame will cause the simulation to fail.
A.4.1.23
Print Errored Packets
This Boolean parameter determines whether the station will print information about packets that have errors in them. Normally, packets with errors are discarded without warning. This can generate a large amount of output and should be used for debugging purposes only. Its default value is false.
A.4.1.24
Print Packets
This Boolean parameter determines whether the station will print information about packets transmitted and received by the station. This can generate a large amount of output and should only be used for debugging purposes. Its default value is false.
A.4.1.25
Probability of Bit Error
This parameter defines the probability of a bit error when the IEEE 802.11 channel is in a “bad” state or is using the static BER model (cf., Section A.4.1.19, A.4.1.20). The default value is 0.8.
Rusty O. Baldwin A.4.1.26
Appendix A. Simulation Documentation
271
Queue Discipline
This parameter defines the queue discipline used in the Queue process. The choices are firstcome-first-served, last-come-first-served, earliest-deadline-first, shortest-job-first, longest-jobfirst, or random. The default value is first-come-first-served.
A.4.1.27
RxTxRate
This parameter specifies the receive and transmit rate for the station. It is integer valued and the RxTxRate multiplied by 500 kbps determines the station’s transmit and receive rate. Its default value is 2 or 1,000,000 bps.
A.4.1.28
sAckCtsLng
This parameter specifies the length of an ACK and a clear-to-send CTS frame. Its default value is 112 bits.
A.4.1.29
sMaxMsduLng
This parameter specifies the maximum length, in octets, of the MAC service data unit (SDU). Its default value is 2304.
A.4.1.30
SA
This parameter specifies the station address (SA). A stations address is a positive integer and must be specified. If this parameter is left to the default value of -1, a simulation error will occur.
Rusty O. Baldwin A.4.1.31
Appendix A. Simulation Documentation
272
Sequence Number
This parameter determines the initial value for packet sequence numbers. Its default value is -1.
A.4.1.32
Transmission Control
This Boolean parameter controls whether transmission control is active. The default value is Off.
A.4.2
IEEE80211MON
IEEE80211MON is the node model for Traffic Monitor discussed in Section A.3.2.12. It has three parameters that can be specified: Data Collection Start, Data Collection Stop, and Backoff Algorithm. The default values are 5.0, 1,000,000.0 seconds, and Standard IEEE 802.11 respectively. The Backoff Algorithm parameter is only used during debugging to turn on or off certain debug statements.
A.4.3
Traffic Monitor
Within this process model, parameters regarding the simulation termination conditions, screen output and file output are defined. There are numerous parameters that can be specified, but they are largely redundant. Sometimes the parameter names will include brackets (i.e., []). The brackets denote other parameters of the same purpose but with different names. For instance, ABC[1-3] would denote three parameters: ABC1, ABC2, and ABC3.
Rusty O. Baldwin A.4.3.1
Appendix A. Simulation Documentation
273
[Throughput, HRT Failure, Collision, Mean Delay] Termination Condition
This parameter determines whether the statistic named (i.e., Throughput, Collision, etc.) will be used as a condition for simulation termination. When all statistics used for termination are within the desired confidence interval (specified below) the simulation will terminate. The allowed values for this parameter are Yes or No. The default value is No.
A.4.3.2
[Throughput, HRT Failure, Collision, Mean Delay] Confidence Interval Width
This parameter specifies the desired width of the statistics confidence interval as a percentage of the mean value of the statistic. The allowed values are 0.5%, 1%, 2%, 5%, 10%, and 20%. For example, if the mean of the statistic is 100.0 and the desired confidence interval width is 2%, the desired width would be achieved when the confidence interval of the statistic was within the range ±1.0. The default value is 2%.
A.4.3.3
[Throughput, HRT Failure, Collision, Mean Delay] Confidence Level
This parameter specifies the desired confidence level of the statistic. The allowed values are 80%, 90%, 95%, and 99%. The default value is 90%.
A.4.3.4
Statistics File
This parameter specifies whether the statistics are saved in a file. The allowed values are NONE (for no statistics file), Use .ef filename (to construct a filename based on the simulation .ef file), or a user specified filename. The default value is NONE.
Rusty O. Baldwin A.4.3.5
Appendix A. Simulation Documentation
274
Print Statistics to Screen
This parameter determines whether the statistics gathered during the simulation are written to the screen. The default value in No.
A.4.4
Source
Within the source process model, the characteristics of the packets submitted for transmission are defined. There are a large number of parameters that can be specified, but they are largely redundant. The type of the parameter is enclosed in parenthesis. Sometimes the parameter names will include brackets (i.e., []). The brackets denote other parameters of the same type and purpose but with different names. For instance, ABC[1-3] (integer) would denote three parameters of type integer: ABC1, ABC2, and ABC3.
A.4.4.1
Active Source (Boolean)
The Source process model can be prevented from placing any data onto the network by setting this parameter to Disabled. If set to Active, Source will generate packets according to the values specified in the other parameters. The default value for this parameter is Active.
A.4.4.2
[Hard Real Time, Soft Real Time, Data] Sources (integer)
This parameter specifies the number of independent sources for the three classes of data (i.e., hard, soft, and data). The number of sources may be from zero to three. The default value is zero.
Rusty O. Baldwin A.4.4.3
Appendix A. Simulation Documentation
275
Number of Stations Transmitted To (double)
This parameter sets the number or percentage of stations in the network this station will transmit to. If value is ≤ 1.0, then the number of stations to transmitted to will be the truncated result of the value of the parameter multiplied by the number of stations in the network. For example, if there are 16 stations in the network and Number of Stations Transmitted To is equal to 0.2, the number of stations transmitted to will be b0.2(16)c or 3 stations. If the number is > 1.0, its truncated value is taken to be the number of stations to transmit to. For example, if the values of the parameter is 10.1, the number of stations transmitted to will be 10 stations. To transmit to all stations set the parameter to 1.0. To specify only one station use 1.1! Any value greater than zero is allowed. To turn off source traffic generation altogether, use the parameter described in Section A.4.4.1. Some preset choices available are: All, One, Two, 10%, 20%, and 50%. Once the number of stations to transmit to is determined, the stations are chosen according to a uniform distribution. The default value for this parameter is 20%.
A.4.4.4
[HRT[1–3], SRT[1–3], D[1–3]] Interarrival Distribution (string)
This parameter specifies the interarrival distribution for the packet sources. If there are 2 Data Sources specified (cf., Section A.4.4.2), the D1 Interarrival Distribution and the D2 Interarrival Distribution will be used to generate packets. The distributions that can be specified are: Bernoulli, chi square, constant, Erlang, exponential, normal, ON-OFF, Pareto, Poisson, uniform, and uniform int. The default value is exponential.
A.4.4.5
[HRT[1–3], SRT[1–3], D[1–3]] Interarrival Parameter [1,2] (double)
This parameter is used to specify the parameters for the interarrival distribution chosen in Section A.4.4.4 above. Up to two parameters can be specified. If a distribution only requires one parameter [HRT[1–3], SRT[1–3], D[1–3]] Interarrival Parameter 1 will be used.
Rusty O. Baldwin
Appendix A. Simulation Documentation
276
Typically, the mean values for the distribution is specified by Interarrival Parameter 1. If the distribution is ON-OFF, Interarrival Parameter 1 specifies the mean ON time, Interarrival Parameter 2 specifies the mean OFF time. If the distribution is Pareto, Interarrival Parameter 1 specifics the mean interarrival time and Interarrival Parameter 2 specifies the Pareto shape parameter. The shape parameter must be greater than 1 and less than two. The default values for these parameters are zero. Refer to the OPNET Simulation Kernel manual [MIL98] for complete details on distribution parameters.
A.4.4.6
[HRT[1–3], SRT[1–3], D[1–3]] ON-OFF Rate (double)
This parameter specifies the rate (in kbps) at which bits arrive when the interarrival distribution is ON-OFF and the source is in the ON state (cf., Section A.4.4.4). The default value is 0.0.
A.4.4.7
[HRT[1–3], SRT[1–3]] Deadline Distribution (string)
This parameter specifies the deadline distribution for the packet sources. If there are 2 Hard Real Time Sources specified (c.f., Section A.4.4.2), the HRT1 Deadline Distribution and the HRT2 Deadline Distribution will be used to generate deadlines. The distributions that can be specified are: Bernoulli, chi square, constant, Erlang, exponential, normal, Poisson, uniform, and uniform int. The default value is exponential.
A.4.4.8
[HRT[1–3], SRT[1–3]] Deadline Parameter [1,2] (double)
This parameter is used to specify the parameters for the deadline distribution chosen in Section A.4.4.7 above. Up to two parameters can be specified. If a distribution only requires one parameter [HRT[1–3], SRT[1–3]] Deadline Parameter 1 will be used. The default values for these parameters is zero.
Rusty O. Baldwin A.4.4.9
Appendix A. Simulation Documentation
277
[HRT[1–3], SRT[1–3] Deadline Lower Bound (double)
This parameter is used to specify an lower bound on deadline values. This allows the deadline distribution to be truncated at a minimum value. The default value is zero (or no lower bound).
A.4.4.10
[HRT[1–3], SRT[1–3] Deadline Upper Bound (double)
This parameter is used to specify an upper bound on deadline values. This allows the deadline distribution to be truncated at a maximum value. The default value is zero (or no upper bound).
A.4.4.11
[HRT[1–3], SRT[1–3], D[1–3]] Packet Size Distribution (string)
This parameter specifies the packet size distribution for the packet sources. If there are 2 Data Sources specified (c.f., Section A.4.4.2), the D1 Packet Size Distribution and the D2 Packet Size Distribution will be used to generate packets sizes. The distributions that can be specified are: constant, geometric, and uniform int. The default value is constant.
A.4.4.12
[HRT[1–3], SRT[1–3], D[1–3]] Packet Size Parameter [1,2] (double)
This parameter is used to specify the parameters for the packet size distribution chosen in Section A.4.4.11 above. Up to two parameters can be specified. If a distribution only requires one parameter [HRT[1–3], SRT[1–3], D[1–3]] Packet Size Parameter 1 will be used. The default value for Parameter 1 is 200. The default value for Parameter 2 is zero.
Rusty O. Baldwin
Appendix A. Simulation Documentation
A.4.5
Data Pump
A.4.5.1
Percentage of Blocked Packets Resubmitted
278
This parameters specifies the percentage of packets not transmitted due to deadline expiration that are resubmitted to the Queue process. The resubmitted packets are selected based on the outcome of a uniform random number generator in the range 0.0 to 1.0. For example, if the percentage of packets to be resubmitted is 0.10 and the outcome of the random number generator is 0.23, the packet is not resubmitted. If the outcome is ≤ 0.10 the packet is resubmitted. The default value is 0.0.
A.4.6
Receiver, Transceiver Pipeline, Transmitter, Antenna
The parameters for these OPNET objects generally do not need to be changed. If they do need to be changed, the OPNET Node Editor is used. Within the simulation model, the transceiver pipeline has been left in the default configuration as supplied by MIL3 (except for the cases noted below in Section A.4.6.3). The source files and routine names have, however, been changed to be specific to this simulation model. This allows the transceiver pipeline to be changed without affecting other OPNET models.
A.4.6.1
Receiver
The default values for the Receiver parameters are as follows:
1. modulation - bpsk 2. channel.channel - channel[0] 3. channel.data rate - 1,000,000 4. channel.packet formats - all formatted, unformatted
Rusty O. Baldwin
Appendix A. Simulation Documentation
5. channel.bandwidth - 22,000 6. channel.min frequency - 2,400 7. channel.spreading code - 1.0 8. channel.processing gain - channel bw/dr 9. noise figure - 1.0 10. ecc threshold - 1.0 11. ragain model - IEEE80211 ragain 12. power model - IEEE80211 power 13. bkgnoise model - IEEE80211 bkgnoise 14. inoise model - IEEE80211 inoise 15. snr model - IEEE80211 snr 16. ber model - IEEE80211 ber 17. error model - IEEE80211 error 18. ecc model - IEEE80211 ecc
A.4.6.2
Transmitter
The default values for the Transmitter parameters are as follows:
1. modulation - bpsk 2. channel.channel - channel[0] 3. channel.data rate - 1,000,000
279
Rusty O. Baldwin
Appendix A. Simulation Documentation
280
4. channel.packet formats - all formatted, unformatted 5. channel.bandwidth - 22,000 6. channel.min frequency - 2,400 7. channel.spreading code - 1.0 8. channel.power - 1.0 9. rxgroup model - IEEE80211 rxgroup 10. txdel model - IEEE80211 txdel 11. closure model - IEEE80211 closure all 12. chanmatch model - IEEE80211 chanmatch 13. tagain model - IEEE80211 tagain 14. propdel model - IEEE80211 propdel
A.4.6.3
Transceiver Pipeline
Bit Error Rate Model – IEEE80211 ber This model originally calculated average bit error rate based on the SNR of the received signal. It has been changed so that the bit error rate is zero. Error Model – IEEE80211 error This model assigned the errors to packets based on the bit error rate calculated in IEEE80211 ber above. It has been changed to assign no bit errors. Error Correction Model – IEEE80211 ecc This model originally implemented the error correction function (if any) for the station. It was chosen to be the pipeline stage to implement the bursty and static error model since it is
Rusty O. Baldwin
Appendix A. Simulation Documentation
281
invoked only once per transmitted packet. The IEEE80211 ber and IEEE80211 error models may be invoked several times per packet depending on changes in the SNR or collisions that may occur. This model has been changed to include the error models described below. No error correction is performed. The bursty error model is a simple continuous-time 2-state model. In the “good” state, no errors are generated. In the “bad” state, errors occur with a fixed probability. The time that is spent in each state is exponentially distributed with a given mean. The means may be different for each state. The parameters used to set up the error model are discussed in Sections A.4.1.19, A.4.1.20, and A.4.1.25. The static error model simply assigns errors to transmitted packets based on an average BER. Every bit transmitted is subject to being in error (e.g., the model is always in a “bad” state). The parameters used to set up the model are discussed in Sections A.4.1.19, A.4.1.20, and A.4.1.25.
A.4.6.4
Antenna
The only value changed in the Antenna parameters is pattern. The value is IEEE80211 which implements a standard omnidirectional pattern.
A.5
Model Validation
The simulation model was validated by comparing the performance metrics obtained by the model against those obtained in [BFO96]. Because [BFO96] was based on an earlier draft of the IEEE 802.11 standard, several of that paper’s parameters did not match those in the latest IEEE 802.11 standard. For the validation, the values of these parameters in our model were changed to match [BFO96]. Figure A.30 shows throughput for 5, 10 and 20 station networks. Figure A.31 shows the average transmission attempts per packet for various values
Rusty O. Baldwin
Appendix A. Simulation Documentation
[BFO96] Model
0.8
282
N =5
Normalized Throughput (S)
N = 10 0.7 N = 20
0.6
0.5
0.5
0.6
0.7 0.8 0.9 Normalized Offered Load (G)
1
1.1
Figure A.30: Throughput versus Offered Load of the contention window, CWmin, and CWmax. Figure A.32 shows saturation throughput versus number of stations for various values of the contention window, CWmin, and CWmax. The agreement between the two models is quite good. In fact, the data obtained in the two uppermost plots in Figure A.31 were so close to [BFO96] that the simulation model data and their data virtually overlap. Average access delays for various values of the contention window are shown in Figure A.33.
A.6
Summary
This appendix describes the simulation model used in the course of this research. The appendix begins with a discussion of the simulation tool, OPNET, in Section A.1. Section A.2 presents on overview of the SDL specification language. In Section A.3 the simulation model is described. The node and process models are presented and the model behavior is described using SDL. Section A.4 discusses the simulation parameters which may be varied within the
Rusty O. Baldwin
Appendix A. Simulation Documentation
283
2.5 CWmin 32;CWmax 256
[BFO96] Model
Mean Attempts
2
CWmin 32;CWmax 1024 CWmin 128;CWmax 1024
1.5
1 10
20
30 Stations (N )
40
50
Saturation Throughput (S)
Figure A.31: Mean Attempts per Packet
0.8
CWmin 32;CWmax 256
0.7
CWmin 32;CWmax 1024
0.6 CWmin 128;CWmax 1024
[BFO96] Model 0.5 10
20
30 Stations (N )
Figure A.32: Saturation Throughput
40
50
Rusty O. Baldwin
[BFO96] Model
30
Access Delay (ms)
Appendix A. Simulation Documentation
20 CWmin 512;CWmax 4096
CWmin 128;CWmax 1024
10
CWmin 32;CWmax 256 0 0.2
0.3
0.4 0.5 Normalized Offered Load (G)
Figure A.33: Average Access Delay model. Validation of the model is discussed in Section A.5.
0.6
284
Appendix B Simulation Data Tables This appendix contains the data gathered during the simulations. Reporting the individual sample values would make this appendix even more voluminous, therefore, the mean values for the number of replications are given along with the associated confidence interval half width. For example, the confidence interval for a table entry of x(y) would be (x − y, x + y). The figure reference in the table caption in parenthesis (e.g., (Figure 6.99)) refers to the figure which used the data in the table. Since the number of samples, n, for each value is small, the confidence interval used for √ √ means, x, is (x − t[1−α/2;n−1]s/ n, x + t[1−α/2;n−1]s/ n) where t[1−α/2;n−1] is the (1 − α/2)quantile of a t-variate with n − 1 degrees of freedom and s is the standard deviation of the q
samples. The confidence interval used for ratios, p, is (p− z[1−α/2]
p(1−p) , p+z[1−α/2] n
q
p(1−p) ) n
where z[1−α/2] is the (1 − α/2)-quantile of a unit normal variate [Jai91]. Unless otherwise stated n = 5 and α = 0.10.
285
Rusty O. Baldwin
B.1
Appendix B. Simulation Data Tables
286
Telemetry Traffic Model Table B.1: Telemetry Throughput - Ideal Channel (Figure 6.1) Offered Load (G)
Stations - Protocol
0.3
0.5
0.7
0.9
5 Sta - 802.11
2.83E-01 (1.72E-03)
3.32E-01 (6.18E-04)
3.32E-01 (7.68E-04)
3.32E-01 (1.04E-03)
5 Sta - RT-MAC
2.85E-01 (1.84E-04)
3.33E-01 (5.21E-03)
2.99E-01 (7.43E-03)
3.02E-01 (1.18E-02)
10 Sta - 802.11
2.85E-01 (1.97E-05)
3.22E-01 (1.68E-03)
3.22E-01 (1.15E-03)
3.22E-01 (1.35E-03)
10 Sta - RT-MAC
2.85E-01 (2.26E-05)
3.13E-01 (4.67E-04)
3.00E-01 (8.02E-04)
2.96E-01 (1.26E-03)
20 Sta - 802.11
2.85E-01 (1.93E-05)
3.07E-01 (5.07E-04)
3.07E-01 (2.93E-04)
3.08E-01 (1.28E-03)
20 Sta - RT-MAC
2.85E-01 (7.37E-05)
3.16E-01 (8.83E-04)
3.08E-01 (4.12E-04)
3.00E-01 (6.53E-04)
30 Sta - 802.11
2.85E-01 (5.20E-05)
2.96E-01 (7.07E-04)
2.97E-01 (5.81E-04)
2.96E-01 (5.97E-04)
30 Sta - RT-MAC
2.85E-01 (3.33E-05)
3.37E-01 (4.90E-03)
3.28E-01 (3.35E-03)
3.19E-01 (2.84E-03)
40 Sta - 802.11
2.85E-01 (4.74E-05)
2.88E-01 (1.70E-03)
2.88E-01 (1.00E-03)
2.88E-01 (9.63E-04)
40 Sta - RT-MAC
2.85E-01 (5.76E-05)
3.38E-01 (2.36E-03)
3.28E-01 (4.15E-03)
3.21E-01 (4.26E-03)
50 Sta - 802.11
2.80E-01 (5.88E-03)
2.80E-01 (8.59E-04)
2.81E-01 (1.37E-03)
2.81E-01 (1.09E-03)
50 Sta - RT-MAC
2.85E-01 (6.58E-05)
3.39E-01 (2.70E-03)
3.29E-01 (2.97E-03)
3.23E-01 (3.12E-03)
Table B.2: Telemetry Throughput - Bursty Error Channel (Figure 6.2) Offered Load (G) Stations - Protocol
0.3
0.5
0.7
0.9
5 Sta - 802.11
2.85E-01 (5.58E-04)
3.30E-01 (3.66E-03)
3.29E-01 (5.80E-03)
3.30E-01 (2.11E-03)
5 Sta - RT-MAC
2.80E-01 (3.68E-03)
3.27E-01 (1.11E-02)
2.93E-01 (6.39E-03)
2.96E-01 (5.82E-03)
10 Sta - 802.11
2.84E-01 (3.98E-04)
3.19E-01 (2.87E-03)
3.19E-01 (1.79E-03)
3.20E-01 (1.28E-03)
10 Sta - RT-MAC
2.80E-01 (3.07E-03)
3.10E-01 (4.28E-03)
2.98E-01 (1.97E-03)
2.92E-01 (6.34E-03)
20 Sta - 802.11
2.84E-01 (4.80E-04)
3.02E-01 (3.52E-03)
3.04E-01 (3.53E-03)
3.05E-01 (4.90E-03)
20 Sta - RT-MAC
2.79E-01 (1.02E-02)
3.13E-01 (4.35E-03)
3.05E-01 (4.56E-03)
2.96E-01 (4.41E-03)
30 Sta - 802.11
2.85E-01 (2.74E-04)
2.94E-01 (2.70E-03)
2.94E-01 (2.07E-03)
2.94E-01 (2.86E-03)
30 Sta - RT-MAC
2.78E-01 (8.44E-03)
3.34E-01 (4.69E-03)
3.24E-01 (4.93E-03)
3.17E-01 (9.12E-03)
40 Sta - 802.11
2.85E-01 (1.74E-03)
2.85E-01 (3.66E-03)
2.84E-01 (4.38E-03)
2.85E-01 (1.08E-03)
40 Sta - RT-MAC
2.81E-01 (2.87E-03)
3.31E-01 (3.55E-03)
3.23E-01 (6.45E-03)
3.15E-01 (5.66E-03)
50 Sta - 802.11
2.84E-01 (1.12E-03)
2.78E-01 (3.41E-03)
2.78E-01 (3.01E-03)
2.77E-01 (2.86E-03)
50 Sta - RT-MAC
2.80E-01 (2.48E-03)
3.31E-01 (5.05E-03)
3.21E-01 (5.23E-03)
3.17E-01 (6.18E-03)
Rusty O. Baldwin
Appendix B. Simulation Data Tables
287
Table B.3: Telemetry Mean Delay - Ideal Channel (Figure 6.6) Offered Load (G) Stations - Protocol
0.3
0.5
0.7
0.9
5 Sta - 802.11
6.39E-03 (2.91E-05)
1.64E+00 (9.40E-03)
1.69E+00 (7.72E-03)
1.69E+00 (9.76E-03)
5 Sta - RT-MAC
4.61E-03 (1.83E-05)
3.76E-03 (8.71E-06)
2.73E-03 (4.67E-06)
2.27E-03 (6.29E-06)
10 Sta - 802.11
1.05E-02 (6.27E-05)
3.15E+00 (5.46E-02)
3.49E+00 (2.51E-02)
3.54E+00 (2.11E-02)
10 Sta - RT-MAC
8.85E-03 (2.49E-05)
7.03E-03 (1.44E-05)
5.00E-03 (1.43E-05)
4.05E-03 (1.32E-05)
20 Sta - 802.11
1.99E-02 (1.11E-04)
5.76E+00 (8.19E-02)
6.85E+00 (3.61E-02)
7.11E+00 (4.46E-02)
20 Sta - RT-MAC
1.74E-02 (7.65E-05)
1.37E-02 (3.56E-05)
1.00E-02 (4.24E-05)
7.82E-03 (2.42E-05)
30 Sta - 802.11
3.07E-02 (3.30E-05)
7.92E+00 (1.21E-01)
9.85E+00 (3.06E-02)
1.04E+01 (6.71E-02)
30 Sta - RT-MAC
2.59E-02 (6.23E-05)
2.04E-02 (6.35E-05)
1.48E-02 (3.30E-05)
1.17E-02 (2.92E-05)
40 Sta - 802.11
4.37E-02 (7.13E-04)
9.68E+00 (2.62E-01)
1.26E+01 (1.71E-01)
1.35E+01 (5.60E-02)
40 Sta - RT-MAC
3.44E-02 (1.09E-04)
2.71E-02 (4.84E-05)
1.97E-02 (3.98E-05)
1.55E-02 (2.04E-05)
50 Sta - 802.11
7.93E-02 (1.50E-02)
1.13E+01 (1.21E-01)
1.50E+01 (1.72E-01)
1.63E+01 (1.10E-01)
50 Sta - RT-MAC
4.29E-02 (9.96E-05)
3.38E-02 (7.29E-05)
2.46E-02 (4.99E-05)
1.93E-02 (4.70E-05)
Table B.4: Telemetry Mean Delay - Bursty Error Channel (Figure 6.7) Offered Load (G) Stations - Protocol
0.3
0.5
0.7
0.9
5 Sta - 802.11
1.52E-02 (1.19E-02)
1.67E+00 (5.28E-02)
1.71E+00 (5.02E-02)
1.71E+00 (3.25E-02)
5 Sta - RT-MAC
4.61E-03 (5.76E-06)
3.76E-03 (1.07E-05)
2.73E-03 (3.81E-06)
2.27E-03 (9.37E-06)
10 Sta - 802.11
2.13E-02 (9.64E-03)
3.22E+00 (9.86E-02)
3.55E+00 (3.50E-02)
3.58E+00 (2.71E-02)
10 Sta - RT-MAC
8.88E-03 (1.97E-05)
7.03E-03 (1.77E-05)
5.00E-03 (7.01E-06)
4.06E-03 (4.10E-06)
20 Sta - 802.11
3.14E-02 (1.15E-02)
6.13E+00 (2.58E-01)
7.02E+00 (1.83E-01)
7.25E+00 (2.20E-01)
20 Sta - RT-MAC
1.74E-02 (8.94E-05)
1.37E-02 (1.31E-05)
1.00E-02 (4.33E-05)
7.82E-03 (1.45E-05)
30 Sta - 802.11
4.70E-02 (1.11E-02)
8.27E+00 (3.97E-01)
1.01E+01 (1.44E-01)
1.06E+01 (2.04E-01)
30 Sta - RT-MAC
2.60E-02 (4.59E-05)
2.04E-02 (4.42E-05)
1.48E-02 (3.63E-05)
1.17E-02 (2.99E-05)
40 Sta - 802.11
6.11E-02 (1.45E-02)
1.03E+01 (8.03E-01)
1.32E+01 (5.58E-01)
1.39E+01 (1.34E-01)
40 Sta - RT-MAC
3.46E-02 (2.39E-04)
2.71E-02 (4.39E-05)
1.97E-02 (2.38E-05)
1.55E-02 (2.49E-05)
50 Sta - 802.11
1.39E-01 (9.96E-02)
1.20E+01 (9.73E-01)
1.56E+01 (4.69E-01)
1.70E+01 (3.68E-01)
50 Sta - RT-MAC
4.31E-02 (1.08E-04)
3.38E-02 (6.25E-05)
2.46E-02 (4.23E-05)
1.94E-02 (4.38E-05)
Rusty O. Baldwin
Appendix B. Simulation Data Tables
288
Table B.5: Telemetry Missed Deadline Ratio - Ideal Channel (Figure 6.8) Offered Load (G) Stations - Protocol
0.3
0.5
0.7
0.9
5 Sta - 802.11
3.43E-02 (6.92E-04)
1.00E+00 (0.00E+00)
1.00E+00 (0.00E+00)
1.00E+00 (0.00E+00)
5 Sta - RT-MAC
1.16E-03 (1.21E-04)
2.68E-01 (1.67E-03)
5.23E-01 (1.73E-03)
6.18E-01 (1.61E-03)
10 Sta - 802.11
4.76E-03 (2.44E-04)
1.00E+00 (0.00E+00)
1.00E+00 (0.00E+00)
1.00E+00 (0.00E+00)
10 Sta - RT-MAC
4.80E-04 (7.78E-05)
2.56E-01 (2.26E-03)
4.98E-01 (2.09E-03)
6.15E-01 (1.80E-03)
20 Sta - 802.11
1.49E-03 (1.37E-04)
1.00E+00 (6.92E-05)
1.00E+00 (0.00E+00)
1.00E+00 (0.00E+00)
20 Sta - RT-MAC
3.08E-04 (6.23E-05)
2.49E-01 (2.26E-03)
4.80E-01 (2.16E-03)
6.10E-01 (1.81E-03)
30 Sta - 802.11
1.92E-03 (1.56E-04)
1.00E+00 (8.60E-05)
1.00E+00 (0.00E+00)
1.00E+00 (0.00E+00)
30 Sta - RT-MAC
2.56E-04 (5.68E-05)
2.47E-01 (1.76E-03)
4.79E-01 (1.70E-03)
6.07E-01 (1.44E-03)
40 Sta - 802.11
7.18E-03 (3.00E-04)
9.99E-01 (1.46E-04)
1.00E+00 (1.81E-05)
1.00E+00 (0.00E+00)
40 Sta - RT-MAC
1.72E-04 (4.66E-05)
2.45E-01 (1.76E-03)
4.77E-01 (1.72E-03)
6.05E-01 (1.44E-03)
50 Sta - 802.11
9.41E-02 (1.21E-03)
9.99E-01 (1.14E-04)
1.00E+00 (0.00E+00)
1.00E+00 (0.00E+00)
50 Sta - RT-MAC
1.16E-04 (3.83E-05)
2.44E-01 (1.75E-03)
4.76E-01 (1.71E-03)
6.04E-01 (1.41E-03)
Table B.6: Telemetry Missed Deadline Ratio - Bursty Error Channel (Figure 6.9) Offered Load (G) Stations - Protocol
0.3
0.5
0.7
0.9
5 Sta - 802.11
1.03E-01 (1.08E-03)
1.00E+00 (0.00E+00)
1.00E+00 (0.00E+00)
1.00E+00 (0.00E+00)
5 Sta - RT-MAC
1.86E-02 (4.80E-04)
2.82E-01 (1.68E-03)
5.29E-01 (1.80E-03)
6.25E-01 (1.61E-03)
10 Sta - 802.11
6.62E-02 (8.84E-04)
1.00E+00 (0.00E+00)
1.00E+00 (0.00E+00)
1.00E+00 (0.00E+00)
10 Sta - RT-MAC
1.67E-02 (4.55E-04)
2.73E-01 (2.22E-03)
5.05E-01 (2.04E-03)
6.25E-01 (1.71E-03)
20 Sta - 802.11
5.39E-02 (8.03E-04)
1.00E+00 (6.30E-05)
1.00E+00 (0.00E+00)
1.00E+00 (0.00E+00)
20 Sta - RT-MAC
1.82E-02 (4.89E-04)
2.62E-01 (2.23E-03)
4.90E-01 (2.09E-03)
6.20E-01 (1.71E-03)
30 Sta - 802.11
6.15E-02 (8.54E-04)
9.99E-01 (1.17E-04)
1.00E+00 (0.00E+00)
1.00E+00 (0.00E+00)
30 Sta - RT-MAC
2.09E-02 (5.21E-04)
2.58E-01 (1.76E-03)
4.87E-01 (1.68E-03)
6.12E-01 (1.39E-03)
40 Sta - 802.11
6.46E-02 (8.76E-04)
9.99E-01 (9.51E-05)
1.00E+00 (0.00E+00)
1.00E+00 (0.00E+00)
40 Sta - RT-MAC
1.44E-02 (4.23E-04)
2.61E-01 (1.80E-03)
4.86E-01 (1.71E-03)
6.12E-01 (1.42E-03)
50 Sta - 802.11
2.21E-01 (1.47E-03)
9.99E-01 (1.10E-04)
1.00E+00 (0.00E+00)
1.00E+00 (0.00E+00)
50 Sta - RT-MAC
1.67E-02 (4.55E-04)
2.58E-01 (1.81E-03)
4.87E-01 (1.73E-03)
6.11E-01 (1.41E-03)
Table B.7: Telemetry Missed Deadline Ratio (2-4 Stations) - Ideal Channel (Figure 6.11) Offered Load - G = 0.3 Stations - Protocol
n=2
2 Sta - 802.11
1.97E-01 (2.23E-03)
2 Sta - RT-MAC
2.58E-02 (9.11E-04)
4 Sta - 802.11
4.26E-02 (1.41E-03)
4 Sta - RT-MAC
1.23E-03 (1.97E-04)
Rusty O. Baldwin
Appendix B. Simulation Data Tables
289
Table B.8: Telemetry Collision Ratio - Ideal Channel (Figure 6.12) Offered Load (G) Stations - Protocol
0.3
0.5
0.7
0.9
5 Sta - 802.11
2.74E-02 (6.12E-04)
7.93E-02 (1.51E-03)
7.87E-02 (1.51E-03)
7.96E-02 (1.52E-03)
5 Sta - RT-MAC
1.50E-02 (4.28E-04)
1.87E-02 (5.91E-04)
2.13E-02 (7.14E-04)
2.28E-02 (7.92E-04)
10 Sta - 802.11
6.87E-02 (8.67E-04)
1.61E-01 (1.88E-03)
1.61E-01 (1.88E-03)
1.60E-01 (1.88E-03)
10 Sta - RT-MAC
2.49E-02 (5.47E-04)
2.89E-02 (9.92E-04)
3.19E-02 (1.02E-03)
3.12E-02 (1.02E-03)
20 Sta - 802.11
1.48E-01 (1.16E-03)
2.58E-01 (1.98E-03)
2.58E-01 (1.99E-03)
2.56E-01 (1.99E-03)
20 Sta - RT-MAC
3.32E-02 (6.26E-04)
3.58E-02 (1.10E-03)
3.63E-02 (1.10E-03)
3.77E-02 (1.11E-03)
30 Sta - 802.11
2.23E-01 (1.30E-03)
3.26E-01 (1.94E-03)
3.23E-01 (1.95E-03)
3.24E-01 (1.95E-03)
30 Sta - RT-MAC
3.73E-02 (6.60E-04)
4.05E-02 (9.06E-04)
4.11E-02 (9.18E-04)
4.10E-02 (9.16E-04)
40 Sta - 802.11
2.88E-01 (1.36E-03)
3.67E-01 (1.88E-03)
3.68E-01 (1.88E-03)
3.66E-01 (1.88E-03)
40 Sta - RT-MAC
3.84E-02 (6.69E-04)
4.08E-02 (9.11E-04)
4.15E-02 (9.28E-04)
4.04E-02 (9.02E-04)
50 Sta - 802.11
3.88E-01 (1.58E-03)
3.98E-01 (1.81E-03)
3.96E-01 (1.81E-03)
3.97E-01 (1.81E-03)
50 Sta - RT-MAC
3.94E-02 (6.77E-04)
4.05E-02 (9.04E-04)
4.13E-02 (9.24E-04)
3.89E-02 (8.70E-04)
Table B.9: Telemetry Collision Ratio - Bursty Error Channel (Figure 6.13) Offered Load (G) Stations - Protocol
0.3
0.5
0.7
0.9
5 Sta - 802.11
3.13E-02 (6.03E-04)
7.97E-02 (1.49E-03)
7.89E-02 (1.48E-03)
7.79E-02 (1.47E-03)
5 Sta - RT-MAC
1.49E-02 (4.26E-04)
1.86E-02 (5.86E-04)
2.22E-02 (7.60E-04)
2.29E-02 (7.96E-04)
10 Sta - 802.11
7.31E-02 (8.79E-04)
1.57E-01 (1.80E-03)
1.57E-01 (1.80E-03)
1.58E-01 (1.82E-03)
10 Sta - RT-MAC
2.59E-02 (5.56E-04)
2.86E-02 (9.50E-04)
3.21E-02 (9.98E-04)
3.07E-02 (9.68E-04)
20 Sta - 802.11
1.54E-01 (1.16E-03)
2.52E-01 (1.88E-03)
2.53E-01 (1.91E-03)
2.53E-01 (1.91E-03)
20 Sta - RT-MAC
3.36E-02 (6.45E-04)
3.57E-02 (1.06E-03)
3.78E-02 (1.08E-03)
3.81E-02 (1.06E-03)
30 Sta - 802.11
2.30E-01 (1.29E-03)
3.17E-01 (1.89E-03)
3.20E-01 (1.89E-03)
3.20E-01 (1.89E-03)
30 Sta - RT-MAC
3.76E-02 (6.77E-04)
3.95E-02 (8.83E-04)
3.99E-02 (8.92E-04)
3.83E-02 (8.56E-04)
40 Sta - 802.11
3.01E-01 (1.35E-03)
3.60E-01 (1.82E-03)
3.60E-01 (1.79E-03)
3.62E-01 (1.81E-03)
40 Sta - RT-MAC
3.90E-02 (6.72E-04)
4.10E-02 (9.16E-04)
4.10E-02 (9.16E-04)
3.98E-02 (8.90E-04)
50 Sta - 802.11
3.87E-01 (1.34E-03)
3.95E-01 (1.76E-03)
3.95E-01 (1.76E-03)
3.89E-01 (1.73E-03)
50 Sta - RT-MAC
3.93E-02 (6.73E-04)
4.16E-02 (9.30E-04)
4.20E-02 (9.38E-04)
3.90E-02 (8.71E-04)
Rusty O. Baldwin
B.2
Appendix B. Simulation Data Tables
290
Avionics Traffic Model Table B.10: Avionics Throughput - Ideal Channel (Figure 6.14) Offered Load (G)
Stations - Protocol
0.3
0.5
0.7
0.9
5 Sta - 802.11
2.99E-01 (3.83E-03)
4.97E-01 (3.74E-03)
6.97E-01 (5.24E-03)
7.53E-01 (4.47E-03)
5 Sta - RT-MAC
2.99E-01 (4.68E-03)
4.97E-01 (4.79E-03)
6.95E-01 (3.76E-03)
8.25E-01 (3.03E-03)
10 Sta - 802.11
2.98E-01 (1.50E-03)
4.97E-01 (3.54E-03)
6.96E-01 (1.99E-03)
7.06E-01 (6.70E-03)
10 Sta - RT-MAC
2.98E-01 (2.48E-03)
4.97E-01 (4.92E-03)
6.94E-01 (2.89E-03)
8.18E-01 (1.44E-03)
20 Sta - 802.11
2.98E-01 (2.72E-03)
4.96E-01 (3.95E-03)
6.96E-01 (4.43E-03)
6.57E-01 (5.25E-03)
20 Sta - RT-MAC
2.98E-01 (1.63E-03)
4.97E-01 (5.30E-03)
6.93E-01 (2.13E-03)
8.14E-01 (3.55E-03)
30 Sta - 802.11
2.99E-01 (4.32E-03)
4.97E-01 (4.11E-03)
6.70E-01 (3.59E-02)
6.26E-01 (3.69E-03)
30 Sta - RT-MAC
2.98E-01 (3.04E-03)
4.97E-01 (6.21E-03)
6.94E-01 (6.88E-03)
8.09E-01 (4.48E-03)
40 Sta - 802.11
2.98E-01 (3.44E-03)
4.97E-01 (4.13E-03)
6.42E-01 (2.08E-02)
6.02E-01 (1.56E-03)
40 Sta - RT-MAC
2.98E-01 (3.79E-03)
4.96E-01 (6.57E-03)
6.92E-01 (4.15E-03)
8.08E-01 (9.54E-04)
50 Sta - 802.11
2.98E-01 (2.59E-03)
4.97E-01 (1.42E-03)
6.08E-01 (1.50E-02)
5.83E-01 (1.58E-03)
50 Sta - RT-MAC
2.98E-01 (2.97E-03)
4.97E-01 (5.33E-03)
6.94E-01 (6.45E-03)
8.07E-01 (2.14E-03)
Table B.11: Avionics Throughput - Bursty Error Channel (Figure 6.15) Offered Load (G) Stations - Protocol
0.3
0.5
0.7
0.9
5 Sta - 802.11
2.98E-01 (3.06E-03)
4.97E-01 (2.84E-03)
6.95E-01 (2.62E-03)
7.44E-01 (1.12E-02)
5 Sta - RT-MAC
2.98E-01 (3.35E-03)
4.95E-01 (4.58E-03)
6.90E-01 (5.30E-03)
8.08E-01 (3.07E-03)
10 Sta - 802.11
2.99E-01 (1.99E-03)
4.98E-01 (6.30E-03)
6.95E-01 (4.81E-03)
6.96E-01 (1.02E-02)
10 Sta - RT-MAC
2.97E-01 (2.48E-03)
4.95E-01 (3.35E-03)
6.87E-01 (4.82E-03)
8.02E-01 (1.11E-02)
20 Sta - 802.11
2.97E-01 (3.51E-03)
4.98E-01 (3.80E-03)
6.96E-01 (7.64E-03)
6.49E-01 (5.82E-03)
20 Sta - RT-MAC
2.97E-01 (2.73E-03)
4.96E-01 (3.00E-03)
6.89E-01 (2.43E-03)
7.97E-01 (8.88E-03)
30 Sta - 802.11
2.98E-01 (3.73E-03)
4.96E-01 (4.06E-03)
6.48E-01 (1.72E-02)
6.20E-01 (4.43E-03)
30 Sta - RT-MAC
2.98E-01 (2.35E-03)
4.96E-01 (2.29E-03)
6.89E-01 (6.69E-03)
7.94E-01 (6.50E-03)
40 Sta - 802.11
2.99E-01 (2.42E-03)
4.98E-01 (5.38E-03)
6.19E-01 (1.05E-02)
5.98E-01 (3.12E-03)
40 Sta - RT-MAC
2.98E-01 (3.43E-03)
4.95E-01 (4.00E-03)
6.90E-01 (6.44E-03)
7.93E-01 (7.31E-03)
50 Sta - 802.11
2.98E-01 (3.79E-03)
4.97E-01 (2.56E-03)
5.90E-01 (9.19E-03)
5.73E-01 (4.21E-03)
50 Sta - RT-MAC
2.98E-01 (1.79E-03)
4.96E-01 (4.32E-03)
6.88E-01 (3.41E-03)
7.92E-01 (5.05E-03)
Rusty O. Baldwin
Appendix B. Simulation Data Tables
291
Table B.12: Avionics Mean Delay - Ideal Channel (Figure 6.19) Offered Load (G) Stations - Protocol
0.3
0.5
0.7
0.9
5 Sta - 802.11
8.63E-03 (4.65E-05)
1.20E-02 (1.40E-04)
2.97E-02 (2.66E-03)
4.81E+00 (7.77E-01)
5 Sta - RT-MAC
9.14E-03 (2.91E-05)
1.25E-02 (1.40E-04)
2.51E-02 (7.27E-04)
1.25E-01 (5.28E-03)
10 Sta - 802.11
8.63E-03 (4.87E-05)
1.21E-02 (1.45E-04)
3.37E-02 (2.87E-03)
8.40E+00 (4.44E-01)
10 Sta - RT-MAC
9.77E-03 (3.88E-05)
1.35E-02 (8.65E-05)
2.66E-02 (1.04E-03)
1.19E-01 (5.04E-03)
20 Sta - 802.11
8.64E-03 (3.20E-05)
1.21E-02 (2.90E-04)
4.89E-02 (1.72E-02)
1.48E+01 (8.91E-01)
20 Sta - RT-MAC
1.10E-02 (5.84E-05)
1.54E-02 (2.88E-04)
3.07E-02 (4.41E-04)
1.21E-01 (3.28E-03)
30 Sta - 802.11
8.66E-03 (8.47E-05)
1.22E-02 (2.07E-04)
6.19E+00 (8.00E+00)
2.09E+01 (1.46E+00)
30 Sta - RT-MAC
1.22E-02 (5.35E-05)
1.73E-02 (2.78E-04)
3.51E-02 (1.15E-03)
1.23E-01 (8.27E-03)
40 Sta - 802.11
8.67E-03 (8.22E-05)
1.23E-02 (1.81E-04)
1.08E+01 (1.92E+00)
2.71E+01 (1.22E+00)
40 Sta - RT-MAC
1.35E-02 (1.01E-04)
1.93E-02 (5.19E-04)
3.89E-02 (1.13E-03)
1.24E-01 (3.13E-03)
50 Sta - 802.11
8.64E-03 (7.14E-05)
1.25E-02 (1.59E-04)
1.47E+01 (1.87E+00)
3.25E+01 (9.70E-01)
50 Sta - RT-MAC
1.47E-02 (7.57E-05)
2.11E-02 (2.95E-04)
4.30E-02 (1.43E-03)
1.29E-01 (7.34E-03)
Table B.13: Avionics Mean Delay - Bursty Error Channel (Figure 6.20) Offered Load (G) Stations - Protocol
0.3
0.5
0.7
0.9
5 Sta - 802.11
1.13E-02 (1.33E-03)
1.72E-02 (1.03E-03)
4.66E-02 (6.75E-03)
5.35E+00 (5.66E-01)
5 Sta - RT-MAC
1.15E-02 (2.84E-04)
1.59E-02 (8.27E-04)
3.13E-02 (2.02E-03)
1.33E-01 (8.58E-03)
10 Sta - 802.11
1.16E-02 (1.09E-03)
1.67E-02 (2.16E-03)
5.84E-02 (8.87E-03)
9.10E+00 (8.58E-01)
10 Sta - RT-MAC
1.23E-02 (6.60E-04)
1.71E-02 (5.10E-04)
3.18E-02 (1.10E-03)
1.27E-01 (8.36E-03)
20 Sta - 802.11
1.19E-02 (8.13E-04)
1.86E-02 (2.31E-03)
5.02E-01 (1.72E+00)
1.66E+01 (1.56E+00)
20 Sta - RT-MAC
1.35E-02 (6.95E-04)
1.86E-02 (4.15E-04)
3.73E-02 (2.40E-03)
1.24E-01 (4.21E-03)
30 Sta - 802.11
1.15E-02 (8.43E-04)
1.91E-02 (2.92E-03)
9.15E+00 (3.48E+00)
2.28E+01 (2.48E+00)
30 Sta - RT-MAC
1.48E-02 (6.19E-04)
2.08E-02 (1.12E-03)
4.11E-02 (7.93E-04)
1.30E-01 (9.26E-03)
40 Sta - 802.11
1.23E-02 (5.97E-04)
1.90E-02 (3.28E-03)
1.37E+01 (7.43E-01)
2.90E+01 (1.62E+00)
40 Sta - RT-MAC
1.62E-02 (5.18E-04)
2.24E-02 (5.35E-04)
4.44E-02 (9.57E-04)
1.31E-01 (4.23E-03)
50 Sta - 802.11
1.16E-02 (1.02E-03)
1.78E-02 (2.84E-03)
1.66E+01 (2.81E+00)
3.67E+01 (2.79E+00)
50 Sta - RT-MAC
1.73E-02 (5.27E-04)
2.44E-02 (8.36E-04)
4.93E-02 (1.62E-03)
1.32E-01 (8.51E-03)
Rusty O. Baldwin
Appendix B. Simulation Data Tables
292
Table B.14: Avionics Missed Deadline Ratio - Ideal Channel (Figure 6.23) Offered Load (G) Stations - Protocol
0.3
0.5
0.7
0.9
5 Sta - 802.11
8.30E-05 (3.05E-05)
3.74E-04 (5.03E-05)
6.19E-03 (1.72E-04)
9.87E-01 (7.69E-04)
5 Sta - RT-MAC
7.47E-05 (2.89E-05)
3.76E-04 (5.04E-05)
3.05E-03 (1.21E-04)
7.69E-02 (7.91E-04)
10 Sta - 802.11
8.73E-05 (3.13E-05)
4.36E-04 (5.43E-05)
1.05E-02 (2.36E-04)
9.73E-01 (1.11E-03)
10 Sta - RT-MAC
9.57E-05 (3.28E-05)
4.51E-04 (5.52E-05)
3.37E-03 (1.27E-04)
8.50E-02 (9.79E-04)
20 Sta - 802.11
7.49E-05 (2.90E-05)
4.77E-04 (5.68E-05)
2.50E-02 (3.43E-04)
9.77E-01 (9.29E-04)
20 Sta - RT-MAC
1.37E-04 (3.93E-05)
6.88E-04 (6.81E-05)
4.51E-03 (1.47E-04)
9.84E-02 (1.07E-03)
30 Sta - 802.11
8.31E-05 (3.06E-05)
4.81E-04 (5.70E-05)
4.19E-01 (1.33E-03)
9.73E-01 (9.32E-04)
30 Sta - RT-MAC
2.66E-04 (5.47E-05)
9.27E-04 (7.90E-05)
6.17E-03 (1.72E-04)
1.08E-01 (1.13E-03)
40 Sta - 802.11
6.23E-05 (2.65E-05)
5.34E-04 (6.00E-05)
5.93E-01 (1.53E-03)
9.78E-01 (8.09E-04)
40 Sta - RT-MAC
3.74E-04 (6.48E-05)
1.13E-03 (8.74E-05)
7.33E-03 (1.87E-04)
1.10E-01 (1.09E-03)
50 Sta - 802.11
1.12E-04 (3.56E-05)
6.01E-04 (6.37E-05)
7.61E-01 (1.67E-03)
9.82E-01 (7.08E-04)
50 Sta - RT-MAC
4.95E-04 (7.46E-05)
1.47E-03 (9.93E-05)
8.72E-03 (2.03E-04)
1.20E-01 (1.06E-03)
Table B.15: Avionics Missed Deadline Ratio - Bursty Error Channel (Figure 6.24) Offered Load (G) Stations - Protocol
0.3
0.5
0.7
0.9
5 Sta - 802.11
1.71E-03 (1.39E-04)
4.53E-03 (1.74E-04)
2.43E-02 (3.47E-04)
9.85E-01 (7.93E-04)
5 Sta - RT-MAC
2.02E-03 (1.51E-04)
3.98E-03 (1.64E-04)
1.12E-02 (2.30E-04)
9.85E-02 (8.90E-04)
10 Sta - 802.11
2.19E-03 (1.57E-04)
4.48E-03 (1.73E-04)
3.59E-02 (4.09E-04)
9.76E-01 (1.03E-03)
10 Sta - RT-MAC
2.87E-03 (1.80E-04)
5.24E-03 (1.87E-04)
1.12E-02 (2.38E-04)
1.05E-01 (1.08E-03)
20 Sta - 802.11
2.75E-03 (1.76E-04)
6.33E-03 (2.06E-04)
1.52E-01 (8.20E-04)
9.81E-01 (8.10E-04)
20 Sta - RT-MAC
3.45E-03 (1.97E-04)
4.56E-03 (1.75E-04)
1.41E-02 (2.81E-04)
1.13E-01 (1.14E-03)
30 Sta - 802.11
2.22E-03 (1.58E-04)
7.00E-03 (2.17E-04)
6.83E-01 (1.57E-03)
9.72E-01 (9.16E-04)
30 Sta - RT-MAC
3.39E-03 (1.95E-04)
5.95E-03 (1.99E-04)
1.58E-02 (2.91E-04)
1.28E-01 (1.21E-03)
40 Sta - 802.11
3.14E-03 (1.88E-04)
6.91E-03 (2.15E-04)
7.84E-01 (1.59E-03)
9.82E-01 (7.06E-04)
40 Sta - RT-MAC
4.09E-03 (2.14E-04)
5.73E-03 (1.96E-04)
1.66E-02 (2.90E-04)
1.34E-01 (1.19E-03)
50 Sta - 802.11
2.31E-03 (1.61E-04)
5.53E-03 (1.93E-04)
8.63E-01 (1.50E-03)
9.83E-01 (6.34E-04)
50 Sta - RT-MAC
4.02E-03 (2.12E-04)
6.74E-03 (2.12E-04)
1.95E-02 (3.06E-04)
1.38E-01 (1.13E-03)
Rusty O. Baldwin
Appendix B. Simulation Data Tables
293
Table B.16: Avionics Collision Ratio - Ideal Channel (Figure 6.27) Offered Load (G) Stations - Protocol
0.3
0.5
0.7
0.9
5 Sta - 802.11
2.14E-03 (1.55E-04)
7.87E-03 (2.29E-04)
2.67E-02 (3.49E-04)
7.96E-02 (1.78E-03)
5 Sta - RT-MAC
8.62E-04 (9.83E-05)
2.75E-03 (1.36E-04)
7.78E-03 (1.92E-04)
1.84E-02 (4.11E-04)
10 Sta - 802.11
2.90E-03 (1.80E-04)
1.12E-02 (2.72E-04)
4.49E-02 (4.70E-04)
1.60E-01 (2.34E-03)
10 Sta - RT-MAC
1.20E-03 (1.16E-04)
3.66E-03 (1.57E-04)
9.82E-03 (2.16E-04)
2.56E-02 (5.72E-04)
20 Sta - 802.11
3.51E-03 (1.98E-04)
1.36E-02 (2.99E-04)
7.11E-02 (5.44E-04)
2.58E-01 (2.40E-03)
20 Sta - RT-MAC
1.05E-03 (1.08E-04)
3.58E-03 (1.55E-04)
9.74E-03 (2.15E-04)
2.71E-02 (6.05E-04)
30 Sta - 802.11
3.75E-03 (2.04E-04)
1.57E-02 (3.20E-04)
2.11E-01 (9.74E-04)
3.24E-01 (2.30E-03)
30 Sta - RT-MAC
1.30E-03 (1.21E-04)
3.48E-03 (1.53E-04)
9.75E-03 (2.15E-04)
2.81E-02 (6.27E-04)
40 Sta - 802.11
4.17E-03 (2.16E-04)
1.63E-02 (3.27E-04)
2.88E-01 (1.19E-03)
3.67E-01 (2.16E-03)
40 Sta - RT-MAC
1.15E-03 (1.13E-04)
3.37E-03 (1.51E-04)
9.45E-03 (2.12E-04)
2.58E-02 (5.76E-04)
50 Sta - 802.11
3.88E-03 (2.08E-04)
1.75E-02 (3.38E-04)
3.57E-01 (1.51E-03)
3.97E-01 (2.04E-03)
50 Sta - RT-MAC
1.19E-03 (1.16E-04)
3.20E-03 (1.47E-04)
8.68E-03 (2.03E-04)
2.29E-02 (5.11E-04)
Table B.17: Avionics Collision Ratio - Bursty Error Channel (Figure 6.28) Offered Load (G) Stations - Protocol
0.3
0.5
0.7
0.9
5 Sta - 802.11
2.51E-03 (1.64E-04)
8.43E-03 (2.33E-04)
2.88E-02 (3.67E-04)
7.77E-02 (1.74E-03)
5 Sta - RT-MAC
1.21E-03 (1.14E-04)
3.30E-03 (1.47E-04)
8.22E-03 (1.96E-04)
1.87E-02 (4.18E-04)
10 Sta - 802.11
3.54E-03 (1.94E-04)
1.32E-02 (2.90E-04)
5.28E-02 (4.73E-04)
1.55E-01 (2.29E-03)
10 Sta - RT-MAC
1.54E-03 (1.29E-04)
4.23E-03 (1.66E-04)
1.03E-02 (2.26E-04)
2.56E-02 (5.71E-04)
20 Sta - 802.11
4.78E-03 (2.26E-04)
1.81E-02 (3.37E-04)
1.16E-01 (6.81E-04)
2.49E-01 (2.29E-03)
20 Sta - RT-MAC
1.70E-03 (1.36E-04)
4.04E-03 (1.62E-04)
1.10E-02 (2.46E-04)
2.71E-02 (6.07E-04)
30 Sta - 802.11
5.48E-03 (2.42E-04)
2.10E-02 (3.63E-04)
2.70E-01 (1.27E-03)
3.19E-01 (2.21E-03)
30 Sta - RT-MAC
1.38E-03 (1.22E-04)
4.26E-03 (1.66E-04)
1.06E-02 (2.36E-04)
2.79E-02 (6.23E-04)
40 Sta - 802.11
6.60E-03 (2.64E-04)
2.34E-02 (3.82E-04)
3.29E-01 (1.47E-03)
3.59E-01 (2.10E-03)
40 Sta - RT-MAC
1.38E-03 (1.22E-04)
3.51E-03 (1.52E-04)
1.01E-02 (2.25E-04)
2.62E-02 (5.86E-04)
50 Sta - 802.11
6.50E-03 (2.63E-04)
2.25E-02 (3.76E-04)
3.73E-01 (1.65E-03)
3.92E-01 (1.94E-03)
50 Sta - RT-MAC
1.37E-03 (1.22E-04)
3.68E-03 (1.55E-04)
9.40E-03 (2.12E-04)
2.33E-02 (5.22E-04)
Rusty O. Baldwin
B.3
Appendix B. Simulation Data Tables
294
Voice with Non Real-time Traffic Model
B.3.1
1 Mbps Data Rate Table B.18: Voice Throughput - Ideal Channel (1 Mbps) (Figure 6.29)
Stations - Protocol 4 Sta - 802.11
Offered Data Load (GNRT ) 0.4
0.0
0.2
0.6
0.8
5.45E-02 (2.88E-03)
2.53E-01 (8.58E-03)
4.52E-01 (1.03E-02)
6.48E-01 (1.60E-02)
6.54E-01 (6.30E-03)
4 Sta - RT-MAC
5.41E-02 (2.39E-03)
2.54E-01 (1.11E-02)
4.45E-01 (1.63E-02)
6.32E-01 (1.67E-02)
6.81E-01 (3.73E-03)
10 Sta - 802.11
1.34E-01 (4.75E-03)
3.33E-01 (7.68E-03)
5.29E-01 (4.61E-03)
5.16E-01 (3.00E-03)
5.15E-01 (7.19E-03)
10 Sta - RT-MAC
1.34E-01 (3.83E-03)
3.31E-01 (8.44E-03)
5.20E-01 (1.06E-02)
6.43E-01 (7.09E-03)
6.41E-01 (2.26E-02)
14 Sta - 802.11
1.89E-01 (8.02E-03)
3.92E-01 (7.58E-03)
4.55E-01 (6.77E-03)
4.50E-01 (7.19E-03)
4.54E-01 (6.26E-03)
14 Sta - RT-MAC
1.90E-01 (7.06E-03)
3.82E-01 (5.32E-03)
5.43E-01 (6.79E-03)
6.40E-01 (1.18E-02)
6.46E-01 (6.15E-03)
20 Sta - 802.11
2.61E-01 (8.99E-03)
3.76E-01 (9.48E-03)
3.73E-01 (1.88E-02)
3.71E-01 (9.54E-03)
3.75E-01 (1.09E-02)
20 Sta - RT-MAC
2.66E-01 (1.43E-02)
4.33E-01 (7.97E-03)
5.40E-01 (4.90E-03)
6.38E-01 (8.32E-03)
6.57E-01 (3.43E-03)
24 Sta - 802.11
3.20E-01 (3.63E-03)
3.32E-01 (1.45E-02)
3.31E-01 (1.27E-02)
3.28E-01 (1.85E-02)
3.27E-01 (1.64E-02)
24 Sta - RT-MAC
2.97E-01 (9.38E-03)
4.36E-01 (1.93E-03)
5.36E-01 (7.25E-03)
6.37E-01 (4.04E-03)
6.64E-01 (3.86E-03)
30 Sta - 802.11
2.95E-01 (9.46E-03)
3.04E-01 (3.46E-03)
3.05E-01 (5.28E-03)
3.06E-01 (7.00E-03)
3.05E-01 (7.20E-03)
30 Sta - RT-MAC
3.10E-01 (3.82E-03)
4.30E-01 (3.69E-03)
5.32E-01 (5.26E-03)
6.38E-01 (2.11E-03)
6.65E-01 (3.56E-03)
Table B.19: Voice Throughput - Bursty Error Channel (1 Mbps) (Figure 6.30) Offered Data Load (GNRT ) Stations - Protocol 4 Sta - 802.11
0.0
0.2
0.4
0.6
0.8
5.37E-02 (2.23E-03)
2.49E-01 (2.00E-02)
4.46E-01 (1.19E-02)
6.32E-01 (9.28E-03)
6.29E-01 (1.25E-02)
4 Sta - RT-MAC
5.37E-02 (5.19E-03)
2.49E-01 (7.33E-03)
4.40E-01 (9.75E-03)
6.18E-01 (1.65E-02)
6.67E-01 (7.92E-03)
10 Sta - 802.11
1.35E-01 (5.78E-03)
3.29E-01 (1.09E-02)
5.15E-01 (1.24E-02)
5.06E-01 (3.36E-03)
5.05E-01 (9.09E-03)
10 Sta - RT-MAC
1.34E-01 (6.34E-03)
3.27E-01 (1.24E-02)
5.04E-01 (2.19E-02)
6.24E-01 (1.28E-02)
6.21E-01 (1.33E-02)
14 Sta - 802.11
1.91E-01 (7.41E-03)
3.87E-01 (1.21E-02)
4.44E-01 (6.23E-03)
4.41E-01 (8.02E-03)
4.46E-01 (3.97E-03)
14 Sta - RT-MAC
1.82E-01 (5.07E-03)
3.77E-01 (3.99E-03)
5.34E-01 (1.24E-02)
6.28E-01 (5.50E-03)
6.35E-01 (1.26E-02)
20 Sta - 802.11
2.67E-01 (1.28E-02)
3.71E-01 (1.07E-02)
3.65E-01 (1.25E-02)
3.59E-01 (2.06E-02)
3.64E-01 (1.03E-02)
20 Sta - RT-MAC
2.62E-01 (3.69E-03)
4.25E-01 (1.02E-02)
5.29E-01 (1.10E-02)
6.23E-01 (1.18E-02)
6.46E-01 (5.26E-03)
24 Sta - 802.11
3.17E-01 (1.51E-02)
3.20E-01 (1.26E-02)
3.23E-01 (1.79E-02)
3.21E-01 (1.38E-02)
3.26E-01 (1.33E-02)
24 Sta - RT-MAC
2.92E-01 (1.31E-02)
4.25E-01 (1.01E-02)
5.24E-01 (1.48E-02)
6.22E-01 (5.30E-03)
6.49E-01 (1.15E-02)
30 Sta - 802.11
2.88E-01 (2.33E-03)
2.98E-01 (9.60E-03)
2.96E-01 (2.77E-03)
2.97E-01 (6.47E-03)
2.99E-01 (1.19E-02)
30 Sta - RT-MAC
3.05E-01 (3.82E-03)
4.17E-01 (2.59E-03)
5.20E-01 (2.97E-03)
6.18E-01 (1.27E-02)
6.51E-01 (2.26E-03)
Rusty O. Baldwin
Appendix B. Simulation Data Tables
295
Table B.20: Voice Mean Delay - Ideal Channel (1 Mbps) (Figure 6.34) Offered Data Load (GNRT ) Stations - Protocol 4 Sta - 802.11
0.0
0.2
0.4
0.6
0.8
2.10E-02 (4.88E-05)
1.44E-02 (3.27E-04)
1.40E-02 (6.02E-04)
1.20E+00 (1.75E+00)
6.19E+00 (6.38E-01)
4 Sta - RT-MAC
2.13E-02 (4.62E-05)
1.47E-02 (6.23E-05)
1.39E-02 (4.91E-04)
1.00E-01 (2.48E-02)
5.70E+00 (4.70E-01)
10 Sta - 802.11
2.12E-02 (4.16E-05)
1.93E-02 (2.07E-04)
9.97E-01 (6.30E-01)
9.84E+00 (5.50E-01)
1.17E+01 (3.16E-01) 8.59E+00 (3.73E+00)
10 Sta - RT-MAC
2.23E-02 (1.75E-05)
2.06E-02 (3.40E-04)
6.16E-02 (3.04E-02)
2.80E+00 (6.35E-01)
14 Sta - 802.11
2.16E-02 (3.48E-04)
4.52E-02 (1.89E-02)
1.03E+01 (1.12E+00)
1.38E+01 (1.66E+00)
1.52E+01 (2.97E-01)
14 Sta - RT-MAC
2.33E-02 (1.35E-04)
3.10E-02 (1.01E-03)
2.28E-01 (2.83E-02)
1.77E+00 (3.48E-01)
8.14E+00 (1.37E+00)
20 Sta - 802.11
2.72E-02 (2.31E-03)
4.31E+00 (1.37E+00)
9.41E+00 (7.59E+00)
8.80E+00 (4.21E+00)
1.15E+01 (5.67E+00)
20 Sta - RT-MAC
3.17E-02 (3.91E-03)
1.04E-01 (1.14E-02)
3.14E-01 (1.51E-02)
1.23E+00 (2.14E-01)
7.46E+00 (6.87E-01)
24 Sta - 802.11
2.36E-01 (2.02E-01)
4.81E+00 (1.03E+00)
5.76E+00 (5.99E-01)
6.43E+00 (7.42E-01)
6.56E+00 (8.34E-01)
24 Sta - RT-MAC
4.95E-02 (6.30E-03)
1.39E-01 (8.99E-03)
3.09E-01 (1.48E-02)
1.04E+00 (2.23E-01)
7.19E+00 (8.63E-01)
4.51E+00 (2.28E+00)
6.53E+00 (1.32E+00)
8.03E+00 (6.08E-01)
8.58E+00 (6.00E-01)
8.68E+00 (1.13E+00)
7.38E-02 (3.42E-03)
1.57E-01 (4.00E-03)
3.13E-01 (1.11E-02)
9.69E-01 (1.27E-01)
7.42E+00 (1.09E+00)
30 Sta - 802.11 30 Sta - RT-MAC
Table B.21: Voice Mean Delay - Bursty Error Channel (1 Mbps) (Figure 6.35) Stations - Protocol 4 Sta - 802.11
0.0
0.2
Offered Data Load (GNRT ) 0.4
0.6
0.8
2.35E-02 (1.86E-03)
1.78E-02 (2.61E-03)
2.01E-02 (2.43E-03)
1.38E+00 (1.92E+00)
6.15E+00 (2.07E-01) 5.44E+00 (5.22E-01)
4 Sta - RT-MAC
2.20E-02 (3.30E-04)
1.61E-02 (6.55E-04)
1.55E-02 (1.06E-03)
1.26E-01 (4.84E-02)
10 Sta - 802.11
2.44E-02 (1.59E-03)
2.52E-02 (3.50E-03)
2.47E+00 (3.41E+00)
1.04E+01 (1.45E+00)
1.21E+01 (1.70E-01)
10 Sta - RT-MAC
2.30E-02 (2.71E-04)
2.18E-02 (3.53E-04)
6.33E-02 (9.05E-03)
2.36E+00 (1.16E+00)
7.85E+00 (1.55E+00)
14 Sta - 802.11
2.56E-02 (2.32E-03)
6.54E-02 (1.11E-02)
1.14E+01 (4.98E-01)
1.45E+01 (5.76E-01)
1.55E+01 (6.17E-01)
14 Sta - RT-MAC
2.42E-02 (4.90E-04)
3.43E-02 (2.13E-03)
2.32E-01 (5.44E-02)
1.71E+00 (4.33E-01)
8.48E+00 (1.17E+00)
20 Sta - 802.11
4.02E-02 (2.19E-02)
4.92E+00 (3.52E+00)
6.21E+00 (2.19E+00)
8.18E+00 (2.60E+00)
1.16E+01 (8.74E+00)
20 Sta - RT-MAC
3.31E-02 (3.24E-03)
1.04E-01 (1.06E-02)
3.07E-01 (3.03E-02)
1.22E+00 (2.07E-01)
7.97E+00 (1.99E+00)
24 Sta - 802.11
7.63E-01 (1.72E+00)
4.62E+00 (1.00E+00)
5.78E+00 (5.90E-01)
6.29E+00 (9.17E-01)
7.31E+00 (9.94E-01)
24 Sta - RT-MAC
4.86E-02 (5.71E-03)
1.38E-01 (1.15E-02)
3.10E-01 (4.46E-02)
1.06E+00 (1.94E-01)
7.66E+00 (1.43E+00)
4.75E+00 (1.11E+00)
7.32E+00 (2.50E+00)
8.57E+00 (1.44E+00)
9.21E+00 (9.20E-01)
9.23E+00 (7.67E-01)
7.36E-02 (2.98E-03)
1.53E-01 (8.61E-03)
3.14E-01 (1.37E-02)
9.27E-01 (2.35E-01)
7.29E+00 (1.17E+00)
30 Sta - 802.11 30 Sta - RT-MAC
Table B.22: Voice Missed Deadline Ratio - Ideal Channel (1 Mbps) (Figure 6.38) Offered Data Load (GNRT ) Stations - Protocol
0.0
0.2
0.4
0.6
0.8
0.00E+00 (0.00E+00)
0.00E+00 (0.00E+00)
7.07E-05 (3.36E-05)
3.26E-02 (7.68E-04)
5.60E-02 (1.25E-03)
4 Sta - RT-MAC
0.00E+00 (0.00E+00)
0.00E+00 (0.00E+00)
0.00E+00 (0.00E+00)
0.00E+00 (0.00E+00)
8.25E-05 (3.62E-05)
10 Sta - 802.11
0.00E+00 (0.00E+00)
5.53E-04 (5.96E-05)
4.95E-01 (1.25E-03)
8.34E-01 (1.32E-03)
8.49E-01 (1.37E-03)
10 Sta - RT-MAC
0.00E+00 (0.00E+00)
0.00E+00 (0.00E+00)
2.53E-03 (1.26E-04)
3.81E-01 (1.23E-03)
4.76E-01 (1.94E-03)
2.13E-04 (3.11E-05)
5.85E-02 (5.17E-04)
9.27E-01 (6.27E-04)
9.40E-01 (6.17E-04)
9.42E-01 (6.16E-04)
4 Sta - 802.11
14 Sta - 802.11 14 Sta - RT-MAC 20 Sta - 802.11
0.00E+00 (0.00E+00)
1.39E-03 (7.91E-05)
1.39E-01 (7.36E-04)
5.89E-01 (1.04E-03)
7.16E-01 (1.78E-03)
1.52E-02 (3.41E-04)
9.36E-01 (8.15E-04)
9.80E-01 (3.73E-04)
9.83E-01 (4.11E-04)
9.84E-01 (3.48E-04)
20 Sta - RT-MAC
6.58E-03 (1.60E-04)
1.10E-01 (5.55E-04)
4.21E-01 (8.79E-04)
7.35E-01 (7.86E-04)
8.54E-01 (1.19E-03)
24 Sta - 802.11
2.93E-01 (9.84E-04)
9.68E-01 (8.50E-04)
9.83E-01 (7.05E-04)
9.85E-01 (6.52E-04)
9.90E-01 (5.65E-04)
24 Sta - RT-MAC
5.26E-02 (7.26E-04)
2.55E-01 (7.11E-04)
5.33E-01 (8.11E-04)
7.87E-01 (6.69E-04)
8.96E-01 (9.28E-04)
30 Sta - 802.11
9.36E-01 (1.19E-03)
9.84E-01 (6.52E-04)
9.92E-01 (4.78E-04)
9.93E-01 (4.33E-04)
9.96E-01 (3.34E-04)
30 Sta - RT-MAC
1.89E-01 (1.26E-03)
4.22E-01 (7.20E-04)
6.44E-01 (6.98E-04)
8.47E-01 (5.25E-04)
9.29E-01 (7.04E-04)
Rusty O. Baldwin
Appendix B. Simulation Data Tables
296
Table B.23: Voice Missed Deadline Ratio - Bursty Error Channel (1 Mbps) (Figure 6.39) Offered Data Load (GNRT ) Stations - Protocol 4 Sta - 802.11
0.0
0.2
0.4
0.6
0.8
8.84E-03 (3.74E-04)
1.05E-02 (4.05E-04)
1.44E-02 (4.74E-04)
7.16E-02 (1.37E-03)
9.45E-02 (2.11E-03)
4 Sta - RT-MAC
6.59E-03 (3.22E-04)
9.56E-03 (3.86E-04)
8.70E-03 (3.71E-04)
1.20E-02 (4.34E-04)
1.76E-02 (5.26E-04)
10 Sta - 802.11
1.09E-02 (2.61E-04)
1.87E-02 (3.56E-04)
6.21E-01 (1.24E-03)
8.44E-01 (1.29E-03)
8.52E-01 (1.31E-03)
10 Sta - RT-MAC
1.09E-02 (2.62E-04)
1.22E-02 (2.79E-04)
1.77E-02 (3.33E-04)
3.54E-01 (1.25E-03)
4.84E-01 (2.28E-03)
14 Sta - 802.11
1.43E-02 (2.83E-04)
1.01E-01 (6.47E-04)
9.31E-01 (6.04E-04)
9.43E-01 (5.72E-04)
9.42E-01 (6.14E-04)
14 Sta - RT-MAC
1.25E-02 (2.40E-04)
1.51E-02 (3.20E-04)
1.60E-01 (7.83E-04)
5.92E-01 (1.08E-03)
7.16E-01 (1.80E-03)
20 Sta - 802.11
5.70E-02 (5.35E-04)
9.47E-01 (7.16E-04)
9.75E-01 (6.32E-04)
9.82E-01 (4.92E-04)
9.85E-01 (3.21E-04)
20 Sta - RT-MAC
1.97E-02 (3.90E-04)
1.21E-01 (5.82E-04)
4.27E-01 (8.81E-04)
7.42E-01 (8.82E-04)
8.57E-01 (1.13E-03)
24 Sta - 802.11
4.44E-01 (1.31E-03)
9.70E-01 (8.68E-04)
9.85E-01 (6.52E-04)
9.88E-01 (5.93E-04)
9.88E-01 (5.66E-04)
24 Sta - RT-MAC
5.68E-02 (7.34E-04)
2.69E-01 (7.24E-04)
5.34E-01 (8.13E-04)
7.93E-01 (7.49E-04)
8.98E-01 (9.36E-04)
30 Sta - 802.11
9.68E-01 (8.75E-04)
9.88E-01 (5.53E-04)
9.92E-01 (4.31E-04)
9.95E-01 (3.50E-04)
9.97E-01 (2.83E-04)
30 Sta - RT-MAC
2.06E-01 (1.29E-03)
4.25E-01 (7.26E-04)
6.45E-01 (6.98E-04)
8.44E-01 (6.35E-04)
9.30E-01 (7.06E-04)
Table B.24: Voice Collision Ratio - Ideal Channel (1 Mbps) (Figure 6.44) Stations - Protocol 4 Sta - 802.11
Offered Data Load (GNRT ) 0.4
0.0
0.2
0.6
0.8
1.38E-03 (1.47E-04)
2.53E-03 (1.52E-04)
9.95E-03 (2.51E-04)
5.42E-02 (5.37E-04)
6.09E-02 (6.97E-04)
4 Sta - RT-MAC
5.27E-04 (9.13E-05)
1.41E-03 (1.14E-04)
3.70E-03 (1.55E-04)
1.28E-02 (2.53E-04)
1.85E-02 (2.93E-04)
10 Sta - 802.11
2.54E-03 (1.27E-04)
1.68E-02 (2.84E-04)
1.33E-01 (6.32E-04)
1.69E-01 (9.65E-04)
1.69E-01 (1.04E-03)
10 Sta - RT-MAC
2.97E-03 (1.39E-04)
7.50E-03 (1.92E-04)
1.83E-02 (2.68E-04)
3.23E-02 (3.66E-04)
3.44E-02 (5.85E-04)
14 Sta - 802.11
7.11E-03 (1.78E-04)
6.44E-02 (4.75E-04)
2.18E-01 (7.77E-04)
2.20E-01 (8.39E-04)
2.20E-01 (8.48E-04)
14 Sta - RT-MAC
6.13E-03 (1.65E-04)
1.51E-02 (2.34E-04)
2.74E-02 (3.05E-04)
3.45E-02 (3.81E-04)
3.60E-02 (7.56E-04)
20 Sta - 802.11
3.33E-02 (4.91E-04)
2.65E-01 (1.20E-03)
2.77E-01 (9.72E-04)
2.77E-01 (1.16E-03)
2.78E-01 (1.01E-03)
20 Sta - RT-MAC
1.46E-02 (2.36E-04)
2.59E-02 (2.75E-04)
2.86E-02 (3.16E-04)
3.34E-02 (3.81E-04)
3.87E-02 (8.12E-04)
24 Sta - 802.11
1.45E-01 (7.04E-04)
2.96E-01 (1.81E-03)
3.01E-01 (2.02E-03)
3.02E-01 (2.02E-03)
3.02E-01 (2.07E-03)
24 Sta - RT-MAC
2.14E-02 (4.79E-04)
2.62E-02 (2.76E-04)
2.76E-02 (3.14E-04)
3.17E-02 (3.75E-04)
3.84E-02 (7.99E-04)
30 Sta - 802.11
3.24E-01 (1.88E-03)
3.37E-01 (2.01E-03)
3.40E-01 (2.01E-03)
3.41E-01 (2.01E-03)
3.44E-01 (2.00E-03)
30 Sta - RT-MAC
2.45E-02 (5.47E-04)
2.54E-02 (2.76E-04)
2.68E-02 (3.14E-04)
3.13E-02 (3.78E-04)
3.76E-02 (8.22E-04)
Table B.25: Voice Collision Ratio - Bursty Error Channel (1 Mbps) (Figure 6.45) Offered Data Load (GNRT ) Stations - Protocol 4 Sta - 802.11
0.0
0.2
0.4
0.6
0.8
9.54E-04 (1.21E-04)
3.20E-03 (1.69E-04)
1.11E-02 (2.63E-04)
5.17E-02 (6.39E-04)
5.91E-02 (9.15E-04)
4 Sta - RT-MAC
6.63E-04 (1.01E-04)
1.64E-03 (1.21E-04)
3.93E-03 (1.59E-04)
1.31E-02 (2.55E-04)
1.82E-02 (2.90E-04)
10 Sta - 802.11
4.64E-03 (1.68E-04)
1.90E-02 (3.09E-04)
1.39E-01 (6.53E-04)
1.62E-01 (9.48E-04)
1.65E-01 (9.91E-04)
10 Sta - RT-MAC
3.25E-03 (1.42E-04)
7.55E-03 (1.91E-04)
1.76E-02 (2.64E-04)
3.12E-02 (3.67E-04)
3.32E-02 (6.84E-04)
14 Sta - 802.11
1.08E-02 (2.42E-04)
6.68E-02 (4.65E-04)
2.13E-01 (7.58E-04)
2.15E-01 (7.92E-04)
2.15E-01 (8.31E-04)
14 Sta - RT-MAC
5.89E-03 (1.64E-04)
1.54E-02 (2.92E-04)
2.69E-02 (3.04E-04)
3.35E-02 (3.90E-04)
3.73E-02 (7.66E-04)
20 Sta - 802.11
4.68E-02 (4.70E-04)
2.63E-01 (1.15E-03)
2.72E-01 (1.45E-03)
2.73E-01 (1.33E-03)
2.71E-01 (9.51E-04)
20 Sta - RT-MAC
1.53E-02 (3.41E-04)
2.54E-02 (2.73E-04)
2.86E-02 (3.15E-04)
3.32E-02 (4.30E-04)
3.87E-02 (7.79E-04)
24 Sta - 802.11
1.78E-01 (9.03E-04)
2.91E-01 (1.88E-03)
2.94E-01 (1.94E-03)
2.96E-01 (1.98E-03)
2.98E-01 (1.95E-03)
24 Sta - RT-MAC
2.02E-02 (4.53E-04)
2.59E-02 (2.75E-04)
2.75E-02 (3.13E-04)
3.19E-02 (4.27E-04)
3.80E-02 (8.18E-04)
30 Sta - 802.11
3.23E-01 (1.89E-03)
3.34E-01 (1.93E-03)
3.34E-01 (1.90E-03)
3.36E-01 (1.92E-03)
3.37E-01 (1.94E-03)
30 Sta - RT-MAC
2.42E-02 (5.41E-04)
2.54E-02 (2.77E-04)
2.63E-02 (3.11E-04)
3.10E-02 (4.50E-04)
3.95E-02 (8.49E-04)
Rusty O. Baldwin
B.3.2
Appendix B. Simulation Data Tables
297
10 Mbps Data Rate Table B.26: Voice Throughput - Ideal Channel (10 Mbps) (Figure 6.46) Offered Data Load (GNRT )
Stations - Protocol
0.0
0.2
0.4
0.6
0.8
10 Sta - 802.11
1.33E-02 (4.05E-04)
2.11E-01 (2.54E-03)
4.08E-01 (8.93E-03)
4.67E-01 (3.44E-03)
4.69E-01 (6.88E-03)
10 Sta - RT-MAC
1.35E-02 (2.42E-04)
2.07E-01 (3.30E-03)
3.88E-01 (3.22E-03)
5.10E-01 (4.43E-03)
5.14E-01 (8.40E-04)
20 Sta - 802.11
2.68E-02 (9.05E-04)
2.26E-01 (2.26E-03)
4.18E-01 (5.48E-03)
3.47E-01 (7.68E-03)
3.46E-01 (3.87E-03)
20 Sta - RT-MAC
2.67E-02 (7.71E-04)
2.20E-01 (2.22E-03)
3.94E-01 (3.66E-03)
4.86E-01 (1.86E-03)
4.86E-01 (7.71E-04)
30 Sta - 802.11
4.03E-02 (1.54E-03)
2.40E-01 (3.66E-03)
3.53E-01 (1.11E-02)
3.11E-01 (4.70E-03)
3.11E-01 (5.30E-03)
30 Sta - RT-MAC
4.01E-02 (1.27E-03)
2.32E-01 (2.15E-03)
3.98E-01 (3.10E-03)
4.61E-01 (8.23E-04)
4.60E-01 (1.46E-03)
40 Sta - 802.11
5.41E-02 (7.08E-04)
2.52E-01 (4.26E-03)
3.03E-01 (9.38E-03)
2.82E-01 (4.32E-03)
2.85E-01 (1.02E-02)
40 Sta - RT-MAC
5.40E-02 (9.16E-04)
2.41E-01 (5.19E-03)
4.01E-01 (2.53E-03)
3.93E-01 (4.48E-03)
3.92E-01 (1.53E-02)
50 Sta - 802.11
6.68E-02 (8.63E-04)
2.65E-01 (5.61E-03)
2.69E-01 (4.27E-03)
2.58E-01 (9.98E-03)
2.57E-01 (5.51E-03)
50 Sta - RT-MAC
6.72E-02 (1.31E-03)
2.53E-01 (4.16E-03)
3.77E-01 (1.04E-02)
3.54E-01 (7.20E-03)
3.32E-01 (8.93E-03)
60 Sta - 802.11
8.08E-02 (8.83E-04)
2.79E-01 (2.06E-03)
2.43E-01 (2.56E-03)
2.37E-01 (5.63E-03)
2.32E-01 (3.77E-03)
60 Sta - RT-MAC
8.07E-02 (1.05E-03)
2.66E-01 (2.97E-03)
3.65E-01 (8.18E-03)
3.50E-01 (7.06E-03)
3.32E-01 (8.85E-03)
70 Sta - 802.11
9.37E-02 (1.86E-03)
2.76E-01 (1.78E-02)
2.14E-01 (4.47E-03)
2.14E-01 (7.13E-03)
2.12E-01 (5.04E-03)
70 Sta - RT-MAC
9.44E-02 (1.14E-03)
2.75E-01 (4.95E-03)
3.62E-01 (5.32E-03)
3.53E-01 (1.05E-02)
3.28E-01 (8.46E-03)
80 Sta - 802.11
1.07E-01 (2.19E-03)
2.28E-01 (4.98E-02)
1.98E-01 (6.45E-03)
1.95E-01 (4.75E-03)
1.96E-01 (7.54E-03)
80 Sta - RT-MAC
1.08E-01 (2.23E-03)
2.72E-01 (7.54E-03)
3.63E-01 (7.91E-03)
3.58E-01 (1.42E-02)
3.37E-01 (8.86E-03)
Table B.27: Voice Throughput - Bursty Error Channel (10 Mbps) (Figure 6.47) Offered Data Load (GNRT ) Stations - Protocol 10 Sta - 802.11
0.0
0.2
0.4
0.6
0.8
1.35E-02 (5.34E-04)
2.11E-01 (4.08E-03)
4.04E-01 (1.36E-02)
4.50E-01 (1.04E-02)
4.51E-01 (1.58E-02)
10 Sta - RT-MAC
1.34E-02 (5.54E-04)
2.03E-01 (4.71E-03)
3.80E-01 (4.63E-03)
5.02E-01 (4.41E-03)
5.03E-01 (2.16E-03)
20 Sta - 802.11
2.69E-02 (2.48E-04)
2.23E-01 (2.23E-03)
4.04E-01 (2.77E-02)
3.42E-01 (3.27E-03)
3.42E-01 (7.98E-03)
20 Sta - RT-MAC
2.67E-02 (1.24E-03)
2.13E-01 (8.84E-03)
3.85E-01 (8.40E-03)
4.71E-01 (1.23E-02)
4.69E-01 (7.80E-03)
30 Sta - 802.11
4.05E-02 (6.25E-04)
2.31E-01 (6.51E-03)
3.35E-01 (1.37E-02)
3.10E-01 (9.32E-03)
3.12E-01 (7.07E-03)
30 Sta - RT-MAC
3.87E-02 (7.60E-04)
2.23E-01 (5.60E-03)
3.88E-01 (2.35E-03)
4.29E-01 (2.89E-02)
4.29E-01 (1.81E-02)
40 Sta - 802.11
5.33E-02 (1.91E-03)
2.43E-01 (3.77E-03)
3.01E-01 (1.31E-02)
2.80E-01 (8.41E-03)
2.78E-01 (1.36E-02)
40 Sta - RT-MAC
5.30E-02 (1.37E-03)
2.32E-01 (5.31E-03)
3.81E-01 (1.90E-02)
3.59E-01 (1.03E-02)
3.66E-01 (4.88E-02)
50 Sta - 802.11
6.54E-02 (2.71E-03)
2.56E-01 (3.85E-03)
2.66E-01 (9.23E-03)
2.54E-01 (1.04E-02)
2.51E-01 (7.08E-03)
50 Sta - RT-MAC
6.41E-02 (3.96E-03)
2.41E-01 (1.39E-02)
3.69E-01 (1.24E-02)
3.48E-01 (1.36E-02)
3.20E-01 (7.67E-03)
60 Sta - 802.11
7.74E-02 (3.79E-03)
2.66E-01 (9.87E-03)
2.40E-01 (8.96E-03)
2.29E-01 (4.28E-03)
2.29E-01 (1.01E-02)
60 Sta - RT-MAC
7.44E-02 (2.81E-03)
2.34E-01 (3.91E-02)
3.59E-01 (1.15E-02)
3.48E-01 (1.50E-02)
3.30E-01 (5.67E-03)
70 Sta - 802.11
8.89E-02 (3.36E-03)
2.43E-01 (1.09E-02)
2.10E-01 (8.99E-03)
2.09E-01 (5.70E-03)
2.11E-01 (4.45E-03)
70 Sta - RT-MAC
8.58E-02 (7.76E-03)
2.43E-01 (2.56E-02)
3.57E-01 (1.03E-02)
3.46E-01 (1.70E-02)
3.30E-01 (1.46E-02)
80 Sta - 802.11
9.57E-02 (7.99E-03)
2.08E-01 (1.28E-02)
1.94E-01 (7.22E-03)
1.91E-01 (9.34E-03)
1.91E-01 (5.45E-03)
80 Sta - RT-MAC
9.99E-02 (8.47E-03)
2.57E-01 (2.97E-02)
3.53E-01 (8.64E-03)
3.50E-01 (9.78E-03)
3.33E-01 (1.27E-02)
Rusty O. Baldwin
Appendix B. Simulation Data Tables
298
Table B.28: Voice Mean Delay - Ideal Channel (10 Mbps) (Figure 6.50) Offered Data Load (GNRT ) Stations - Protocol 10 Sta - 802.11
0.0
0.2
0.4
0.6
0.8
1.99E-02 (1.36E-05)
5.59E-03 (2.84E-04)
5.15E-03 (3.01E-04)
2.58E+00 (1.24E-01)
2.85E+00 (4.48E-02)
10 Sta - RT-MAC
2.02E-02 (3.87E-06)
6.06E-03 (2.61E-04)
4.51E-03 (1.85E-04)
4.17E-01 (2.56E-01)
2.19E+00 (4.52E-02)
20 Sta - 802.11
2.00E-02 (1.34E-05)
8.61E-03 (1.24E-04)
3.09E-02 (6.28E-02)
2.99E+00 (6.38E-01)
4.43E+00 (3.29E-01)
20 Sta - RT-MAC
2.06E-02 (5.76E-06)
9.60E-03 (9.30E-05)
8.29E-03 (7.57E-05)
2.90E+00 (4.56E-01)
4.13E+00 (3.15E-02)
30 Sta - 802.11
2.00E-02 (1.29E-05)
1.07E-02 (1.15E-04)
9.46E-01 (7.26E-01)
3.63E+00 (5.07E-01)
5.05E+00 (3.52E-01)
30 Sta - RT-MAC
2.10E-02 (1.18E-05)
1.24E-02 (1.69E-04)
1.38E-02 (6.26E-04)
4.83E+00 (2.39E-01)
5.82E+00 (5.31E-02)
40 Sta - 802.11
2.00E-02 (8.20E-06)
1.22E-02 (1.48E-04)
2.29E+00 (6.19E-01)
4.01E+00 (1.26E-01)
5.10E+00 (2.58E-01)
40 Sta - RT-MAC
2.15E-02 (1.26E-05)
1.46E-02 (2.03E-04)
3.95E-02 (8.55E-03)
2.91E+00 (5.90E-01)
4.98E+00 (7.18E-01)
50 Sta - 802.11
2.00E-02 (1.19E-05)
1.34E-02 (5.77E-05)
2.85E+00 (5.73E-01)
4.02E+00 (3.31E-01)
4.83E+00 (4.62E-01)
50 Sta - RT-MAC
2.20E-02 (1.49E-05)
1.70E-02 (9.31E-05)
3.47E-01 (1.40E-01)
2.16E+00 (3.06E-01)
2.98E+00 (2.87E-01)
60 Sta - 802.11
2.01E-02 (1.24E-05)
1.45E-02 (1.20E-04)
3.00E+00 (3.96E-01)
4.09E+00 (2.95E-01)
4.52E+00 (3.85E-01)
60 Sta - RT-MAC
2.26E-02 (3.61E-05)
2.00E-02 (2.63E-04)
6.35E-01 (1.84E-01)
2.13E+00 (2.93E-01)
3.02E+00 (3.07E-01)
70 Sta - 802.11
2.01E-02 (1.52E-05)
6.87E-02 (2.30E-01)
2.97E+00 (1.02E-01)
3.94E+00 (3.60E-01)
4.35E+00 (2.49E-01)
70 Sta - RT-MAC
2.33E-02 (2.76E-05)
2.56E-02 (1.42E-03)
7.62E-01 (1.32E-01)
2.22E+00 (2.32E-01)
3.02E+00 (1.67E-01)
80 Sta - 802.11
2.02E-02 (1.74E-05)
1.11E+00 (8.44E-01)
3.15E+00 (1.02E-01)
3.97E+00 (3.17E-01)
4.28E+00 (2.55E-01)
80 Sta - RT-MAC
2.43E-02 (7.46E-05)
5.18E-02 (1.29E-02)
7.48E-01 (1.76E-01)
2.28E+00 (2.19E-01)
3.02E+00 (1.27E-01)
Table B.29: Voice Mean Delay - Bursty Error Channel (10 Mbps) (Figure 6.51) Offered Data Load (GNRT ) Stations - Protocol
0.0
0.2
0.4
0.6
0.8
10 Sta - 802.11
2.15E-02 (5.87E-04)
9.62E-03 (3.17E-03)
1.94E-02 (1.31E-02)
2.57E+00 (3.46E-01)
2.87E+00 (6.91E-02)
10 Sta - RT-MAC
2.09E-02 (2.03E-04)
7.28E-03 (1.23E-03)
6.20E-03 (1.03E-03)
5.43E-01 (3.01E-01)
2.18E+00 (1.18E-01)
20 Sta - 802.11
2.26E-02 (1.43E-03)
1.26E-02 (2.25E-03)
1.63E-01 (4.31E-01)
3.61E+00 (4.64E-01)
4.67E+00 (2.62E-01)
20 Sta - RT-MAC
2.13E-02 (1.69E-04)
1.07E-02 (1.28E-04)
1.06E-02 (1.82E-03)
2.73E+00 (6.92E-01)
4.06E+00 (1.14E-01)
30 Sta - 802.11
2.23E-02 (2.08E-03)
1.58E-02 (4.80E-03)
1.53E+00 (4.43E-01)
4.04E+00 (1.99E-01)
5.34E+00 (3.18E-01)
30 Sta - RT-MAC
2.18E-02 (2.58E-04)
1.35E-02 (5.88E-04)
1.68E-02 (2.68E-03)
3.33E+00 (9.86E-01)
5.28E+00 (2.57E-01)
40 Sta - 802.11
2.30E-02 (2.43E-03)
1.83E-02 (8.69E-03)
2.40E+00 (4.21E-01)
4.17E+00 (4.55E-01)
5.28E+00 (6.59E-01)
40 Sta - RT-MAC
2.22E-02 (2.53E-04)
1.59E-02 (6.37E-04)
5.92E-02 (3.22E-02)
2.00E+00 (3.35E-01)
4.09E+00 (1.44E+00)
50 Sta - 802.11
2.22E-02 (1.24E-03)
2.30E-02 (9.59E-03)
3.13E+00 (3.59E-01)
4.07E+00 (2.59E-01)
5.00E+00 (5.49E-01)
50 Sta - RT-MAC
2.27E-02 (5.29E-04)
1.84E-02 (9.67E-04)
3.57E-01 (1.34E-01)
2.19E+00 (3.13E-01)
2.99E+00 (3.10E-01)
60 Sta - 802.11
2.38E-02 (3.85E-03)
3.14E-02 (3.77E-02)
3.14E+00 (2.41E-01)
3.98E+00 (3.83E-01)
4.66E+00 (3.39E-01)
60 Sta - RT-MAC
2.36E-02 (7.10E-04)
2.24E-02 (1.93E-03)
6.91E-01 (2.09E-01)
2.12E+00 (2.62E-01)
3.00E+00 (7.76E-02)
70 Sta - 802.11
2.46E-02 (6.15E-03)
8.05E-01 (5.17E-01)
3.05E+00 (3.56E-01)
4.14E+00 (4.93E-01)
4.50E+00 (3.94E-01)
70 Sta - RT-MAC
2.43E-02 (5.11E-04)
2.92E-02 (4.86E-03)
7.57E-01 (1.00E-01)
2.18E+00 (2.66E-01)
3.20E+00 (1.45E-01)
80 Sta - 802.11
2.41E-02 (2.73E-03)
1.27E+00 (3.15E-01)
3.31E+00 (1.85E-01)
4.18E+00 (4.64E-01)
4.37E+00 (3.33E-01)
80 Sta - RT-MAC
2.53E-02 (1.44E-03)
5.67E-02 (2.63E-02)
7.62E-01 (1.25E-01)
2.15E+00 (1.22E-01)
3.33E+00 (3.96E-01)
Rusty O. Baldwin
Appendix B. Simulation Data Tables
299
Table B.30: Voice Missed Deadline Ratio - Ideal Channel (10 Mbps) (Figure 6.54) Offered Data Load (GNRT ) Stations - Protocol
0.0
0.2
0.4
0.6
0.8
0.00E+00 (0.00E+00)
0.00E+00 (0.00E+00)
8.78E-05 (2.38E-05)
5.39E-02 (1.20E-03)
5.32E-02 (1.19E-03)
10 Sta - RT-MAC
0.00E+00 (0.00E+00)
0.00E+00 (0.00E+00)
0.00E+00 (0.00E+00)
7.03E-05 (2.11E-05)
1.01E-04 (2.53E-05)
20 Sta - 802.11
0.00E+00 (0.00E+00)
0.00E+00 (0.00E+00)
1.80E-02 (3.45E-04)
2.85E-01 (3.68E-03)
3.09E-01 (3.75E-03)
20 Sta - RT-MAC
0.00E+00 (0.00E+00)
0.00E+00 (0.00E+00)
5.98E-06 (4.40E-06)
8.51E-04 (5.20E-05)
8.19E-04 (5.09E-05)
30 Sta - 802.11
0.00E+00 (0.00E+00)
0.00E+00 (0.00E+00)
4.19E-01 (2.43E-03)
5.62E-01 (3.13E-03)
5.79E-01 (3.12E-03)
30 Sta - RT-MAC
0.00E+00 (0.00E+00)
0.00E+00 (0.00E+00)
7.63E-05 (1.27E-05)
5.46E-03 (1.08E-04)
5.21E-03 (1.05E-04)
40 Sta - 802.11
0.00E+00 (0.00E+00)
0.00E+00 (0.00E+00)
7.17E-01 (2.09E-03)
7.41E-01 (2.38E-03)
7.55E-01 (2.36E-03)
40 Sta - RT-MAC
0.00E+00 (0.00E+00)
1.19E-06 (1.39E-06)
9.38E-04 (3.85E-05)
3.15E-02 (7.05E-04)
3.26E-02 (7.28E-04)
50 Sta - 802.11
0.00E+00 (0.00E+00)
1.41E-06 (1.34E-06)
8.37E-01 (1.60E-03)
8.58E-01 (1.65E-03)
8.56E-01 (1.69E-03)
50 Sta - RT-MAC
0.00E+00 (0.00E+00)
1.46E-05 (4.30E-06)
1.72E-02 (3.63E-04)
1.44E-01 (1.61E-03)
1.69E-01 (2.03E-03)
60 Sta - 802.11
0.00E+00 (0.00E+00)
1.31E-04 (1.18E-05)
8.98E-01 (1.21E-03)
9.12E-01 (1.20E-03)
9.15E-01 (1.18E-03)
3.93E-07 (6.46E-07)
1.07E-04 (1.06E-05)
1.27E-01 (9.64E-04)
3.40E-01 (2.12E-03)
3.66E-01 (2.49E-03)
0.00E+00 (0.00E+00)
8.93E-02 (5.94E-04)
9.36E-01 (9.82E-04)
9.42E-01 (9.44E-04)
9.46E-01 (9.09E-04)
1.17E-05 (3.27E-06)
8.66E-04 (2.81E-05)
2.79E-01 (1.23E-03)
4.87E-01 (2.02E-03)
5.14E-01 (2.44E-03)
0.00E+00 (0.00E+00)
6.20E-01 (1.40E-03)
9.55E-01 (7.98E-04)
9.63E-01 (7.19E-04)
9.61E-01 (7.37E-04)
1.47E-05 (3.42E-06)
7.64E-03 (1.51E-04)
3.95E-01 (1.27E-03)
5.94E-01 (1.87E-03)
6.27E-01 (2.21E-03)
10 Sta - 802.11
60 Sta - RT-MAC 70 Sta - 802.11 70 Sta - RT-MAC 80 Sta - 802.11 80 Sta - RT-MAC
Table B.31: Voice Missed Deadline Ratio - Bursty Error Channel (10 Mbps) (Figure 6.55) Offered Data Load (GNRT ) Stations - Protocol
0.0
0.2
0.4
0.6
0.8
10 Sta - 802.11
5.96E-03 (1.94E-04)
1.22E-02 (2.82E-04)
1.50E-02 (3.40E-04)
6.93E-02 (1.55E-03)
6.86E-02 (1.53E-03)
10 Sta - RT-MAC
6.94E-03 (2.09E-04)
9.66E-03 (2.55E-04)
8.69E-03 (2.36E-04)
9.68E-03 (2.47E-04)
1.25E-02 (2.82E-04)
20 Sta - 802.11
8.92E-03 (1.68E-04)
1.17E-02 (2.45E-04)
7.26E-02 (8.76E-04)
3.24E-01 (3.70E-03)
3.40E-01 (3.73E-03)
20 Sta - RT-MAC
1.03E-02 (1.80E-04)
8.69E-03 (1.84E-04)
9.91E-03 (2.15E-04)
1.23E-02 (2.69E-04)
1.40E-02 (3.12E-04)
30 Sta - 802.11
7.83E-03 (1.37E-04)
1.55E-02 (2.86E-04)
5.18E-01 (2.62E-03)
5.90E-01 (3.10E-03)
5.71E-01 (3.15E-03)
30 Sta - RT-MAC
1.08E-02 (1.84E-04)
1.22E-02 (2.67E-04)
1.02E-02 (2.21E-04)
1.98E-02 (4.41E-04)
2.09E-02 (4.66E-04)
40 Sta - 802.11
9.53E-03 (1.66E-04)
2.21E-02 (3.58E-04)
7.28E-01 (2.08E-03)
7.71E-01 (2.24E-03)
7.77E-01 (2.19E-03)
40 Sta - RT-MAC
1.07E-02 (1.99E-04)
1.12E-02 (2.46E-04)
1.45E-02 (3.04E-04)
5.37E-02 (1.18E-03)
4.60E-02 (1.01E-03)
50 Sta - 802.11
6.94E-03 (1.37E-04)
2.71E-02 (3.13E-04)
8.51E-01 (1.46E-03)
8.57E-01 (1.65E-03)
8.63E-01 (1.60E-03)
50 Sta - RT-MAC
8.76E-03 (1.75E-04)
1.13E-02 (2.40E-04)
3.13E-02 (4.97E-04)
1.74E-01 (1.71E-03)
2.02E-01 (2.27E-03)
60 Sta - 802.11
1.18E-02 (2.15E-04)
5.51E-02 (4.90E-04)
9.03E-01 (1.17E-03)
9.18E-01 (1.15E-03)
9.14E-01 (1.19E-03)
60 Sta - RT-MAC
1.49E-02 (3.00E-04)
1.63E-02 (3.62E-04)
1.51E-01 (9.87E-04)
3.55E-01 (2.07E-03)
3.97E-01 (2.62E-03)
70 Sta - 802.11
1.31E-02 (2.57E-04)
7.03E-01 (1.37E-03)
9.40E-01 (9.45E-04)
9.47E-01 (8.77E-04)
9.46E-01 (9.00E-04)
70 Sta - RT-MAC
1.23E-02 (2.60E-04)
1.97E-02 (4.13E-04)
2.89E-01 (1.25E-03)
5.08E-01 (1.98E-03)
5.45E-01 (2.39E-03)
80 Sta - 802.11
1.37E-02 (3.01E-04)
8.42E-01 (1.33E-03)
9.59E-01 (7.43E-04)
9.63E-01 (6.98E-04)
9.65E-01 (6.79E-04)
80 Sta - RT-MAC
9.37E-03 (1.77E-04)
2.34E-02 (3.60E-04)
4.10E-01 (1.27E-03)
6.02E-01 (1.91E-03)
6.41E-01 (2.10E-03)
Rusty O. Baldwin
Appendix B. Simulation Data Tables
300
Table B.32: Voice Collision Ratio - Ideal Channel (10 Mbps) (Figure 6.60) Offered Data Load (GNRT ) Stations - Protocol 10 Sta - 802.11
0.0
0.2
0.4
0.6
0.8
1.14E-03 (8.54E-05)
7.92E-03 (1.13E-04)
4.78E-02 (2.02E-04)
1.71E-01 (6.48E-04)
1.72E-01 (6.35E-04)
10 Sta - RT-MAC
2.36E-03 (1.22E-04)
1.20E-02 (1.39E-04)
3.23E-02 (1.72E-04)
9.05E-02 (2.40E-04)
9.64E-02 (2.45E-04)
20 Sta - 802.11
2.40E-03 (8.75E-05)
1.44E-02 (1.35E-04)
1.20E-01 (4.00E-04)
2.78E-01 (1.55E-03)
2.80E-01 (1.55E-03)
20 Sta - RT-MAC
6.05E-03 (1.38E-04)
2.03E-02 (1.60E-04)
5.10E-02 (1.99E-04)
1.22E-01 (2.62E-04)
1.23E-01 (2.62E-04)
30 Sta - 802.11
4.24E-03 (9.45E-05)
2.16E-02 (1.49E-04)
3.17E-01 (1.13E-03)
3.41E-01 (1.50E-03)
3.42E-01 (1.50E-03)
30 Sta - RT-MAC
9.71E-03 (1.43E-04)
2.79E-02 (1.70E-04)
6.80E-02 (2.13E-04)
1.35E-01 (2.65E-04)
1.35E-01 (2.65E-04)
40 Sta - 802.11
6.34E-03 (9.96E-05)
3.02E-02 (1.62E-04)
3.79E-01 (1.22E-03)
3.86E-01 (1.44E-03)
3.86E-01 (1.44E-03)
40 Sta - RT-MAC
1.43E-02 (1.48E-04)
3.52E-02 (1.76E-04)
8.85E-02 (2.27E-04)
1.41E-01 (8.40E-04)
1.41E-01 (8.54E-04)
50 Sta - 802.11
8.84E-03 (1.06E-04)
4.23E-02 (1.77E-04)
4.16E-01 (1.23E-03)
4.21E-01 (1.35E-03)
4.21E-01 (1.37E-03)
50 Sta - RT-MAC
1.91E-02 (1.53E-04)
4.41E-02 (1.82E-04)
1.16E-01 (6.01E-04)
1.43E-01 (1.07E-03)
1.44E-01 (1.28E-03)
60 Sta - 802.11
1.23E-02 (1.13E-04)
6.05E-02 (1.95E-04)
4.44E-01 (1.19E-03)
4.48E-01 (1.27E-03)
4.48E-01 (1.28E-03)
60 Sta - RT-MAC
2.42E-02 (1.56E-04)
5.59E-02 (1.90E-04)
1.26E-01 (6.93E-04)
1.44E-01 (1.16E-03)
1.45E-01 (1.34E-03)
70 Sta - 802.11
1.60E-02 (1.19E-04)
1.61E-01 (5.88E-04)
4.69E-01 (1.25E-03)
4.71E-01 (1.25E-03)
4.73E-01 (1.25E-03)
70 Sta - RT-MAC
3.00E-02 (1.60E-04)
6.77E-02 (1.97E-04)
1.26E-01 (7.20E-04)
1.41E-01 (1.14E-03)
1.44E-01 (1.40E-03)
80 Sta - 802.11
2.09E-02 (1.27E-04)
4.03E-01 (9.54E-04)
4.90E-01 (1.21E-03)
4.94E-01 (1.20E-03)
4.94E-01 (1.20E-03)
80 Sta - RT-MAC
3.63E-02 (1.64E-04)
8.28E-02 (3.99E-04)
1.22E-01 (7.21E-04)
1.39E-01 (1.15E-03)
1.40E-01 (1.39E-03)
Table B.33: Voice Collision Ratio - Bursty Error Channel (10 Mbps) (Figure 6.61) Offered Data Load (GNRT ) Stations - Protocol
0.0
0.2
0.4
0.6
0.8
10 Sta - 802.11
1.46E-03 (9.35E-05)
1.15E-02 (1.36E-04)
5.74E-02 (2.41E-04)
1.68E-01 (7.31E-04)
1.71E-01 (7.43E-04)
10 Sta - RT-MAC
2.58E-03 (1.25E-04)
1.24E-02 (1.45E-04)
3.21E-02 (1.72E-04)
9.14E-02 (2.40E-04)
9.59E-02 (2.46E-04)
20 Sta - 802.11
3.94E-03 (1.09E-04)
2.05E-02 (2.02E-04)
1.58E-01 (5.70E-04)
2.76E-01 (1.50E-03)
2.76E-01 (1.51E-03)
20 Sta - RT-MAC
6.37E-03 (1.39E-04)
2.04E-02 (1.78E-04)
5.17E-02 (2.43E-04)
1.22E-01 (3.59E-04)
1.23E-01 (3.90E-04)
30 Sta - 802.11
7.37E-03 (1.30E-04)
3.17E-02 (2.81E-04)
3.26E-01 (1.21E-03)
3.37E-01 (1.48E-03)
3.39E-01 (1.49E-03)
30 Sta - RT-MAC
1.01E-02 (1.76E-04)
2.81E-02 (2.82E-04)
6.93E-02 (3.22E-04)
1.34E-01 (5.73E-04)
1.35E-01 (5.92E-04)
40 Sta - 802.11
1.17E-02 (1.79E-04)
4.75E-02 (3.80E-04)
3.78E-01 (1.22E-03)
3.82E-01 (1.41E-03)
3.77E-01 (1.38E-03)
40 Sta - RT-MAC
1.49E-02 (2.32E-04)
3.63E-02 (3.30E-04)
9.17E-02 (4.63E-04)
1.39E-01 (1.08E-03)
1.39E-01 (1.00E-03)
50 Sta - 802.11
1.41E-02 (1.90E-04)
6.34E-02 (3.57E-04)
4.12E-01 (1.17E-03)
4.13E-01 (1.34E-03)
4.14E-01 (1.33E-03)
50 Sta - RT-MAC
1.93E-02 (2.55E-04)
4.55E-02 (3.70E-04)
1.16E-01 (6.14E-04)
1.43E-01 (1.06E-03)
1.45E-01 (1.33E-03)
60 Sta - 802.11
2.08E-02 (2.76E-04)
1.14E-01 (5.20E-04)
4.42E-01 (1.17E-03)
4.44E-01 (1.27E-03)
4.44E-01 (1.27E-03)
60 Sta - RT-MAC
2.50E-02 (3.80E-04)
5.58E-02 (5.29E-04)
1.26E-01 (6.61E-04)
1.44E-01 (1.12E-03)
1.46E-01 (1.38E-03)
70 Sta - 802.11
2.74E-02 (3.58E-04)
4.04E-01 (9.56E-04)
4.64E-01 (1.22E-03)
4.63E-01 (1.21E-03)
4.67E-01 (1.23E-03)
70 Sta - RT-MAC
3.06E-02 (3.99E-04)
6.82E-02 (6.11E-04)
1.25E-01 (7.19E-04)
1.42E-01 (1.12E-03)
1.45E-01 (1.36E-03)
80 Sta - 802.11
3.36E-02 (4.50E-04)
4.57E-01 (1.17E-03)
4.86E-01 (1.17E-03)
4.85E-01 (1.15E-03)
4.89E-01 (1.17E-03)
80 Sta - RT-MAC
3.67E-02 (3.38E-04)
8.43E-02 (5.51E-04)
1.21E-01 (7.20E-04)
1.38E-01 (1.17E-03)
1.41E-01 (1.34E-03)
Rusty O. Baldwin
B.4
Appendix B. Simulation Data Tables
301
Other Simulations
B.4.1
RT-MAC Enhancements Study Table B.34: RT-MAC Enhancements Study Results (Figure 6.64)
Enabled Portion of
Normalized
Mean
Missed Deadline
Collision
Throughput (S)
Delay (D)
Ratio (F )
Ratio (C)
None (802.11)
6.42E-01 (2.08E-02)
1.08E+01 (1.92E+00)
5.93E-01 (1.53E-03)
2.88E-01 (1.19E-03)
ECA only
6.95E-01 (1.28E-03)
4.10E-02 (1.08E-03)
7.91E-03 (2.07E-04)
9.56E-03 (2.26E-04)
EDF only
6.33E-01 (2.83E-02)
1.13E+01 (4.40E+00)
6.88E-01 (1.63E-03)
3.14E-01 (1.35E-03)
TC only
6.86E-01 (3.19E-03)
3.13E-02 (2.05E-03)
1.27E-02 (2.84E-04)
7.74E-02 (6.55E-04)
TC/ECA
6.92E-01 (4.97E-03)
3.84E-02 (1.23E-03)
6.90E-03 (1.82E-04)
9.10E-03 (2.08E-04)
TC/EDF
6.87E-01 (5.48E-3)
3.10E-02 (1.78E-03)
1.20E-02 (2.69E-04)
7.56E-02 (6.31E-04)
ECA/EDF
6.98E-01 (4.03E-03)
4.15E-02 (1.34E-03)
7.45E-03 (1.89E-04)
9.22E-03 (2.09E-04)
TC/ECA/EDF
6.94E-01 (4.23E-03)
3.88E-02 (1.52E-03)
6.23E-03 (1.73E-04)
9.13E-03 (@.08E-04)
RT-MAC Algorithm
B.4.2
Contention Window Expansion Study
B.4.2.1
1 Mbps Channel
Table B.35: Contention Window Study Results - Collision Ratio (1 Mbps) (Figure 6.69) Enabled Portion of RT-MAC Algorithm
Stations 10
50
Value and CW Expansion
3.30E-02 (1.07E-03)
4.78E-02 (1.08E-03)
CW Expansion Only
8.93E-02 (1.60E-03)
11.82E-02 (1.17E-03)
IEEE 802.11
1.61E-01 (1.88E-03)
3.96E-01 (1.81E-03)
Transmit Next Backoff
Rusty O. Baldwin B.4.2.2
Appendix B. Simulation Data Tables
302
10 Mbps Channel
Table B.36: Contention Window Study Results - Collision Ratio (10 Mbps) Enabled Portion of
Stations
RT-MAC Algorithm
10
50
Value and CW Expansion
3.28E-02 (1.07E-03)
5.09E-02 (1.14E-03)
CW Expansion Only
8.85E-02 (1.59E-03)
1.21E-01 (1.79E-03)
IEEE 802.11
1.60E-01 (1.87E-03)
3.97E-01 (1.81E-03)
Transmit Next Backoff
B.4.3
Service Disciplines Table B.37: Service Disciplines Study Results (Figure 6.70) Service
Normalized
Mean
Missed Deadline
Collision
Throughput (S)
Delay (D)
Ratio (F )
Ratio (C)
EDF
5.20E-01 (3.69E-03)
3.22E+01 (2.24E+00)
9.85E-01 (5.97E-04)
3.61E-01 (2.03E-03)
FCFS
5.19E-01 (5.07E-03)
3.17E+01 (2.75E+00)
9.84E-01 (6.33E-04)
3.61E-01 (2.03E-03)
Random
5.18E-01 (2.37E-03)
2.55E+01 (8.70E-01)
9.67E-01 (8.95E-04)
3.62E-01 (2.03E-03)
LCFS
5.18E-01 (5.77E-03)
3.17E+00 (2.70E-01)
6.90E-01 (2.31E-03)
3.62E-01 (2.03E-03)
SJF
5.03E-01 (4.48E-03)
6.59E+00 (3.15E-01)
7.71E-01 (2.25E-03)
3.59E-01 (2.06E-03)
LJF
5.57E-01 (4.86E-03)
2.65E+01 (2.39E+00)
8.90E-01 (1.31E-03)
3.63E-01 (1.95E-03)
Discipline
B.4.4
RT-MAC/Non RT-MAC Networks Table B.38: Mixed RT-MAC/IEEE 802.11 Network, G = 0.9 (Figure 6.71) Normalized
Mean
Missed Deadline
Collision
Network
Throughput (S)
Delay (D)
Ratio (F )
Ratio (C)
RT-MAC
3.00E-01 (6.53E-04)
7.82E-03 (2.42E-05)
6.10E-01 (1.81E-03)
3.77E-02 (1.11E-03)
20/80%
2.99E-01 (2.46E-04)
8.48E-03 (6.61E-05)
6.29E-01 (1.66E-03)
6.67E-02 (1.34E-03)
40/60%
3.59E-01 (5.29E-03)
1.93E-02 (3.13E-03)
7.26E-01 (9.65E-04)
1.21E-01 (1.02E-03)
60/40%
3.18E-01 (1.38E-03)
6.70E+00 (9.14E-02)
9.95E-01 (2.57E-04)
1.90E-01 (1.94E-03)
80/20%
3.13E-01 (4.80E-04)
1.04E+01 (8.45E-02)
9.98E-01 (1.56E-04)
2.31E-01 (1.99E-03)
100%
3.08E-01 (1.28E-03)
7.11E+00 (4.46E-02)
1.00E+00 (0.00E+00)
2.56E-01 (1.99E-03)
Rusty O. Baldwin
Appendix B. Simulation Data Tables
303
Table B.39: Mixed RT-MAC/IEEE 802.11 Network, G = 0.3 (Figure 6.72) Normalized
Mean
Missed Deadline
Collision
Network
Throughput (S)
Delay (D)
Ratio (F )
Ratio (C)
RT-MAC
2.85E-01 (7.37E-05)
1.74E-02 (7.65E-05)
3.08E-04 (6.23E-05)
3.32E-02 (6.26E-04)
20/80%
2.85E-01 (7.04E-05)
1.87E-02 (6.12E-05)
4.89E-04 (7.85E-05)
5.45E-02 (7.84E-04)
40/60%
2.85E-01 (1.16E-04)
1.88E-02 (8.28E-05)
5.45E-04 (8.29E-05)
8.08E-02 (9.28E-04)
60/40%
2.85E-01 (7.05E-05)
1.91E-02 (4.79E-05)
7.27E-04 (9.57E-05)
1.04E-01 (1.03E-03)
80/20%
2.85E-01 (8.24E-05)
1.94E-02 (9.29E-05)
1.14E-03 (1.20E-04)
1.32E-01 (1.12E-03)
100%
2.85E-01 (1.93E-05)
1.99E-02 (1.11E-04)
1.49E-03 (1.37E-04)
1.48E-01 (1.16E-03)
Table B.40: Mixed RT-MAC/IEEE 802.11 Network, Avionics Traffic Model (Figure 6.73) Normalized
Mean
Missed Deadline
Collision
Network
Throughput (S)
Delay (D)
Ratio (F )
Ratio (C)
RT-MAC
8.08E-01 (9.54E-04)
1.24E-01 (3.13E-03)
1.10E-01 (1.09E-03)
2.58E-02 (5.76E-04)
20/80%
8.09E-01 (3.83E-03)
1.07E-01 (6.48E-03)
9.77E-02 (1.17E-03)
3.20E-02 (7.15E-04)
40/60%
8.06E-01 (2.18E-03)
9.32E-02 (2.04E-03)
1.01E-01 (1.14E-03)
4.02E-02 (7.69E-04)
60/40%
8.02E-01 (2.05E-03)
8.08E-02 (3.40E-03)
1.14E-01 (1.05E-03)
5.55E-02 (7.76E-04)
80/20%
7.02E-01 (9.73E-03)
5.99E+00 (1.50E+00)
8.28E-01 (1.19E-03)
2.20E-01 (1.30E-03)
100%
6.02E-01 (1.56E-03)
2.71E+01 (1.22E+00)
9.78E-01 (8.09E-04)
3.67E-01 (2.16E-03)
Table B.41: Mixed RT-MAC/IEEE 802.11 Network, Avionics Traffic Model, 5 Stations (Figure 6.74) Normalized
Mean
Missed Deadline
Collision
Network
Throughput (S)
Delay (D)
Ratio (F )
Ratio (C)
RT-MAC
8.25E-01 (1.88E-03)
1.22E-01 (3.58E-03)
7.42E-02 (7.82E-04)
1.85E-02 (4.14E-04)
20/80%
8.21E-01 (4.23E-03)
1.16E-01 (5.05E-03)
8.02E-02 (8.86E-04)
2.21E-02 (4.94E-04)
40/60%
8.15E-01 (2.10E-03)
1.07E-01 (5.89E-03)
8.42E-02 (1.01E-03)
2.75E-02 (6.14E-04)
60/40%
8.05E-01 (2.40E-03)
1.04E-01 (5.80E-03)
9.75E-02 (1.24E-03)
3.63E-02 (8.05E-04)
80/20%
7.95E-01 (4.68E-03)
2.86E-01 (2.12E-01)
3.20E-01 (1.82E-03)
5.86E-02 (9.36E-04)
100%
7.55E-01 (8.15E-03)
5.92E+00 (1.61E+00)
9.79E-01 (9.55E-04)
7.90E-02 (1.73E-03)
Rusty O. Baldwin
B.4.5
Appendix B. Simulation Data Tables
304
Static BER Table B.42: Static BER, BERs (Figure 6.75) Offered Data Load
IEEE 802.11
RT-MAC
IEEE 802.11
RT-MAC
IEEE 802.11
RT-MAC
(1 × 10⁻⁵ )
(1 × 10⁻⁵ )
Bursty
Bursty
(1 × 10⁻³ )
(1 × 10⁻³ )
0
1.68E-05
1.62E-05
3.61E-02
3.05E-02
1.66E-03
1.68E-03
0.2
1.38E-05
1.40E-05
2.86E-02
1.84E-02
1.65E-03
1.42E-03
0.4
1.34E-05
1.30E-05
2.44E-02
1.93E-02
1.65E-03
1.28E-03
0.6
1.36E-05
1.24E-05
2.15E-02
1.68E-02
1.65E-03
1.20E-03
0.8
1.36E-05
1.16E-05
2.29E-02
1.67E-02
1.65E-03
1.19E-03
(GNRT )
Table B.43: Static BER, Packet Error Rate (Figure 6.76) Offered Data Load
IEEE 802.11
RT-MAC
IEEE 802.11
RT-MAC
IEEE 802.11
RT-MAC
(1 × 10⁻⁵ )
(1 × 10⁻⁵ )
Bursty
Bursty
(1 × 10⁻³ )
(1 × 10⁻³ )
0
1.05E-02
1.02E-02
2.68E-02
2.25E-02
6.30E-01
6.51E-01
0.2
1.38E-02
1.45E-02
1.91E-02
1.74E-02
6.30E-01
6.97E-01
0.4
1.26E-02
1.80E-02
1.81E-02
1.81E-02
6.31E-01
7.52E-01
0.6
1.26E-02
2.54E-02
1.59E-02
1.73E-02
6.30E-01
8.23E-01
0.8
1.26E-02
2.68E-02
1.69E-02
1.77E-02
6.30E-01
8.37E-01
(GNRT )
Table B.44: Static BER, Throughput (Figure 6.77) Offered Data Load
IEEE 802.11
RT-MAC
IEEE 802.11
RT-MAC
IEEE 802.11
RT-MAC
(1 × 10⁻⁵ )
(1 × 10⁻⁵ )
Bursty
Bursty
(1 × 10⁻³ )
(1 × 10⁻³ )
0
1.88E-01 (8.88E-03)
1.89E-01 (5.03E-03)
1.91E-01 (7.41E-03)
1.82E-01 (5.07E-03)
1.31E-01 (8.95E-04)
9.44E-02 (2.25E-03)
0.2
3.86E-01 (2.14E-02)
3.77E-01 (6.95E-03)
3.87E-01 (1.21E-02)
3.77E-01 (3.99E-03)
1.31E-01 (9.96E-04)
7.87E-02 (1.08E-03)
0.4
4.44E-01 (5.14E-03)
5.26E-01 (6.11E-03)
4.44E-01 (6.23E-03)
5.34E-01 (1.24E-02)
1.31E-01 (1.55E-03)
6.09E-02 (1.90E-03)
0.6
4.40E-01 (5.98E-03)
6.15E-01 (1.14E-02)
4.41E-01 (8.02E-03)
6.28E-01 (5.50E-03)
1.31E-01 (9.32E-04)
4.08E-02 (5.18E-04)
0.8
4.43E-01 (5.30E-03)
6.27E-01 (7.15E-03)
4.46E-01 (3.97E-03)
6.35E-01 (1.26E-02)
1.31E-01 (6.95E-04)
3.75E-02 (1.60E-03)
(GNRT )
Table B.45: Static BER, Mean Delay (Figure 6.78) Offered Data Load
IEEE 802.11
RT-MAC
IEEE 802.11
RT-MAC
IEEE 802.11
RT-MAC
(1 × 10⁻⁵ )
(1 × 10⁻⁵ )
Bursty
Bursty
(1 × 10⁻³ )
(1 × 10⁻³ )
0
2.17E-02 (2.69E-04)
2.35E-02 (5.47E-05)
2.56E-02 (2.32E-03)
2.42E-02 (4.90E-04)
3.27E+01 (7.31E-01)
9.66E-02 (3.62E-04)
0.2
4.67E-02 (2.13E-02)
3.29E-02 (2.70E-03)
6.54E-02 (1.11E-02)
3.43E-02 (2.13E-03)
3.35E+01 (4.17E-01)
1.06E-01 (2.27E-03)
0.4
1.14E+01 (8.50E-01)
2.19E-01 (1.42E-02)
1.14E+01 (4.98E-01)
2.32E-01 (5.44E-02)
3.36E+01 (5.93E-01)
1.33E-01 (2.04E-03)
0.6
1.46E+01 (6.24E-01)
1.75E+00 (4.03E-01)
1.45E+01 (5.76E-01)
1.71E+00 (4.33E-01)
3.36E+01 (8.43E-01)
5.36E-01 (2.35E-01)
0.8
1.55E+01 (5.11E-01)
8.45E+00 (1.20E+00)
1.55E+01 (6.17E-01)
8.48E+00 (1.17E+00)
3.36E+01 (1.48E+00)
3.39E+00 (1.30E-01)
(GNRT )
Rusty O. Baldwin
Appendix B. Simulation Data Tables
305
Table B.46: Static BER, Missed Deadline Ratio (Figure 6.79) Offered Data Load
IEEE 802.11
RT-MAC
IEEE 802.11
RT-MAC
IEEE 802.11
RT-MAC
(1 × 10⁻⁵ )
(1 × 10⁻⁵ )
Bursty
Bursty
(1 × 10⁻³ )
(1 × 10⁻³ )
0
1.63E-04 (2.73E-05)
1.18E-05 (7.31E-06)
1.43E-02 (2.83E-04)
1.25E-02 (2.40E-04)
1.00E+00 (4.49E-05)
5.59E-01 (9.96E-04)
0.2
6.53E-02 (5.60E-04)
2.49E-03 (1.06E-04)
1.01E-01 (6.47E-04)
1.51E-02 (3.20E-04)
1.00E+00 (4.90E-06)
6.44E-01 (9.75E-04)
0.4
9.32E-01 (5.89E-04)
1.39E-01 (7.43E-04)
9.31E-01 (6.04E-04)
1.60E-01 (7.83E-04)
1.00E+00 (1.28E-05)
7.52E-01 (8.86E-04)
0.6
9.42E-01 (5.78E-04)
5.98E-01 (1.22E-03)
9.43E-01 (5.72E-04)
5.92E-01 (1.08E-03)
1.00E+00 (9.74E-06)
8.67E-01 (7.14E-04)
0.8
9.44E-01 (5.89E-04)
7.19E-01 (1.73E-03)
9.42E-01 (6.14E-04)
7.16E-01 (1.80E-03)
1.00E+00 (2.80E-06)
8.89E-01 (6.61E-04)
(GNRT )
Table B.47: Static BER, Collision Ratio (Figure 6.80) Offered Data Load
IEEE 802.11
RT-MAC
IEEE 802.11
RT-MAC
IEEE 802.11
RT-MAC
(1 × 10⁻⁵ )
(1 × 10⁻⁵ )
Bursty
Bursty
(1 × 10⁻³ )
(1 × 10⁻³ )
0
7.86E-03 (1.87E-04)
6.14E-03 (1.65E-04)
1.08E-02 (2.42E-04)
5.89E-03 (1.64E-04)
3.28E-02 (2.75E-04)
8.61E-03 (1.63E-04)
0.2
6.39E-02 (4.84E-04)
1.55E-02 (2.36E-04)
6.68E-02 (4.65E-04)
1.54E-02 (2.92E-04)
3.30E-02 (2.75E-04)
1.20E-02 (1.99E-04)
0.4
2.13E-01 (7.48E-04)
2.66E-02 (3.02E-04)
2.13E-01 (7.58E-04)
2.69E-02 (3.04E-04)
3.25E-02 (2.73E-04)
1.72E-02 (2.52E-04)
0.6
2.16E-01 (7.97E-04)
3.40E-02 (4.46E-04)
2.15E-01 (7.92E-04)
3.35E-02 (3.90E-04)
3.27E-02 (2.75E-04)
2.80E-02 (3.48E-04)
0.8
2.15E-01 (8.20E-04)
3.66E-02 (7.37E-04)
2.15E-01 (8.31E-04)
3.73E-02 (7.66E-04)
3.25E-02 (2.74E-04)
3.07E-02 (3.69E-04)
(GNRT )
Appendix C Statistical Comparison Method and Regression Tables This appendix contains a discussion of the statistical method used to compare the performance of IEEE 802.11 and RT-MAC. It also contains the output tables from SAS [SAS] obtained while developing the regression models.
C.1
Statistical Comparison for Unpaired Observations
The following explanation and Figure C.1 are due to [Jai91]. In order to determine the relative performance of two systems during this research, two methods are used. The first is a visual test of the means and confidence intervals (CIs) of two unpaired samples. From this test one can conclude either, (a) one system performs better than the other, (b) the systems performance is not different, or (c) the relative performance of the systems is indeterminate. These visual tests are shown graphically in Figure C.1. If the comparison shows that the CIs overlap but either mean is not contained in the CI of the other (case (c)), then the t-test must be performed to make the comparison. The t-test is the commonly used method to
306
Rusty O. Baldwin Appendix C. Statistical Comparison Method and Regression Tables 307
6 Mean
6
s Mean
B
s
6 s
s
Mean B
A
A
-
CIs do not overlap ⇒ B is higher than A (a)
s s
B
A
CIs overlap and mean of one is in the CI of the other ⇒ alternatives are not different
CIs overlap but mean of any one is not in the CI of the other ⇒ need to do t-test
(b)
(c)
Figure C.1: Visual Performance Comparison Tests compare the means of two different samples [All90]. Details on the mechanics of the t-test can be found in almost any statistics book. Conclusions that are made regarding system performance, unless explicitly noted, are based on the preceding statistical comparison method.
C.2
Glossary of SAS Output Table Terms
A glossary of abbreviations used in the following figures is provided in Table C.1. The explanation of statistical terms that follow are from [SAS85] and [Jai91]. It may be helpful to refer to Figure C.2 during the following paragraphs. The DF, degrees of freedom, statistic is the number of independent observations in the sample. The Sum of Squares is the sum of i samples minus the sample mean squared or Pn
i=1 (yi
− y)2 , where n is the degrees of freedom. The Mean Square is the Sum of Squares
divided by DF. The F Value is the ratio produced by dividing the Mean Square of the Model by the Mean Square of the Error. It is a measure of how well the model accounts
Rusty O. Baldwin Appendix C. Statistical Comparison Method and Regression Tables 308
Table C.1: Abbreviations used in Appendix C Abbreviation
Meaning
C.V.
Coefficient of variation
DF
Degrees of freedom
F
F value
MSE
Mean square error
PR
Significance probability
SS
Sum of Squares
S[1,2,3]
Number of stations (i.e., N 1 , N 2, N 3 )
L[1,2,3]
Offered Load (i.e., G1 , G2 , G3 )
C1
Channel Model: Ideal (C1 = 0) or Bursty (C1 = 1)
X*Y
Interaction of factor X and Y
for the dependent variables behavior. An F Value much greater than 1 indicates the model is assumed to explain a significant fraction of the variance. Conversely, an F Value of less than 1 indicates that the experimental error contributes more to the variance than does the model. A small significance probability, PR > F, indicates that some linear combination of the model parameters are significantly different from zero. The PR > |T| term is the probability of getting a larger value of t if the parameter is actually zero. A small value for this probability means that the independent variable contributes significantly to the model. The R-Square or R2 term measures how much variation of the samples is accounted for by the model. R2 , which varies from 0 to 1, is the ratio of the model Sum of Squares divided by the Corrected Total Sum of Squares. The larger the R2 value, the better the fit of the regression model. C.V. is the coefficient of variation. It is the sample standard deviation divided by the sample mean. It measures the amount of variation of the sample population with respect to the mean. Root MSE is the square root of the Mean Square of the Error. Mean is the mean of the dependent variable. Type III SS is the sum of squares that results when the variable (i.e., L1, L2, etc.) is added last to the model.
Rusty O. Baldwin Appendix C. Statistical Comparison Method and Regression Tables 309
C.3
SAS Output Tables
C.3.1
Telemetry Regression Model The SAS System
2 13:10 Monday, January 18, 1999
General Linear Models Procedure Dependent Variable: XPUT_STD
DF
Sum of Squares
Mean Square
4 235 239
0.07067380 0.00600338 0.07667718
0.01766845 0.00002555
R-Square 0.921706
C.V. 1.694505
Root MSE 0.005054
Source
DF
Type III SS
Mean Square
F Value
Pr > F
L1 L2 L2*S1 S1*L3
1 1 1 1
0.01434199 0.00797098 0.01385279 0.00704789
0.01434199 0.00797098 0.01385279 0.00704789
561.41 312.02 542.26 275.89
0.0001 0.0001 0.0001 0.0001
Source Model Error Corrected Total
F Value
Pr > F
691.62
0.0001
XPUT_STD Mean 0.298278
Estimate
T for H0: Parameter=0
Pr > |T|
Parameter
Std Error of Estimate
INTERCEPT L1 L2 L2*S1 S1*L3
0.2222851045 0.3047182332 -.2035693374 -.0061562848 0.0052916762
73.48 23.69 -17.66 -23.29 16.61
0.0001 0.0001 0.0001 0.0001 0.0001
0.00302500 0.01286050 0.01152446 0.00026437 0.00031859
Figure C.2: IEEE 802.11 Telemetry Throughput Regression GLM Results The SAS System 8 13:10 Monday, January 18, 1999 General Linear Models Procedure Dependent Variable: XPUT_ENH Sum of Mean Source DF Squares Square F Value Pr > F Model Error Corrected Total
Source L1 L2 L3 L1*S1 L1*S2 L1*S3
Parameter INTERCEPT L1 L2 L3 L1*S1 L1*S2 L1*S3
6 233 239
0.08023846 0.00793423 0.08817268
0.01337308 0.00003405
R-Square 0.910015
C.V. 1.897859
Root MSE 0.005835
DF 1 1 1 1 1 1
Type III SS 0.02175863 0.01688540 0.01343084 0.00121620 0.00227585 0.00246907
Mean Square 0.02175863 0.01688540 0.01343084 0.00121620 0.00227585 0.00246907
Estimate -0.040556542 1.795760590 -2.821170833 1.393958333 -0.003091120 0.000178233 -0.000002215
T for H0: Parameter=0 -3.35 25.28 -22.27 19.86 -5.98 8.18 -8.52
392.72
0.0001
XPUT_ENH Mean 0.307475 F Value 638.97 495.86 394.42 35.72 66.83 72.51
Pr > |T| 0.0009 0.0001 0.0001 0.0001 0.0001 0.0001 0.0001
Pr > F 0.0001 0.0001 0.0001 0.0001 0.0001 0.0001
Std Error of Estimate 0.01211420 0.07104067 0.12669167 0.07018956 0.00051723 0.00002180 0.00000026
Figure C.3: RT-MAC Telemetry Throughput Regression GLM Results
Rusty O. Baldwin Appendix C. Statistical Comparison Method and Regression Tables 310 The SAS System
13 13:10 Monday, January 18, 1999
General Linear Models Procedure Dependent Variable: TD_STD Source
DF
Sum of Squares
Mean Square
F Value
Pr > F
Model
7
3.34750704
0.47821529
6627.49
0.0001
Error
232
0.01674026
0.00007216
Corrected Total
239
3.36424730
R-Square
C.V.
Root MSE
TD_STD Mean
0.995024
0.822422
0.008494
1.032862
Source
DF
Type III SS
Mean Square
F Value
Pr > F
L1 L2 L3 L2*S1 L1*S1 L1*S2 L1*S3
1 1 1 1 1 1 1
0.31712396 0.21977839 0.16391160 0.02029706 0.03309829 0.00695957 0.00396429
0.31712396 0.21977839 0.16391160 0.02029706 0.03309829 0.00695957 0.00396429
4394.96 3045.87 2271.62 281.29 458.70 96.45 54.94
0.0001 0.0001 0.0001 0.0001 0.0001 0.0001 0.0001
Estimate
T for H0: Parameter=0
Pr > |T|
Parameter
Std Error of Estimate
INTERCEPT L1 L2 L3 L2*S1 L1*S1 L1*S2 L1*S3
-0.49896029 6.86623055 -10.18697581 4.86970867 -0.00500497 0.01681630 -0.00031168 0.00000281
-28.29 66.29 -55.19 47.66 -16.77 21.42 -9.82 7.41
0.0001 0.0001 0.0001 0.0001 0.0001 0.0001 0.0001 0.0001
0.01763426 0.10357166 0.18458222 0.10217278 0.00029842 0.00078517 0.00003174 0.00000038
Figure C.4: IEEE 802.11 Telemetry Mean Delay Regression GLM Results The SAS System
17 13:10 Monday, January 18, 1999
General Linear Models Procedure Dependent Variable: D_ENH Source
DF
Sum of Squares
Mean Square
F Value
Pr > F
Model
2
0.02888294
0.01444147
32185.40
0.0001
Error
237
0.00010634
0.00000045
Corrected Total
239
0.02898928
R-Square
C.V.
Root MSE
D_ENH Mean
0.996332
4.256099
0.000670
0.015739
Source
DF
Type III SS
Mean Square
F Value
Pr > F
S1 S1*L1
1 1
0.02381699 0.00715697
0.02381699 0.00715697
53080.43 15950.58
0.0001 0.0001
Estimate
T for H0: Parameter=0
Pr > |T|
Parameter
Std Error of Estimate
INTERCEPT S1 S1*L1
0.0003002479 0.0010804862 -.0008047914
3.64 230.39 -126.30
0.0003 0.0001 0.0001
0.00008241 0.00000469 0.00000637
Figure C.5: RT-MAC Telemetry Mean Delay Regression GLM Results
Rusty O. Baldwin Appendix C. Statistical Comparison Method and Regression Tables 311 The SAS System
22 13:10 Monday, January 18, 1999
General Linear Models Procedure Dependent Variable: F_STD Source
DF
Sum of Squares
Mean Square
F Value
Pr > F
Model
5
82.81440773
16.56288155
4045.92
0.0001
Error
234
0.95793137
0.00409372
Corrected Total
239
83.77233910
Source
R-Square
C.V.
Root MSE
F_STD Mean
0.988565
5.211435
0.063982
1.227727
DF
Type III SS
Mean Square
F Value
Pr > F
1 1 1 1 1
10.63817242 7.15039688 5.25554063 0.05830770 0.09427090
10.63817242 7.15039688 5.25554063 0.05830770 0.09427090
2598.65 1746.67 1283.80 14.24 23.03
0.0001 0.0001 0.0001 0.0002 0.0001
L1 L2 L3 S1 S3
Estimate
T for H0: Parameter=0
Pr > |T|
Parameter
Std Error of Estimate
INTERCEPT L1 L2 L3 S1 S3
-7.18626201 39.67010098 -58.05488232 27.57444844 -0.00262456 0.00000118
-53.95 50.98 -41.79 35.83 -3.77 4.80
0.0001 0.0001 0.0001 0.0001 0.0002 0.0001
0.13319989 0.77819612 1.38909819 0.76958644 0.00069543 0.00000025
Figure C.6: IEEE 802.11 Telemetry Missed Deadline Ratio Regression GLM Results The SAS System
26 13:10 Monday, January 18, 1999
General Linear Models Procedure Dependent Variable: F_ENH Source
DF
Sum of Squares
Mean Square
F Value
Pr > F
Model
2
12.83292638
6.41646319
23473.07
0.0001
Error
237
0.06478495
0.00027335
Corrected Total
239
12.89771133
Source L1 L2
R-Square
C.V.
Root MSE
F_ENH Mean
0.994977
4.810867
0.016533
0.343668
DF
Type III SS
Mean Square
F Value
Pr > F
1 1
1.03586946 0.25023662
1.03586946 0.25023662
3789.48 915.43
0.0001 0.0001
Estimate
T for H0: Parameter=0
Pr > |T|
Parameter
Std Error of Estimate
INTERCEPT L1 L2
-0.520974744 1.992694893 -0.807253280
-59.08 61.56 -30.26
0.0001 0.0001 0.0001
0.00881756 0.03237063 0.02668070
Figure C.7: RT-MAC Telemetry Missed Deadline Ratio Regression GLM Results
Rusty O. Baldwin Appendix C. Statistical Comparison Method and Regression Tables 312 The SAS System
31 13:10 Monday, January 18, 1999
General Linear Models Procedure Dependent Variable: C_STD Source
DF
Sum of Squares
Mean Square
F Value
Pr > F
Model
4
3.34141999
0.83535500
2648.97
0.0001
Error
235
0.07410748
0.00031535
Corrected Total
239
3.41552747
Source
R-Square
C.V.
Root MSE
C_STD Mean
0.978303
7.249707
0.017758
0.244950
DF
Type III SS
Mean Square
F Value
Pr > F
1 1 1 1
0.48863668 0.09857324 0.10272891 0.07331947
0.48863668 0.09857324 0.10272891 0.07331947
1549.50 312.58 325.76 232.50
0.0001 0.0001 0.0001 0.0001
S1 S2 L1 L2
Estimate
T for H0: Parameter=0
Pr > |T|
Parameter
Std Error of Estimate
INTERCEPT S1 S2 L1 L2
-.1837051097 0.0125729336 -.0001015490 0.6275302119 -.4369623820
-18.31 39.36 -17.68 18.05 -15.25
0.0001 0.0001 0.0001 0.0001 0.0001
0.01003573 0.00031940 0.00000574 0.03476845 0.02865705
Figure C.8: IEEE 802.11 Telemetry Collision Ratio Regression GLM Results The SAS System
36 13:10 Monday, January 18, 1999
General Linear Models Procedure Dependent Variable: C_ENH DF
Sum of Squares
Mean Square
F Value
Pr > F
Model
3
0.01353711
0.00451237
751.66
0.0001
Error
236
0.00141676
0.00000600
Source
Corrected Total
Source S1 S2 S3
239
0.01495386
R-Square
C.V.
Root MSE
C_ENH Mean
0.905258
7.174704
0.002450
0.034150
DF
Type III SS
Mean Square
F Value
Pr > F
1 1 1
0.00175609 0.00068420 0.00036410
0.00175609 0.00068420 0.00036410
292.53 113.97 60.65
0.0001 0.0001 0.0001
Estimate
T for H0: Parameter=0
Pr > |T|
Parameter
Std Error of Estimate
INTERCEPT S1 S2 S3
0.0098980589 0.0023783638 -.0000625751 0.0000005445
11.82 17.10 -10.68 7.79
0.0001 0.0001 0.0001 0.0001
0.00083739 0.00013906 0.00000586 0.00000007
Figure C.9: RT-MAC Telemetry Collision Ratio Regression GLM Results
Rusty O. Baldwin Appendix C. Statistical Comparison Method and Regression Tables 313
C.3.2
Avionics Traffic Model The SAS System
2 14:12 Monday, January 18, 1999
General Linear Models Procedure Dependent Variable: XPUT_STD DF
Sum of Squares
Mean Square
F Value
Pr > F
Model
3
5.46584182
1.82194727
10187.92
0.0001
Error
236
0.04220483
0.00017883
Source
Corrected Total
239
5.50804665
R-Square
C.V.
Root MSE
XPUT_STD Mean
0.992338
2.537001
0.013373
0.527114
Source
DF
Type III SS
Mean Square
F Value
Pr > F
L2 L3 L3*S1
1 1 1
1.90738080 1.14264581 0.26036808
1.90738080 1.14264581 0.26036808
10665.65 6389.42 1455.92
0.0001 0.0001 0.0001
Estimate
T for H0: Parameter=0
Pr > |T|
Parameter
Std Error of Estimate
INTERCEPT L2 L3 L3*S1
0.116252470 2.658142719 -2.087847466 -0.005072211
38.88 103.27 -79.93 -38.16
0.0001 0.0001 0.0001 0.0001
0.00299040 0.02573858 0.02611969 0.00013293
Figure C.10: IEEE 802.11 Avionics Throughput Regression GLM Results The SAS System
7 14:12 Monday, January 18, 1999
General Linear Models Procedure Dependent Variable: XPUT_ENH DF
Sum of Squares
Mean Square
F Value
Pr > F
Model
2
8.98056601
4.49028300
99999.99
0.0001
Error
237
0.00747447
0.00003154
Source
Corrected Total
Source L2 L3
239
8.98804048
R-Square
C.V.
Root MSE
XPUT_ENH Mean
0.999168
0.980445
0.005616
0.572786
DF
Type III SS
Mean Square
F Value
Pr > F
1 1
1.26537154 0.59734852
1.26537154 0.59734852
40122.32 18940.69
0.0001 0.0001
Estimate
T for H0: Parameter=0
Pr > |T|
Parameter
Std Error of Estimate
INTERCEPT L2 L3
0.143037012 2.165053458 -1.496478667
113.90 200.31 -137.63
0.0001 0.0001 0.0001
0.00125580 0.01080875 0.01087358
Figure C.11: RT-MAC Avionics Throughput Regression GLM Results
Rusty O. Baldwin Appendix C. Statistical Comparison Method and Regression Tables 314 The SAS System 13 14:12 Monday, January 18, 1999 General Linear Models Procedure Dependent Variable: TD_STD DF
Sum of Squares
Mean Square
F Value
Pr > F
Model
7
6.09878834
0.87125548
1233.44
0.0001
Error
232
0.16387553
0.00070636
Source
Corrected Total
Source L1 L2 L3 L1*S1 L2*S1 L3*S1 S1
Parameter INTERCEPT L1 L2 L3 L1*S1 L2*S1 L3*S1 S1
239
6.26266387
R-Square 0.973833
C.V. 2.835675
Root MSE 0.026577
DF 1 1 1 1 1 1 1
Type III SS 0.05622925 0.07305131 0.09840993 0.26487609 0.31344992 0.34496900 0.22056143
Mean Square 0.05622925 0.07305131 0.09840993 0.26487609 0.31344992 0.34496900 0.22056143
Estimate -0.04261292 5.49713332 -11.18440792 7.19188822 -0.39317508 0.76347104 -0.44373428 0.06123784
T for H0: Parameter=0 -0.41 8.92 -10.17 11.80 -19.36 21.07 -22.10 17.67
TD_STD Mean 0.937253
F Value 79.60 103.42 139.32 374.99 443.75 488.38 312.25
Pr > |T| 0.6857 0.0001 0.0001 0.0001 0.0001 0.0001 0.0001 0.0001
Pr > F 0.0001 0.0001 0.0001 0.0001 0.0001 0.0001 0.0001
Std Error of Estimate 0.10516196 0.61612408 1.09979582 0.60930750 0.02030382 0.03624278 0.02007918 0.00346552
Figure C.12: IEEE 802.11 Avionics Mean Delay Regression GLM Results The SAS System
18 14:12 Monday, January 18, 1999 General Linear Models Procedure Dependent Variable: D_ENH Source
DF
Sum of Squares
Mean Square
F Value
Pr > F
Model
4
0.50636755
0.12659189
6577.79
0.0001
Error
235
0.00452266
0.00001925
Corrected Total
239
0.51089021
R-Square 0.991147
C.V. 9.048490
Root MSE 0.004387
DF 1 1 1 1
Type III SS 0.00409056 0.00612351 0.01061700 0.00119283
Mean Square 0.00409056 0.00612351 0.01061700 0.00119283
Source L1 L2 L3 C1
Parameter INTERCEPT L1 L2 L3 C1
Estimate -0.103170719 0.777895521 -1.698923958 1.239364583 0.004458750
T for H0: Parameter=0 -11.32 14.58 -17.84 23.49 7.87
D_ENH Mean 0.048483
F Value 212.55 318.18 551.67 61.98
Pr > |T| 0.0001 0.0001 0.0001 0.0001 0.0001
Pr > F 0.0001 0.0001 0.0001 0.0001
Std Error of Estimate 0.00911157 0.05335717 0.09524378 0.05276684 0.00056635
Figure C.13: RT-MAC Avionics Mean Delay Regression GLM Results
Rusty O. Baldwin Appendix C. Statistical Comparison Method and Regression Tables 315 The SAS System
28 11:27 Tuesday, April 6, 1999
General Linear Models Procedure Dependent Variable: F_STDA Source
DF
Sum of Squares
Mean Square
F Value
Pr > F
Model
3
0.07929267
0.02643089
657.82
0.0001
Error
115
0.00462065
0.00004018
Corrected Total
118
0.08391333
R-Square
C.V.
Root MSE
F_STDA Mean
0.944935
16.38438
0.006339
0.038688
Source
DF
Type III SS
Mean Square
F Value
Pr > F
L3 L1*C1 C1*S1
1 1 1
0.00263943 0.02307750 0.00090321
0.00263943 0.02307750 0.00090321
65.69 574.36 22.48
0.0001 0.0001 0.0001
Estimate
T for H0: Parameter=0
Pr > |T|
Parameter
Std Error of Estimate
INTERCEPT L3 L1*C1 C1*S1
0.0079268455 0.1025261160 0.0996714804 0.0002369303
6.81 8.10 23.97 4.74
0.0001 0.0001 0.0001 0.0001
0.00116391 0.01264977 0.00415891 0.00004997
Figure C.14: IEEE 802.11 Avionics Missed Deadline Ratio Regression GLM Results, G ≤ 0.5 The SAS System
24 11:27 Tuesday, April 6, 1999 General Linear Models Procedure Dependent Variable: F_STD Source
DF
Sum of Squares
Mean Square
F Value
Pr > F
Model
5
67.92939587
13.58587917
1282.42
0.0001
Error
174
1.84335154
0.01059397
Corrected Total
179
69.77274741
R-Square 0.973581
C.V. 14.83460
Root MSE 0.102927
DF 1 1 1 1 1
Type III SS 3.93765417 7.02230889 4.85654594 5.70639346 6.09965023
Mean Square 3.93765417 7.02230889 4.85654594 5.70639346 6.09965023
Source L1 L3 L1*S1 S1*L2 L3*S1
Parameter INTERCEPT L1 L3 L1*S1 S1*L2 L3*S1
Estimate 4.29963097 -10.88781318 9.50727404 -0.41139045 1.28164250 -0.91630267
T for H0: Parameter=0 17.11 -19.28 25.75 -21.41 23.21 -24.00
F_STD Mean 0.693831
F Value 371.69 662.86 458.43 538.65 575.77
Pr > |T| 0.0001 0.0001 0.0001 0.0001 0.0001 0.0001
Pr > F 0.0001 0.0001 0.0001 0.0001 0.0001
Std Error of Estimate 0.25136064 0.56474362 0.36927126 0.01921409 0.05522243 0.03818704
Figure C.15: IEEE 802.11 Avionics Missed Deadline Ratio Regression GLM Results, G > 0.5
Rusty O. Baldwin Appendix C. Statistical Comparison Method and Regression Tables 316 The SAS System 28 14:12 Monday, January 18, 1999 General Linear Models Procedure Dependent Variable: F_ENH DF
Sum of Squares
Mean Square
F Value
Pr > F
Model
4
0.50714420
0.12678605
2432.43
0.0001
Error
235
0.01224894
0.00005212
Source
Corrected Total
Source L1 L2 L3 L2*S1
Parameter INTERCEPT L1 L2 L3 L2*S1
239
0.51939314
R-Square 0.976417
C.V. 23.14554
Root MSE 0.007220
DF 1 1 1 1
Type III SS 0.01030621 0.01507812 0.02264596 0.01091612
Mean Square 0.01030621 0.01507812 0.02264596 0.01091612
Estimate -0.179583347 1.234750942 -2.666048947 1.810062124 0.000861638
T for H0: Parameter=0 -11.98 14.06 -17.01 20.84 14.47
F_ENH Mean 0.031192
F Value 197.73 289.28 434.47 209.43
Pr > |T| 0.0001 0.0001 0.0001 0.0001 0.0001
Pr > F 0.0001 0.0001 0.0001 0.0001
Std Error of Estimate 0.01498772 0.08781022 0.15675084 0.08683872 0.00005954
Figure C.16: RT-MAC Avionics Missed Deadline Ratio Regression GLM Results The SAS System
34 14:12 Monday, January 18, 1999
General Linear Models Procedure Dependent Variable: C_STD DF
Sum of Squares
Mean Square
F Value
Pr > F
Model
5
11.90639479
2.38127896
1673.58
0.0001
Error
234
0.33294970
0.00142286
Source
Corrected Total
239
12.23934448
R-Square
C.V.
Root MSE
C_STD Mean
0.972797
13.44101
0.037721
0.280640
Source
DF
Type III SS
Mean Square
F Value
Pr > F
S1 L3 S1*L1 S1*L2 S1*L3
1 1 1 1 1
0.60865329 0.61345198 0.72252145 0.85484724 0.89791979
0.60865329 0.61345198 0.72252145 0.85484724 0.89791979
427.77 431.14 507.79 600.79 631.07
0.0001 0.0001 0.0001 0.0001 0.0001
Estimate
T for H0: Parameter=0
Pr > |T|
Parameter
Std Error of Estimate
INTERCEPT S1 L3 S1*L1 S1*L2 S1*L3
0.0335898764 0.0535273221 0.3573288897 -.3406941287 0.6614962939 -.3757964579
4.79 20.68 20.76 -22.53 24.51 -25.12
0.0001 0.0001 0.0001 0.0001 0.0001 0.0001
0.00701916 0.00258805 0.01720914 0.01511892 0.02698762 0.01495944
Figure C.17: IEEE 802.11 Avionics Collision Ratio Regression GLM Results
Rusty O. Baldwin Appendix C. Statistical Comparison Method and Regression Tables 317 The SAS System
39 14:12 Monday, January 18, 1999
General Linear Models Procedure Dependent Variable: C_ENH Source
DF
Sum of Squares
Mean Square
F Value
Pr > F
Model
4
0.02025802
0.00506451
2167.27
0.0001
Error
235
0.00054915
0.00000234
Corrected Total
239
0.02080717
Source S1 S3 L2 L3
R-Square
C.V.
Root MSE
C_ENH Mean
0.973608
15.60663
0.001529
0.009795
DF
Type III SS
Mean Square
F Value
Pr > F
1 1 1 1
0.00019736 0.00017813 0.00018609 0.00095879
0.00019736 0.00017813 0.00018609 0.00095879
84.46 76.23 79.63 410.30
0.0001 0.0001 0.0001 0.0001
Estimate
T for H0: Parameter=0
Pr > |T|
Parameter
Std Error of Estimate
INTERCEPT S1 S3 L2 L3
0.0002013095 0.0001526956 -.0000000515 -.0262552785 0.0599539347
0.48 9.19 -8.73 -8.92 20.26
0.6296 0.0001 0.0001 0.0001 0.0001
0.00041689 0.00001662 0.00000001 0.00294220 0.00295984
Figure C.18: RT-MAC Avionics Collision Ratio Regression GLM Results
Rusty O. Baldwin Appendix C. Statistical Comparison Method and Regression Tables 318
C.3.3
Voice with Non Real-time Traffic Model
C.3.3.1
1 Mbps Data Rate The SAS System
2 14:12 Monday, January 18, 1999 General Linear Models Procedure Dependent Variable: XPUT_STD Source DF Squares Square F Value Pr > F Model 6 4.65610463 0.77601744 1308.01 0.0001 Error 293 0.17383147 0.00059328 Corrected Total 299 4.82993610 R-Square 0.964010
C.V. 6.748327
Root MSE 0.024357
XPUT_STD Mean 0.360939
Source
DF
Type III SS
Mean Square
F Value
Pr > F
L1 L2 S1 S2 L1*S1 L2*S3
1 1 1 1 1 1
2.12745519 0.63673989 0.41281503 0.19918847 1.23776799 0.34124747
2.12745519 0.63673989 0.41281503 0.19918847 1.23776799 0.34124747
3585.91 1073.25 695.82 335.74 2086.31 575.19
0.0001 0.0001 0.0001 0.0001 0.0001 0.0001
Estimate
T for H0: Parameter=0
Pr > |T|
Parameter
Std Error of Estimate
INTERCEPT L1 L2 S1 S2 L1*S1 L2*S3
-0.069123778 1.647478201 -0.794481197 0.026937741 -0.000489423 -0.056975199 0.000033114
-7.68 59.88 -32.76 26.38 -18.32 -45.68 23.98
0.0001 0.0001 0.0001 0.0001 0.0001 0.0001 0.0001
0.00900171 0.02751185 0.02425119 0.00102121 0.00002671 0.00124737 0.00000138
Figure C.19: IEEE 802.11 Voice Throughput (1 Mbps) Regression GLM Results The SAS System 8 14:12 Monday, January 18, 1999 General Linear Models Procedure Dependent Variable: XPUT_ENH Source DF Squares Square F Value Pr > F Model 3 8.85440919 2.95146973 2529.66 0.0001 Error 296 0.34535710 0.00116675 Corrected Total 299 9.19976630 R-Square 0.962460
C.V. 7.187126
Root MSE 0.034158
XPUT_ENH Mean 0.475262
Source
DF
Type III SS
Mean Square
F Value
Pr > F
L1 S1 S1*L3
1 1 1
5.24658823 0.85066977 0.60933704
5.24658823 0.85066977 0.60933704
4496.77 729.10 522.25
0.0001 0.0001 0.0001
Estimate
T for H0: Parameter=0
Pr > |T|
Parameter
Std Error of Estimate
INTERCEPT L1 S1 S1*L3
0.0918203748 0.7907049484 0.0072707945 -.0207514195
14.34 67.06 27.00 -22.85
0.0001 0.0001 0.0001 0.0001
0.00640228 0.01179137 0.00026927 0.00090804
Figure C.20: RT-MAC Voice Throughput (1 Mbps) Regression GLM Results
Rusty O. Baldwin Appendix C. Statistical Comparison Method and Regression Tables 319 The SAS System
13 14:12 Monday, January 18, 1999
General Linear Models Procedure Dependent Variable: TD_STD Source
DF
Sum of Squares
Mean Square
F Value
Pr > F
Model
7
4.15283078
0.59326154
402.67
0.0001
Error
292
0.43020747
0.00147331
Corrected Total
299
4.58303825
R-Square
C.V.
Root MSE
TD_STD Mean
0.906131
3.751390
0.038384
1.023188
Source
DF
Type III SS
Mean Square
F Value
Pr > F
S3 L1 L2 L1*S1 L2*S1 L1*S2 S3*L3
1 1 1 1 1 1 1
0.62439980 0.10573315 0.19737502 0.61183500 0.36762827 0.60537168 0.24544717
0.62439980 0.10573315 0.19737502 0.61183500 0.36762827 0.60537168 0.24544717
423.81 71.77 133.97 415.28 249.52 410.89 166.60
0.0001 0.0001 0.0001 0.0001 0.0001 0.0001 0.0001
Estimate
T for H0: Parameter=0
Pr > |T|
Parameter
Std Error of Estimate
INTERCEPT S3 L1 L2 L1*S1 L2*S1 L1*S2 S3*L3
0.794079408 0.000009880 -0.571519084 1.003420189 0.143942777 -0.117288161 -0.003240158 0.000073089
125.53 20.59 -8.47 11.57 20.38 -15.80 -20.27 12.91
0.0001 0.0001 0.0001 0.0001 0.0001 0.0001 0.0001 0.0001
0.00632592 0.00000048 0.06746410 0.08669305 0.00706351 0.00742501 0.00015985 0.00000566
Figure C.21: IEEE 802.11 Voice Mean Delay (1 Mbps) Regression GLM Results The SAS System
18 14:12 Monday, January 18, 1999
General Linear Models Procedure Dependent Variable: TD_ENH Source
DF
Sum of Squares
Mean Square
F Value
Pr > F
Model
2
2.95817664
1.47908832
1804.42
0.0001
Error
297
0.24345145
0.00081970
Corrected Total
299
3.20162808
Source S1 L2
R-Square
C.V.
Root MSE
TD_ENH Mean
0.923960
3.034980
0.028630
0.943348
DF
Type III SS
Mean Square
F Value
Pr > F
1 1
0.17738534 2.78079130
0.17738534 2.78079130
216.40 3392.44
0.0001 0.0001
Estimate
T for H0: Parameter=0
Pr > |T|
Parameter
Std Error of Estimate
INTERCEPT S1 L2
0.7979032501 0.0027954127 0.4080129592
199.51 14.71 58.24
0.0001 0.0001 0.0001
0.00399934 0.00019003 0.00700515
Figure C.22: RT-MAC Voice Mean Delay (1 Mbps) Regression GLM Results
Rusty O. Baldwin Appendix C. Statistical Comparison Method and Regression Tables 320 The SAS System 33 08:13 Thursday, April 8, 1999 General Linear Models Procedure Dependent Variable: TF_STDA Sum of Mean Source DF Squares Square F Value Pr > F Model 7 41.66380304 5.95197186 499.49 0.0001 Error 112 1.33461185 0.01191618 Corrected Total 119 42.99841488
Source L1 S2 S3 L1*S1 S2*L3 S3*L3 C1
Parameter INTERCEPT L1 S2 S3 L1*S1 S2*L3 S3*L3 C1
R-Square 0.968961
C.V. 18.76416
Root MSE 0.109161
DF 1 1 1 1 1 1 1
Type III SS 0.52891452 0.25504071 1.19260835 1.45823477 2.86564990 3.65802155 0.22425160
Mean Square 0.52891452 0.25504071 1.19260835 1.45823477 2.86564990 3.65802155 0.22425160
Estimate 0.023516026 3.264021886 -0.001344791 0.000093813 -1.244461077 2.966175196 -0.067116804 0.086458391
T for H0: Parameter=0 0.71 6.66 -4.63 10.00 -11.06 15.51 -17.52 4.34
TF_STDA Mean 0.581754 F Value 44.39 21.40 100.08 122.37 240.48 306.98 18.82
Pr > |T| 0.4769 0.0001 0.0001 0.0001 0.0001 0.0001 0.0001 0.0001
Pr > F 0.0001 0.0001 0.0001 0.0001 0.0001 0.0001 0.0001
Std Error of Estimate 0.03294933 0.48992409 0.00029068 0.00000938 0.11249574 0.19127302 0.00383069 0.01993003
Figure C.23: IEEE 802.11 Voice Missed Deadline Ratio (1 Mbps) Regression GLM Results, G < 0.2 The SAS System 23 08:13 Thursday, April 8, 1999 General Linear Models Procedure Dependent Variable: TF_STD Sum of Mean Source DF Squares Square F Value Pr > F Model Error Corrected Total
Source L2 S1 S2 S3 S1*L1 S2*L1 S3*L1
Parameter INTERCEPT L2 S1 S2 S3 S1*L1 S2*L1 S3*L1
7 232 239
65.95100109 3.88807261 69.83907370
9.42157158 0.01675893
R-Square 0.944328
C.V. 12.21010
Root MSE 0.129456
DF 1 1 1 1 1 1 1
Type III SS 2.70202295 1.79089284 3.07775051 3.03021357 6.65684986 5.75109512 4.53158896
Mean Square 2.70202295 1.79089284 3.07775051 3.03021357 6.65684986 5.75109512 4.53158896
Estimate 0.191825695 -2.022363745 -0.255287236 0.023509626 -0.000469670 0.828369327 -0.055152958 0.000997917
T for H0: Parameter=0 2.63 -12.70 -10.34 13.55 -13.45 19.93 -18.52 16.44
562.18
0.0001
TF_STD Mean 1.060240 F Value 161.23 106.86 183.65 180.81 397.21 343.17 270.40
Pr > |T| 0.0091 0.0001 0.0001 0.0001 0.0001 0.0001 0.0001 0.0001
Pr > F 0.0001 0.0001 0.0001 0.0001 0.0001 0.0001 0.0001
Std Error of Estimate 0.07288338 0.15927145 0.02469548 0.00173481 0.00003493 0.04156357 0.00297726 0.00006069
Figure C.24: IEEE 802.11 Voice Missed Deadline Ratio (1 Mbps) Regression GLM Results, G ≥ 0.2
Rusty O. Baldwin Appendix C. Statistical Comparison Method and Regression Tables 321 The SAS System
38 08:13 Thursday, April 8, 1999
General Linear Models Procedure Dependent Variable: TF_ENHA DF
Sum of Squares
Mean Square
F Value
Pr > F
Model
3
5.77332692
1.92444231
809.75
0.0001
Error
116
0.27568463
0.00237659
Corrected Total
119
6.04901155
Source
Source S3 L2*S2 C1
R-Square
C.V.
Root MSE
TF_ENHA Mean
0.954425
21.42296
0.048750
0.227561
DF
Type III SS
Mean Square
F Value
Pr > F
1 1 1
1.76418044 0.93367576 0.10672614
1.76418044 0.93367576 0.10672614
742.32 392.86 44.91
0.0001 0.0001 0.0001
Estimate
T for H0: Parameter=0
Pr > |T|
Parameter
Std Error of Estimate
INTERCEPT S3 L2*S2 C1
-.0032342975 0.0000152214 0.0092482215 0.0596451017
-0.43 27.25 19.82 6.70
0.6704 0.0001 0.0001 0.0001
0.00758058 0.00000056 0.00046659 0.00890055
Figure C.25: RT-MAC Voice Missed Deadline Ratio (1 Mbps) Regression GLM Results, G < 0.2 The SAS System
28 08:13 Thursday, April 8, 1999
General Linear Models Procedure Dependent Variable: TF_ENH DF
Sum of Squares
Mean Square
F Value
Pr > F
Model
3
43.13026954
14.37675651
1281.05
0.0001
Error
236
2.64854481
0.01122265
Corrected Total
239
45.77881435
R-Square
C.V.
Root MSE
TF_ENH Mean
0.942145
16.70335
0.105937
0.634226
DF
Type III SS
Mean Square
F Value
Pr > F
1 1 1
7.33415279 12.57641121 6.07672914
7.33415279 12.57641121 6.07672914
653.51 1120.63 541.47
0.0001 0.0001 0.0001
Source
Source S2 L2*S1 S2*L3
Estimate
T for H0: Parameter=0
Pr > |T|
Parameter
Std Error of Estimate
INTERCEPT S2 L2*S1 S2*L3
-.0740655838 0.0006925052 0.1682941148 -.0055193144
-5.00 25.56 33.48 -23.27
0.0001 0.0001 0.0001 0.0001
0.01482774 0.00002709 0.00502734 0.00023719
Figure C.26: RT-MAC Voice Missed Deadline Ratio (1 Mbps) Regression GLM Results, G ≥ 0.2
Rusty O. Baldwin Appendix C. Statistical Comparison Method and Regression Tables 322 The SAS System
34 14:12 Monday, January 18, 1999
General Linear Models Procedure Dependent Variable: TC_STD Source
DF
Sum of Squares
Mean Square
F Value
Pr > F
Model
4
11.28182147
2.82045537
977.16
0.0001
Error
295
0.85147856
0.00288637
Corrected Total
299
12.13330003
R-Square
C.V.
Root MSE
TC_STD Mean
0.929823
13.33020
0.053725
0.403032
Source
DF
Type III SS
Mean Square
F Value
Pr > F
S2 L1*S1 S2*L1 S1*L2
1 1 1 1
3.65758967 3.05281423 2.27315537 0.35318059
3.65758967 3.05281423 2.27315537 0.35318059
1267.19 1057.67 787.55 122.36
0.0001 0.0001 0.0001 0.0001
Estimate
T for H0: Parameter=0
Pr > |T|
Parameter
Std Error of Estimate
INTERCEPT S2 L1*S1 S2*L1 S1*L2
0.0232201199 0.0006188754 0.0874724172 -.0022744447 -.0266956878
3.16 35.60 32.52 -28.06 -11.06
0.0017 0.0001 0.0001 0.0001 0.0001
0.00734041 0.00001739 0.00268966 0.00008105 0.00241334
Figure C.27: IEEE 802.11 Voice Collision Ratio (1 Mbps) Regression GLM Results The SAS System
39 14:12 Monday, January 18, 1999
General Linear Models Procedure Dependent Variable: TC_ENH DF
Sum of Squares
Mean Square
F Value
Pr > F
Model
4
0.69096570
0.17274142
1568.09
0.0001
Error
295
0.03249722
0.00011016
Source
Corrected Total
299
0.72346292
R-Square
C.V.
Root MSE
TC_ENH Mean
0.955081
7.319374
0.010496
0.143396
Source
DF
Type III SS
Mean Square
F Value
Pr > F
L1 S1 S2 L1*S2
1 1 1 1
0.26579228 0.13676015 0.03239127 0.04728170
0.26579228 0.13676015 0.03239127 0.04728170
2412.78 1241.47 294.04 429.21
0.0001 0.0001 0.0001 0.0001
Estimate
T for H0: Parameter=0
Pr > |T|
Parameter
Std Error of Estimate
INTERCEPT L1 S1 S2 L1*S2
-.0288647072 0.1645189097 0.0109560622 -.0001603244 -.0001462608
-10.77 49.12 35.23 -17.15 -20.72
0.0001 0.0001 0.0001 0.0001 0.0001
0.00267956 0.00334932 0.00031095 0.00000935 0.00000706
Figure C.28: RT-MAC Voice Collision Ratio (1 Mbps) Regression GLM Results
Rusty O. Baldwin Appendix C. Statistical Comparison Method and Regression Tables 323 C.3.3.2
10 Mbps Data Rate The SAS System 2 08:16 Monday, March 29, 1999 General Linear Models Procedure Dependent Variable: XPUT_STD DF
Sum of Squares
Mean Square
F Value
Pr > F
Model
5
4.61604762
0.92320952
1562.24
0.0001
Error
394
0.23283534
0.00059095
Source
Corrected Total
Source L1 L2 S2 L2*S1 S1*L3
Parameter INTERCEPT L1 L2 S2 L2*S1 S1*L3
399
4.84888296
R-Square 0.951982
C.V. 10.39458
Root MSE 0.024310
DF 1 1 1 1 1
Type III SS 1.92424441 0.75922727 0.11721108 0.68766351 0.46795187
Mean Square 1.92424441 0.75922727 0.11721108 0.68766351 0.46795187
Estimate 0.024168195 1.426298418 -1.114375722 0.000012804 -0.035761546 0.036139554
T for H0: Parameter=0 6.59 57.06 -35.84 14.08 -34.11 28.14
XPUT_STD Mean 0.233867
F Value 3256.17 1284.75 198.34 1163.65 791.86
Pr > |T| 0.0001 0.0001 0.0001 0.0001 0.0001 0.0001
Pr > F 0.0001 0.0001 0.0001 0.0001 0.0001
Std Error of Estimate 0.00366601 0.02499520 0.03109010 0.00000091 0.00104835 0.00128428
Figure C.29: IEEE 802.11 Voice Throughput (10 Mbps) Regression GLM Results The SAS System 8 08:16 Monday, March 29, 1999 General Linear Models Procedure Dependent Variable: XPUT_ENH DF
Sum of Squares
Mean Square
F Value
Pr > F
Model
4
7.54285192
1.88571298
4204.41
0.0001
Error
395
0.17716098
0.00044851
Source
Corrected Total
Source L1 L2 S2 L1*S1
Parameter INTERCEPT L1 L2 S2 L1*S1
399
7.72001289
R-Square 0.977052
C.V. 7.224668
Root MSE 0.021178
DF 1 1 1 1
Type III SS 3.77726815 1.37988700 0.19479747 0.59644986
Mean Square 3.77726815 1.37988700 0.19479747 0.59644986
Estimate 0.013244280 1.372295326 -0.877511384 0.000017298 -0.005696398
T for H0: Parameter=0 4.31 91.77 -55.47 20.84 -36.47
XPUT_ENH Mean 0.293135
F Value 8421.84 3076.61 434.32 1329.85
Pr > |T| 0.0001 0.0001 0.0001 0.0001 0.0001
Pr > F 0.0001 0.0001 0.0001 0.0001
Std Error of Estimate 0.00307336 0.01495354 0.01582036 0.00000083 0.00015621
Figure C.30: RT-MAC Voice Throughput (10 Mbps) Regression GLM Results
Rusty O. Baldwin Appendix C. Statistical Comparison Method and Regression Tables 324 The SAS System 24 13:38 Thursday, April 15, 1999 General Linear Models Procedure Dependent Variable: TD_STDL DF
Sum of Squares
Mean Square
F Value
Pr > F
Model
4
0.06028425
0.01507106
511.76
0.0001
Error
125
0.00368119
0.00002945
Source
Corrected Total
Source L3 C1*S1 L3*C1 S1*L1
Parameter INTERCEPT L3 C1*S1 L3*C1 S1*L1
129
0.06396543
R-Square 0.942450
C.V. 4.072793
Root MSE 0.005427
DF 1 1 1 1
Type III SS 0.03339535 0.00242392 0.00378083 0.01053865
Mean Square 0.03339535 0.00242392 0.00378083 0.01053865
Estimate 0.142230137 -9.264027721 0.000194612 2.357284475 0.005232188
T for H0: Parameter=0 183.45 -33.67 9.07 11.33 18.92
TD_STDL Mean 0.133244
F Value 1133.99 82.31 128.38 357.85
Pr > |T| 0.0001 0.0001 0.0001 0.0001 0.0001
Pr > F 0.0001 0.0001 0.0001 0.0001
Std Error of Estimate 0.00077529 0.27510337 0.00002145 0.20804501 0.00027659
Figure C.31: IEEE 802.11 Voice Mean Delay (10 Mbps) Regression GLM Results, G < 0.2; G = 0.2, N ≤ 50 The SAS System
29 13:38 Thursday, April 15, 1999 General Linear Models Procedure Dependent Variable: TD_ENHL Source
DF
Sum of Squares
Mean Square
F Value
Pr > F
Model
5
0.05253188
0.01050638
1363.40
0.0001
Error
154
0.00118672
0.00000771
Corrected Total
159
0.05371860
R-Square 0.977909
C.V. 0.337896
Root MSE 0.002776
DF 1 1 1 1 1
Type III SS 0.00893582 0.00050239 0.00265182 0.00188529 0.00214909
Mean Square 0.00893582 0.00050239 0.00265182 0.00188529 0.00214909
Source L2 S2 L2*S1 S2*L3 L3*S3
Parameter INTERCEPT L2 S2 L2*S1 S2*L3 L3*S3
Estimate 0.823805686 -1.887421136 0.000001186 0.090768448 -0.009602999 0.000075187
T for H0: Parameter=0 1693.32 -34.05 8.07 18.55 -15.64 16.70
TD_ENHL Mean 0.821545
F Value 1159.59 65.19 344.12 244.65 278.88
Pr > |T| 0.0001 0.0001 0.0001 0.0001 0.0001 0.0001
Pr > F 0.0001 0.0001 0.0001 0.0001 0.0001
Std Error of Estimate 0.00048650 0.05542634 0.00000015 0.00489302 0.00061395 0.00000450
Figure C.32: RT-MAC Voice Mean Delay (10 Mbps) Regression GLM Results, G < 0.2; G = 0.2, N < 40
Rusty O. Baldwin Appendix C. Statistical Comparison Method and Regression Tables 325 The SAS System 14 13:38 Thursday, April 15, 1999 General Linear Models Procedure Dependent Variable: TD_STDH DF
Sum of Squares
Mean Square
F Value
Pr > F
Model
7
145.7066421
20.8152346
507.74
0.0001
Error
282
11.5609204
0.0409962
Source
Corrected Total
Source S2 S3 L2 S1*L1 L2*S1 S3*L2 S3*L3
Parameter INTERCEPT S2 S3 L2 S1*L1 L2*S1 S3*L2 S3*L3
289
157.2675625
R-Square 0.926489
C.V. 13.22326
Root MSE 0.202475
DF 1 1 1 1 1 1 1
Type III SS 7.28562622 5.55841643 16.88844374 25.04588095 18.06859538 9.67455284 8.47668395
Mean Square 7.28562622 5.55841643 16.88844374 25.04588095 18.06859538 9.67455284 8.47668395
Estimate -1.124789470 -0.001092000 0.000010686 4.193011080 0.338463153 -0.344519765 -0.000054676 0.000060941
T for H0: Parameter=0 -14.11 -13.33 11.64 20.30 24.72 -20.99 -15.36 14.38
TD_STDH Mean 1.531205
F Value 177.71 135.58 411.95 610.93 440.74 235.99 206.77
Pr > |T| 0.0001 0.0001 0.0001 0.0001 0.0001 0.0001 0.0001 0.0001
Pr > F 0.0001 0.0001 0.0001 0.0001 0.0001 0.0001 0.0001
Std Error of Estimate 0.07970245 0.00008191 0.00000092 0.20658693 0.01369351 0.01641057 0.00000356 0.00000424
Figure C.33: IEEE 802.11 Voice Mean Delay (10 Mbps) Regression GLM Results, G = 0.2, N > 50; G ≥ 0.2 The SAS System 19 13:38 Thursday, April 15, 1999 General Linear Models Procedure Dependent Variable: TD_ENHH Sum of Mean Source DF Squares Square F Value Pr > F Model 6 175.1381198 29.1896866 702.49 0.0001 Error 313 13.0057283 0.0415518 Corrected Total 319 188.1438481
Source L1 L2 L3 L2*S1 L3*S2 L3*S3
Parameter INTERCEPT L1 L2 L3 L2*S1 L3*S2 L3*S3
R-Square 0.930873
C.V. 20.66264
Root MSE 0.203843
DF 1 1 1 1 1 1
Type III SS 4.97596537 5.21801147 4.29279756 11.75048187 7.25552078 4.13049991
Mean Square 4.97596537 5.21801147 4.29279756 11.75048187 7.25552078 4.13049991
Estimate 1.84724809 -15.84165319 36.05221916 -21.90612826 0.13189120 -0.00376083 0.00002355
T for H0: Parameter=0 9.76 -10.94 11.21 -10.16 16.82 -13.21 9.97
TD_ENHH Mean 0.986528
F Value 119.75 125.58 103.31 282.79 174.61 99.41
Pr > |T| 0.0001 0.0001 0.0001 0.0001 0.0001 0.0001 0.0001
Pr > F 0.0001 0.0001 0.0001 0.0001 0.0001 0.0001
Std Error of Estimate 0.18931051 1.44762807 3.21717479 2.15521495 0.00784302 0.00028461 0.00000236
Figure C.34: RT-MAC Voice Mean Delay (10 Mbps) Regression GLM Results, G = 0.2, N ≥ 40; G > 0.2
Rusty O. Baldwin Appendix C. Statistical Comparison Method and Regression Tables 326 The SAS System 24 08:16 Monday, March 29, 1999 General Linear Models Procedure Dependent Variable: TF_STD Sum of Mean Source DF Squares Square F Value Pr > F Model 6 108.1582440 18.0263740 791.59 0.0001 Error 393 8.9494935 0.0227722 Corrected Total 399 117.1077375 R-Square 0.923579
C.V. 23.62806
Root MSE 0.150905
TF_STD Mean 0.638668
Source
DF
Type III SS
Mean Square
F Value
Pr > F
L1*S1 L1*S3 S1*L2 S3*L2 S1*L3 S3*L3
1 1 1 1 1 1
1.35436861 4.11663744 4.39942804 4.43195730 4.79115434 3.85439363
1.35436861 4.11663744 4.39942804 4.43195730 4.79115434 3.85439363
59.47 180.77 193.19 194.62 210.39 169.26
0.0001 0.0001 0.0001 0.0001 0.0001 0.0001
Estimate
T for H0: Parameter=0
Pr > |T|
Parameter
Std Error of Estimate
INTERCEPT L1*S1 L1*S3 S1*L2 S3*L2 S1*L3 S3*L3
0.0158477265 -.0718517704 0.0000252442 0.4443964763 -.0000931867 -.3899073316 0.0000737375
1.10 -7.71 13.45 13.90 -13.95 -14.50 13.01
0.2702 0.0001 0.0001 0.0001 0.0001 0.0001 0.0001
0.01435391 0.00931691 0.00000188 0.03197242 0.00000668 0.02688093 0.00000567
Figure C.35: IEEE 802.11 Voice Missed Deadline Ratio (10 Mbps) Regression GLM Results The SAS System
30 08:16 Monday, March 29, 1999
General Linear Models Procedure Dependent Variable: TF_ENH Source
DF
Sum of Squares
Mean Square
F Value
Pr > F
Model
2
29.44906966
14.72453483
3162.31
0.0001
Error
397
1.84853490
0.00465626
Corrected Total
399
31.29760456
R-Square
C.V.
Root MSE
TF_ENH Mean
0.940937
28.94758
0.068237
0.235725
Source
DF
Type III SS
Mean Square
F Value
Pr > F
L2*S2 S2*L3
1 1
7.80881022 3.99487764
7.80881022 3.99487764
1677.06 857.96
0.0001 0.0001
Estimate
T for H0: Parameter=0
Pr > |T|
Parameter
Std Error of Estimate
INTERCEPT L2*S2 S2*L3
0.0194680530 0.0009202051 -.0008502653
4.39 40.95 -29.29
0.0001 0.0001 0.0001
0.00443166 0.00002247 0.00002903
Figure C.36: RT-MAC Voice Missed Deadline Ratio (10 Mbps) Regression GLM Results
Rusty O. Baldwin Appendix C. Statistical Comparison Method and Regression Tables 327 The SAS System 35 08:16 Monday, March 29, 1999 General Linear Models Procedure Dependent Variable: TC_STD DF
Sum of Squares
Mean Square
F Value
Pr > F
Model
6
27.07172141
4.51195357
1138.34
0.0001
Error
393
1.55770048
0.00396361
Source
Corrected Total
Source S2 L1*S3 L2*S1 S2*L2 S1*L3 S2*L3
Parameter INTERCEPT S2 L1*S3 L2*S1 S2*L2 S1*L3 S2*L3
399
28.62942189
R-Square 0.945591
C.V. 13.62426
Root MSE 0.062957
DF 1 1 1 1 1 1
Type III SS 0.33593742 2.38612686 5.09399218 3.21722771 3.26999161 2.26451093
Mean Square 0.33593742 2.38612686 5.09399218 3.21722771 3.26999161 2.26451093
Estimate 0.0339349510 0.0000231597 0.0000070285 0.2527400409 -.0042030215 -.2363340239 0.0035733362
T for H0: Parameter=0 4.37 9.21 24.54 35.85 -28.49 -28.72 23.90
TC_STD Mean 0.462096
F Value 84.76 602.01 1285.19 811.69 825.00 571.32
Pr > |T| 0.0001 0.0001 0.0001 0.0001 0.0001 0.0001 0.0001
Pr > F 0.0001 0.0001 0.0001 0.0001 0.0001 0.0001
Std Error of Estimate 0.00776966 0.00000252 0.00000029 0.00705002 0.00014753 0.00822808 0.00014950
Figure C.37: IEEE 802.11 Voice Collision Ratio (10 Mbps) Regression GLM Results The SAS System 41 08:16 Monday, March 29, 1999 General Linear Models Procedure Dependent Variable: TC_ENH DF
Sum of Squares
Mean Square
F Value
Pr > F
Model
4
4.48860186
1.12215047
3425.82
0.0001
Error
395
0.12938482
0.00032756
Source
Corrected Total
Source L1 L3 S1 L2*S3
Parameter INTERCEPT L1 L3 S1 L2*S3
399
4.61798668
R-Square 0.971982
C.V. 6.584050
Root MSE 0.018099
DF 1 1 1 1
Type III SS 1.53737155 0.12650930 0.70467855 0.12465898
Mean Square 1.53737155 0.12650930 0.70467855 0.12465898
Estimate 0.0075600054 0.5222033572 -.2248675541 0.0024502637 -.0000004074
T for H0: Parameter=0 2.50 68.51 -19.65 46.38 -19.51
TC_ENH Mean 0.274884
F Value 4693.45 386.22 2151.32 380.57
Pr > |T| 0.0128 0.0001 0.0001 0.0001 0.0001
Pr > F 0.0001 0.0001 0.0001 0.0001
Std Error of Estimate 0.00302277 0.00762243 0.01144218 0.00005283 0.00000002
Figure C.38: RT-MAC Voice Collision Ratio (10 Mbps) Regression GLM Results
Vita Rusty O. Baldwin Rusty O. Baldwin is a Major (select) in the U.S. Air Force. He earned his B.S. degree in Electrical Engineering (with honors) from New Mexico State University in 1987 and his M.S. degree in Computer Engineering from the Air Force Institute of Technology in 1992. His assignments in the Air Force include: Instructor of Software Engineering, Air Force Institute of Technology, Wright-Patterson AFB, OH, Chief Computer Support Branch, Wright Laboratory, Wright-Patterson AFB, OH, Project Officer, Defense Meteorological Satellite Program, Los Angeles AFB, CA, and Instrumentation Mechanic, Guidance Division, Holloman AFB, NM. His professional memberships include IEEE and Eta Kappa Nu. His research interests are computer communication protocols, software engineering, and wireless networking. His publications include: The future DMSP space systems, Tactical Applications of Space Systems (AGARD-CP-460), NATO Advisory Group for Aerospace Research and Development, Colorado Springs, CO, October 1989. Implementation of an IEEE 802.11 wireless LAN model using OPNET, OPNETWORK’98, May 1998. A real-time medium access control protocol for ad hoc wireless local area networks, Mobile Computing and Communications Review, April 1999. 328
Rusty O. Baldwin Appendix C. Statistical Comparison Method and Regression Tables 329 Real-time queueing theory: A tutorial presentation with an admission control application, Queuing Systems, To be published. Queueing network analysis: concepts, terminology, and methods, ACM Computing Surveys, Submitted for publication. Packetized voice transmission using RT-MAC, a wireless real-time medium access control protocol, IEEE Journal on Selected Areas in Communications special issue on Analysis and Synthesis of MAC Protocols, Submitted for publication.