Keywords: language processing, machine learning, cognitive impairment, MMSE. 1. Introduction .... trying to steal a cookie from a jar sitting on a high shelf. A girl stands ... loop is used to optimize the hyperparameters of the clas- sifiers (for ...
K.C. Fraser et al.: Improving the Sensitivity and Specificity of MCI Screening with Linguistic Information 19 ______________________________________________________________________________________________________
Improving the Sensitivity and Specificity of MCI Screening with Linguistic Information Kathleen C. Fraser1 , Kristina Lundholm Fors1 , Marie Eckerstr¨om2 , Charalambos Themistocleous1 , and Dimitrios Kokkinakis1 1
The Swedish Language Bank, Department of Swedish, University of Gothenburg, Gothenburg, Sweden 2 Institute of Neuroscience and Physiology, Sahlgrenska Academy, Gothenburg, Sweden {kathleen.fraser, kristina.lundholmfors, marie.eckerstrom, charalambos.themistocleous, dimitrios.kokkinakis}@.gu.se Abstract The Mini-Mental State Exam (MMSE) is a screening tool for cognitive impairment. It has been extensively validated and is widely used, but has been criticized as not being effective in detecting mild cognitive impairment (MCI). In this study, we examine the utility of augmenting MMSE scores with automatically extracted linguistic information from a narrative speech task to better differentiate between individuals with MCI and healthy controls in a Swedish population. We find that with the addition of just four linguistic features, the AUC score (measuring a trade-off between sensitivity and specificity) is improved from 0.68 to 0.87 in logistic regression classification. These preliminary results suggest that the accuracy of traditional screening tools may be improved through the addition of computerized language analysis. Keywords: language processing, machine learning, cognitive impairment, MMSE
1.
Introduction
Dementia, a gradual decline in cognitive function due to neurodegeneration, is a growing concern as the global population ages. Research suggests that identifying early signs of cognitive decline may lead to better outcomes for both individuals and their caregivers (Ashford et al., 2007). Mild cognitive impairment (MCI) describes an impairment which is characterized by a clinically observable deficit in at least one area of cognition, but it not severe enough to interfere with activities of daily living (Gauthier et al., 2006; Reisberg and Gauthier, 2008). Although not everyone who is diagnosed with MCI will go on to develop dementia in their lifetimes, MCI is sometimes considered to be a prodromal stage of dementia (Ritchie and Touchon, 2000). Therefore, identifying changes associated with MCI represents a promising step towards the early detection of dementia. Opinions differ on the value of population-wide screening for dementia; see for example Ashford et al. (2006), Solomon and Murphy (2005), and Calz`a et al. (2015). However, even in the absence of large-scale screening programs, it is still of critical importance for primary care practitioners to have sensitive and accurate screening instruments to help determine when to refer an individual for more specialized assessment. One widely-used cognitive screen is the Mini-Mental State Exam (MMSE) (Folstein et al., 1975). The MMSE contains 12 questions, covering areas such as language, recall, attention, and orientation to time and place, and takes roughly 10 minutes to administer. The test is scored out of 30, and various cut-offs have been proposed as indicating impairment. For example, Ciesielska et al. (2016) conducted a meta-analysis and found that a cut-off of 27/28 was most effective for identifying MCI, corresponding to a sensitivity of 0.66 and specificity of 0.73. Damian et al. (2011) found the optimal cut-off for detecting MCI in their dataset to also be 27/28 (sensitivity: 0.76, specificity: 0.75), while noting
that these metrics can be sensitive to the proportion of patients and controls in any given data set. Other studies have considered an “abnormal” score to be anything from 25 and below (Zadikoff et al., 2008) to 28 and below (Pendlebury et al., 2012). Since performance on the MMSE is influenced by educational level and cultural background, cutoffs are not necessarily transferable from one country to another (Palmqvist et al., 2013). For Swedish, a cutoff of 24 and lower has been proposed for cognitive impairment, with a score between 25 and 27 indicating possible cognitive impairment which should be further evaluated (Palmqvist et al., 2013). While a number of researchers have argued that MMSE is not the best screening instrument for MCI, it remains the most widely used short screening tool for providing an overall measure of cognitive impairment in clinical, research and community settings (Arevalo-Rodriguez et al., 2015). In this paper, we propose augmenting MMSE scores with additional information obtained from automated linguistic analysis, to improve the detection of MCI in a population of Swedish speakers. Our analysis currently relies on manual transcriptions, but we envision that a fully automated system incorporating speech recognition could provide a more detailed and accurate assessment of cognitive status, while requiring minimal extra effort on the part of the primary care physician.
2.
Related Work
A number of studies have reported that subtle changes in speech and language may occur at the earliest stages of cognitive decline (Snowdon et al., 1996; Garrard et al., 2004; Cuetos et al., 2007; Clark et al., 2009; Le et al., 2011; Ahmed et al., 2013). According to Laske et al. (2015), language analysis is one of the most promising state-ofthe-art diagnostic measures for MCI and Alzheimer’s disease. Since manual linguistic analysis can be expensive and time-consuming, there has been interest in developing
Proceedings of the LREC 2018 Workshop “Resources and ProcessIng of linguistic, para-linguistic and extra-linguistic Data from people with various forms of cognitive/psychiatric impairments (RaPID-2)”, Dimitrios Kokkinakis (ed.)
K.C. Fraser et al.: Improving the Sensitivity and Specificity of MCI Screening with Linguistic Information 20 ______________________________________________________________________________________________________
automated methods for language analysis of clinical samples, using natural language processing and machine learning (e.g. Garrard and Forsyth (2010), Jarrold et al. (2014), Rentoumi et al. (2014), Prud’hommeaux and Roark (2015), and Kav´e and Goral (2016), among others). Specifically with respect to MCI, Vincze et al. (2016) combined linguistic features extracted from patient narratives with demographic variables to achieve a classification accuracy of 0.69 using all features, and 0.75 using selected features (46 MCI, 36 controls). Asgari et al. (2017) reported an accuracy of 0.84 in distinguishing 14 MCI participants from 27 healthy controls, by extracting linguistic and psychological features from unstructured conversation. Combining linguistic features with neuropsychological test scores has been used in the past to improve MCI classification. Roark et al. (2011) reported a study in which 37 MCI participants and 37 controls were assessed on nine neuropsychological tasks and two speech samples from a story recall task. Better classification accuracy was achieved by combining the neuropsychological and language information than by using a single modality alone. Mueller et al. (2017) correlated 280 individuals’ performance on standardized neuropsychological tests with various language factors, such as grammatical complexity, fluency markers and other lexical information. Syntax was found to be weakly positively correlated with MMSE, while fluency and semantic features declined more rapidly in the MCI group than in the control group, over the course of the study period.
3. 3.1.
Methods
Participants and Data Acquisition
The participants were recruited from the Gothenburg MCI Study, a clinical-pathophysiologic longitudinal study investigating early and manifest phases of different dementia disorders in patients seeking medical care at a memory clinic (Wallin et al., 2016). The Gothenburg MCI Study is approved by the local ethical committee review board (reference number: L091–99, 1999; T479–11, 2011); while the currently described study is approved by the local ethical committee (decision 206–16, 2016). A total of 31 MCI patients and 36 healthy controls were included in the present study, according to detailed inclusion and exclusion criteria (Kokkinakis et al., 2017). One control participant was excluded from the current analysis because their MMSE score was not available. All participants were assessed by a registered nurse, who administered a number of cognitive tests, including the MMSE. If participants showed no signs of subjective or objective cognitive impairment, they were classified as healthy controls. Other participants were then categorized according to the Global Deterioration Scale following cognitive testing, and participants classified as stage 3 (MCI) were included in the current analysis. Participants classified at stage 2 (subjective cognitive impairment) were excluded. Note that the MMSE did form part of the classification procedure, which makes our analysis somewhat circular, but that other factors were also taken into account. Participant demographics are given in Table 1. There is no significant difference between the groups on age, level of
Age Education Sex (M/F) MMSE
HC (n = 35) 68.0 (7.3) 13.3 (3.4) 13/22 29.6 (0.6)
MCI (n = 31) 70.1 (5.6) 14.1 (3.6) 15/16 28.2 (1.4)
Sig. n.s. n.s. n.s. p < 0.01
Table 1: Demographic information. Age and education are measured in years; MMSE is scored out of 30.
education, or proportion of males and females. There is a significant difference on MMSE score, with MCI participants scoring lower, although we observe that on average, the MCI participants score in the normal range according to the cutoff proposed by Palmqvist et al. (2013). This supports the argument that MMSE is not the most sensitive screening tool for early cognitive impairment. For the narrative speech component, participants were instructed to describe what they could see in the “Cookie Theft” picture from the Boston Diagnostic Aphasia Examination (Goodglass et al., 1983). This image is widely used to elicit narrative speech. It shows a boy standing on a stool, trying to steal a cookie from a jar sitting on a high shelf. A girl stands nearby and a woman washes dishes, apparently unconcerned by both the children’s actions and the water which overflows onto her feet. Participants were told that they could talk for as long as they wanted and that they would not be interrupted. The narratives were audio-recorded and subsequently manually transcribed by experienced transcribers according to guidelines provided by the authors.
3.2.
Features
A total of 57 linguistic features were extracted from the Cookie Theft transcripts. A complete description of these features is given in Table 2. Part-of-speech (POS) tagging, lemmatization, and dependency parsing was done using the Sparv annotation tool for Swedish (Borin et al., 2016). The constituent parse features were extracted using the CASSSwe parser (Kokkinakis and Johansson Kokkinakis, 1999).
3.3.
Classification
We take a machine learning approach to classifying the groups. We consider three classifiers in this work: support vector machines (SVM), logistic regression (LR), and random forests (RF) (Pedregosa et al., 2011). In each classification experiment, we use a leave-one-out cross-validation framework, where a single participant narrative is held out for testing, and the classifiers are trained on the remaining 65 samples. The procedure is then repeated 66 times, and we report the average results over the folds. Within each fold, an inner 5-fold cross validation loop is used to optimize the hyperparameters of the classifiers (for SVM, we fix a linear kernel and optimize the complexity parameter C between 10−3 and 103 ; for LR we use ridge regularization and range C from 10−3 to 103 ; and for RF we fix the number of trees at 50 and optimize the maximum number of features to consider at each split to be √ either n or n, where n is the number of features, and the maximum depth of the trees to be 3, 4, 5, or unlimited).
Proceedings of the LREC 2018 Workshop “Resources and ProcessIng of linguistic, para-linguistic and extra-linguistic Data from people with various forms of cognitive/psychiatric impairments (RaPID-2)”, Dimitrios Kokkinakis (ed.)
K.C. Fraser et al.: Improving the Sensitivity and Specificity of MCI Screening with Linguistic Information 21 ______________________________________________________________________________________________________
Syntactic parse features
Dependency distance
Part-of-speech tags
Verb features
Psycholinguistic features
Vocabulary richness
Information units
Fluency features
Phrase type proportion and length (below) are derived from work on rating the fluency of machine translations (Chae and Nenkova, 2009). The phrase type proportion is the total number of words belonging to a given phrase type (here prepositional phrases, noun phrases, and verb groups), divided by the total number of words in the narrative. We additionally extend this feature to apply to clauses; namely main finite clauses, main infinitive clauses, and subordinate clauses, for a total of 6 distinct features. Phrase type length is the total number of words belonging to a given phrase or clause type, divided by the total number of occurrences of that phrase or clause type (6 features). Dependency distance is measured as the number of words between a given word and its dependency head, calculated for each word in the sentence. We compute average, maximum, and total dependency distance for each sentence, and then average these quantities over each sentence in the transcript (3 features). POS counts are computed for nouns, verbs, adjectives, adverbs, prepositions, determiners, and pronouns, and then normalized by dividing by the total number of words in the narrative (7 features). POS ratios are also computed in some cases; namely, the ratio of nouns to verbs, the ration of pronouns to nouns, and the ratio of function words to total words (3 features). Inflected verb count includes those verb forms with morphological inflection, divided by the total number of words (1 feature). Light verb count includes all mentions of verb tokens from the set {vara, ha, komma, g˚a, ge, ta, g¨ora, f˚a, flytta, l¨agga}, divided by the total number of words (1 feature). Frequency is estimated according to a word’s unlemmatized frequency in the modern Swedish section of the Korp corpus (Borin et al., 2012). It is averaged over all words together, and additionally for nouns and verbs separately (3 features). Familiarity is estimated from a paper survey of 42 native Swedish speakers, conducted at the Gothenburg Book Fair in October, 2017. The survey contained mostly words relating to the content of the Cookie Theft image, as well as control words for which familiarity ratings already ¨ existed (Blomberg and Oberg, 2015). Correlation with the previously collected familiarity norms was r = 0.80, p = 0.06. Familiarity is averaged over all words (1 feature). Imageability is estimated from a paper survey, as above. Correlation with the previously collected imageability norms was r = 0.98, p = 0.001. Imageability is averaged over all words (1 feature). Emotional valence is estimated from a paper survey, as above. Correlation with the previously collected valence norms was r = 0.95, p = 0.003. Valence is averaged over all words (1 feature). Type-token ratio (TTR) is calculated by dividing the number of unique word types by the total number of tokens in the narrative (1 feature). Honor´e’s statistic is calculated according to H = 100 ∗ log(N/(1 − V1 /V )), where N is the total number of words used (number of tokens), V is the size of the vocabulary (number of types), and V1 is the number of words used only once in the narrative (Honor´e, 1979) (1 feature). Content counts are computed for the 4 categories of information units listed in (Kav´e and Levy, 2003); namely, the three subjects, thirteen objects, two places, and seven actions. These counts are extracted using a keyword-spotting method with manual post-hoc inspection. The raw features are integer-valued with no upper bound (e.g. if the speaker mentions the boy five times, then the content count for subjects increases by five), and so the final features are normalized by the total number of words in the transcript. We also compute the total content count by summing the counts for the 4 categories (5 features). Information counts are computed for the 4 categories of information units listed above. These features are integer-valued, with an upper bound equal to the number of information units in each category (e.g. if the speaker mentions the boy five times, then the information count for subjects still only increases by one.) We also compute the total information count by summing the counts for the 4 categories (to a maximum of 25) (5 features). Content density and information density are computed by dividing the total content count and total information count by the total number of words in the narrative (2 features). Content efficiency and information efficiency are computed by dividing the total content count and total information count by the total time taken to produce the narrative (2 features). Total words is the total number of words produced (excluding filled pauses, unintelligible words, and false starts) (1 feature). Total time is the total time taken to produce the narrative (1 feature). Speech rate is measured in words per minute (total words divided by total time) (1 feature). Hesitancy counts are computed by counting the number of pauses, false starts, and incomplete sentences, each normalized by total number of words (3 features). Mean length of sentence (MLS) is the total number of words in the narrative divided by the number of sentences (1 feature). Mean length of word (MLW) is the average length of the words in the narrative, in letters (1 feature).
Table 2: Linguistic features extracted from the Cookie Theft transcripts. We first train the classifiers on MMSE alone. This is equivalent to letting the classifiers learn the optimal threshold on the MMSE to separate the two groups. We then consider the effect of adding a single linguistic feature, then two linguistic features, and so on until the entire set of 57 linguistic features has been added to the classification. The order in which features are added to the classifiers is obviously important. One possibility is to simply rank the features by computing a t-test on the training data and choosing the features which best differentiate the groups. However, initial experiments found that this could result in correlated features being selected, which had a negative
effect on classifier performance. Instead, we use a wrapper method of feature selection, which selects the features based on the model itself, through recursive feature elimination (Guyon et al., 2002). In the feature selection stage, default parameter values are used, except that we again specify the linear kernel for SVM, ridge regularization for LR, and 50 trees for RF. The downside to this method is that the different models may select different features, making interpretation more difficult. The most-commonly selected features will be discussed in Section 4.2. For evaluation, we consider accuracy, sensitivity, specificity, and the area under the curve (AUC) of the receiver
Proceedings of the LREC 2018 Workshop “Resources and ProcessIng of linguistic, para-linguistic and extra-linguistic Data from people with various forms of cognitive/psychiatric impairments (RaPID-2)”, Dimitrios Kokkinakis (ed.)
K.C. Fraser et al.: Improving the Sensitivity and Specificity of MCI Screening with Linguistic Information 22 ______________________________________________________________________________________________________
operating characteristic (ROC) curve. Accuracy, sensitivity, and specificity are computed as follows, where we consider MCI to be the positive class, and TP indicates a true positive, FP indicates a false positive, TN indicates a true negative, and FN indicates a false negative: Accuracy =
TP + TN TP + FP + TN + FN
Sensitivity =
TP TP + FN
Specificity =
TN TN + FP
Sensitivity and specificity are particularly relevant in a healthcare context: a test which is highly sensitive means that not many people who actually do have the disease are missed, while a test which is highly specific means that not many people who do not have the disease are falsely indicated as having the disease. The AUC is calculated by plotting sensitivity (also known as the true positive rate) against 1 − specificity (also known as the false positive rate), as the decision threshold of the classifier is varied. The AUC is the area under the resulting curve. Random performance leads to an AUC of 0.5, and represents a straight line from (0, 0) to (1, 1).
4. 4.1.
Results
Classification
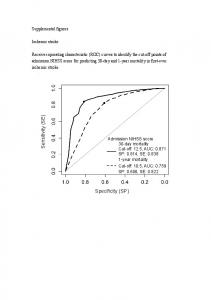
Figure 1 shows the sensitivity, specificity, AUC, and accuracy for each classifier as the number of linguistic features is increased from zero (MMSE score only) to 57. Looking first at Figure 1a, we see that using MMSE only, the SVM classifier has a high sensitivity of 0.81, while the LR and RF classifiers have a lower sensitivity. These results correspond to selecting a MMSE threshold of 29 (SVM) versus 28 (LR and RF). In the latter cases, the sensitivity is improved by adding language features, to maximum values of 0.77 for LR and 0.74 for RF. The SVM sensitivity is never as high as using MMSE alone, but reaches 0.77 with three linguistic features. When we examine specificity, in Figure 1b, we see the expected trade-off between sensitivity and specificity. Using MMSE scores alone, LR and RF have specificity of 0.94 (i.e. by using a threshold of 28, very few control participants are misclassified as having MCI). The SVM classifier has a specificity of only 0.63, which can be improved to 0.80 by including only one linguistic feature. The AUC score, shown in Figure 1c, balances the trade-off between sensitivity and specificity. For all three classifiers, performance is boosted by adding linguistic features, but all achieve maximum AUC by including only a few additional features: the SVM classifier has AUC = 0.84 with three language features, RF has AUC = 0.81 with two language features, and LR achieves the best AUC of 0.87, with four language features. Accuracy, shown in Figure 1d, presents a similar pattern. The AUC can also be represented visually by plotting the ROC curve, as seen in Figure 2. The black points indicate the values that are achieved by simply thresholding the
MMSE scores at different cutoffs, and classifying participants on that basis alone. For the purposes of illustration, we plot the ROC curves for only the best-performing configurations for each of the three classifiers. For low threshold values, the RF curve (green) lies below the black curve, indicating a higher number of false positives, but the RF classifier performs quite well at the higher threshold values. In contrast, the SVM curve (orange) lies mostly above the black curve for low threshold values, but has a lower true positive rate at high threshold values, even dipping below random performance at the far end of the range. The LR curve (blue) generally lies at or above the curve obtained using MMSE thresholds alone, indicating the improved performance at all threshold values for this classifier.
4.2.
Important Features
We now consider the question of which linguistic features were the most helpful to the classifiers in improving the classification results. Rather than trying to compare classifier-specific values such as coefficients (LR or SVM) or feature importances (RF), we use the rankings produced in the feature selection stage as a measure of feature relevance. Table 3 shows the mean rank across folds for each feature, for each classifier. A higher rank generally indicates that the feature is more important in the model, while a greater standard deviation suggests a feature which may not generalize well (if it is highly ranked in some folds but not others, then it is apparently quite sensitive to the exact training set, which can lead to overfitting). Since all three classifiers reach their maximum performance with the addition of five or fewer linguistic features, we consider here only the top five ranked features. We observe that the number of times the speaker mentions an information unit from the place category is ranked first for the LR classifier and second for both SVM and RF. Interestingly, this feature has a higher mean value in the MCI data than in the HC data (MCI: 0.018, HC: 0.013, uncorrected p = 0.01). This is in contrast to the findings of Croisile et al. (1996), who observed that healthy controls were more likely to name both of the relevant places (the kitchen and the exterior) than patients with Alzheimer’s disease. Here, the effect may be driven more by the MCI participants making repeated references to the two locations, as on average both HC and MCI participants mention the kitchen and the exterior at least once. In the RF classifier, the number of times the speaker mentions an action information unit is also highly ranked, although here the difference between groups is even smaller. Another highly ranked set of features is the proportion of main finite clauses (lower in the MCI group), the proportion of main nonfinite clauses (higher in the MCI group), and the proportion of subordinate clauses (lower in the MCI group). Previous findings regarding changes in syntactic complexity due to mild cognitive decline are mixed; the results on our data set are discussed in more detail by Lundholm Fors et al. (2018), but require further investigation. The remaining highly ranked features involve the count for nouns, the noun:verb ratio, word frequency, and verb frequency in particular. Our data show that the number of
Proceedings of the LREC 2018 Workshop “Resources and ProcessIng of linguistic, para-linguistic and extra-linguistic Data from people with various forms of cognitive/psychiatric impairments (RaPID-2)”, Dimitrios Kokkinakis (ed.)
K.C. Fraser et al.: Improving the Sensitivity and Specificity of MCI Screening with Linguistic Information 23 ______________________________________________________________________________________________________
(a) Sensitivity
(b) Specificity
(c) AUC
(d) Accuracy
Figure 1: Effect on MCI-vs-HC classification results of supplementing MMSE information with linguistic features.
Figure 2: ROC curves. The values corresponding to thresholding the MMSE scores manually are shown in black (e.g. T = 28 indicates a split between 28/29) . The coloured curves represent the performance obtained by varying the decision threshold from 0.0 to 1.0, for the best configuration for each of the three classifiers. Proceedings of the LREC 2018 Workshop “Resources and ProcessIng of linguistic, para-linguistic and extra-linguistic Data from people with various forms of cognitive/psychiatric impairments (RaPID-2)”, Dimitrios Kokkinakis (ed.)
K.C. Fraser et al.: Improving the Sensitivity and Specificity of MCI Screening with Linguistic Information 24 ______________________________________________________________________________________________________
LR Feature content count: places MAIN-FIN proportion SUB proportion verb frequency noun count
Rank 1.3 (0.3) 2.2 (0.5) 3.2 (0.5) 5.0 (4.0) 7.0 (6.9)
RF Feature noun count content count: places MAIN-INF proportion noun:verb ratio frequency
SVM Feature MAIN-FIN proportion content count: places SUB proportion noun:verb ratio content count: actions
Rank 1.9 (2.1) 2.2 (0.9) 4.1 (1.3) 5.7 (4.9) 9.1 (3.6)
Rank 1.5 (0.8) 2.4 (1.0) 2.7 (1.1) 10.0 (7.5) 10.2 (7.7)
Table 3: The average ranking of the top five features across folds, for each classifier. Standard deviations are given in parentheses. nouns is reduced in the MCI group, while there is a corresponding (but very small) increase in the number of verbs. As a result, the noun:verb ratio is slightly higher in the HC group than in the MCI group (HC: 1.07, MCI: 0.95, uncorrected p = 0.08). This pattern is consistent with the neurophysiology of Alzheimer’s disease, in that areas connected with noun processing tend to be affected in the earliest stages of the disease (Vigliocco et al., 2011). Participants with MCI also tended to use higher-frequency verbs, and higher-frequency words in general. However, we note that of these features, only the proportion of main clauses with nonfinite verbs, the proportion of main clauses with finite verbs, and the content count for places varied significantly between the groups before correcting for multiple comparisons, and no differences were significant after Bonferroni correction.
5.
Conclusions and Future Work
In this study, we examined the utility of adding automated language analysis to improve MCI classification, relative to using MMSE scores alone. The results were positive, showing that all three classifiers could improve AUC by including a few language features. The best result was achieved using logistic regression, which improved from AUC = 0.68 using MMSE alone to 0.87 by allowing the classifier to include four language features in addition to the MMSE score. However, none of the features showed a significant difference between groups, and many features reported to be relevant by previous studies were not found to be so here. We attribute this mainly to the high level of cognitive function in our MCI group, and the small sample size, which together mean we lack the statistical power needed to uncover very small differences between the groups. We also consider the possibility that the Cookie Theft task is not particularly difficult for highly-educated, professional individuals at a very early stage of cognitive decline. In our next round of data collection, we plan to include language tasks which also incorporate aspects of memory and attention, and which elicit dialogue as opposed to just monologue. We expect that these additional tasks may offer a broader assessment of the speaker’s cognitive status. Nonetheless, we consider this a promising result that can offer additional diagnostic value, and a step towards improving the accuracy of screening tools by augmenting traditional methods with computer technology.
6.
Acknowledgements
This work has received support from Riksbankens Jubileumsfond – The Swedish Foundation for Humanities & Social Sciences, through the grant agreement no: NHS 141761:1.
7.
Bibliographical References
Ahmed, S., Haigh, A.-M. F., de Jager, C. A., and Garrard, P. (2013). Connected speech as a marker of disease progression in autopsy-proven Alzheimer’s disease. Brain, 136(12):3727–3737. Arevalo-Rodriguez, I., Smailagic, N., i Figuls, M. R., Ciapponi, A., Sanchez-Perez, E., Giannakou, A., Pedraza, O. L., Cosp, X. B., and Cullum, S. (2015). Minimental state examination (MMSE) for the detection of alzheimer’s disease and other dementias in people with mild cognitive impairment (MCI). BJPsych Advances, 21(6):362–362. Asgari, M., Kaye, J., and Dodge, H. (2017). Predicting mild cognitive impairment from spontaneous spoken utterances. Alzheimer’s & Dementia: Translational Research & Clinical Interventions, 3(2):219–228. Ashford, J. W., Borson, S., O’Hara, R., Dash, P., Frank, L., Robert, P., Shankle, W. R., Tierney, M. C., Brodaty, H., Schmitt, F. A., Kraemer, H. C., and Buschke, H. (2006). Should older adults be screened for dementia? Alzheimer’s & Dementia, 2(2):76–85. Ashford, J. W., Borson, S., O’Hara, R., Dash, P., Frank, L., Robert, P., Shankle, W. R., Tierney, M. C., Brodaty, H., Schmitt, F. A., et al. (2007). Should older adults be screened for dementia? It is important to screen for evidence of dementia! Alzheimer’s & Dementia: the Journal of the Alzheimer’s Association, 3(2):75–80. ¨ Blomberg, F. and Oberg, C. (2015). Swedish and English word ratings of imageability, familiarity and age of acquisition are highly correlated. Nordic Journal of Linguistics, 38(3):351–364. Borin, L., Forsberg, M., and Roxendal, J. (2012). Korp - the corpus infrastructure of Spr˚akbanken. In Proceedings of the Eighth International Conference on Language Resources and Evaluation (LREC), pages 474–478. Borin, L., Forsberg, M., Hammarstedt, M., Rosen, D., Sch¨afer, R., and Schumacher, A. (2016). Sparv: Spr˚akbanken’s corpus annotation pipeline infrastructure. In The Sixth Swedish Language Technology Conference (SLTC), Ume˚a University, 17-18 November. Calz`a, L., Beltrami, D., Gagliardi, G., Ghidoni, E., Marcello, N., Rossini-Favretti, R., and Tamburini, F. (2015).
Proceedings of the LREC 2018 Workshop “Resources and ProcessIng of linguistic, para-linguistic and extra-linguistic Data from people with various forms of cognitive/psychiatric impairments (RaPID-2)”, Dimitrios Kokkinakis (ed.)
K.C. Fraser et al.: Improving the Sensitivity and Specificity of MCI Screening with Linguistic Information 25 ______________________________________________________________________________________________________
Should we screen for cognitive decline and dementia? Maturitas, 82(1):28–35. Chae, J. and Nenkova, A. (2009). Predicting the fluency of text with shallow structural features: Case studies of machine translation and human-written text. In 12th EACL, pages 139–147. Ciesielska, N., Sokolowski, R., Mazur, E., Podhorecka, M., Polak-Szabela, A., and Kedziora-Kornatowska, K. (2016). Is the Montreal Cognitive Assessment (MoCA) test better suited than the Mini-Mental State Examination (MMSE) in mild cognitive impairment (MCI) detection among people aged over 60? Psychiatria Polska, 50(5):1039–1052. Clark, L. J., Gatz, M., Zheng, L., Chen, Y.-L., McCleary, C., and Mack, W. J. (2009). Longitudinal verbal fluency in normal aging, preclinical, and prevalent Alzheimer’s disease. American Journal of Alzheimer’s Disease & Other Dementias, 24(6):461–468. Croisile, B., Ska, B., Brabant, M.-J., Duchene, A., Lepage, Y., Aimard, G., and Trillet, M. (1996). Comparative study of oral and written picture description in patients with Alzheimer’s disease. Brain and Language, 53(1):1–19. Cuetos, F., Arango-Lasprilla, J. C., Uribe, C., Valencia, C., and Lopera, F. (2007). Linguistic changes in verbal expression: A preclinical marker of Alzheimer’s disease. Journal of the International Neuropsychological Society, 13(3):433–439. Damian, A. M., Jacobson, S. A., Hentz, J. G., Belden, C. M., Shill, H. A., Sabbagh, M. N., Caviness, J. N., and Adler, C. H. (2011). The Montreal Cognitive Assessment and the Mini-Mental State Examination as screening instruments for cognitive impairment: item analyses and threshold scores. Dementia and Geriatric Cognitive Disorders, 31(2):126–131. Folstein, M. F., Folstein, S. E., and McHugh, P. R. (1975). ”Mini-mental state”. A practical method for grading the cognitive state of patients for the clinician. Journal of Psychiatric Research, 12(3):189–198. Garrard, P. and Forsyth, R. (2010). Abnormal discourse in semantic dementia: A data-driven approach. Neurocase, 16(6):520–528. Garrard, P., Maloney, L. M., Hodges, J. R., and Patterson, K. (2004). The effects of very early Alzheimer’s disease on the characteristics of writing by a renowned author. Brain, 128(2):250–260. Gauthier, S., Reisberg, B., Zaudig, M., Petersen, R. C., Ritchie, K., Broich, K., Belleville, S., Brodaty, H., Bennett, D., Chertkow, H., et al. (2006). Mild cognitive impairment. The Lancet, 367(9518):1262–1270. Goodglass, P., Barresi, B., and Kaplan, E. (1983). Boston Diagnostic Aphasia Examination. Philadelphia: Lippincott Williams and Willkins. A Wolters Kluwer Company. Guyon, I., Weston, J., Barnhill, S., and Vapnik, V. (2002). Gene selection for cancer classification using support vector machines. Machine Learning, 46(1-3):389–422. Honor´e, A. (1979). Some simple measures of richness of vocabulary. Association for Literary and Linguistic Computing Bulletin, 7(2):172–177.
Jarrold, W., Peintner, B., Wilkins, D., Vergryi, D., Richey, C., Gorno-Tempini, M. L., and Ogar, J. (2014). Aided diagnosis of dementia type through computer-based analysis of spontaneous speech. In Proceedings of the ACL Workshop on Computational Linguistics and Clinical Psychology, pages 27–36. Kav´e, G. and Goral, M. (2016). Word retrieval in picture descriptions produced by individuals with Alzheimer’s disease. Journal of Clinical and Experimental Neuropsychology, 38(9):958–966. Kav´e, G. and Levy, Y. (2003). Morphology in picture descriptions provided by persons with Alzheimer’s disease. Speech, Language, and Hearing Research, 46(2):341– 352. Kokkinakis, D. and Johansson Kokkinakis, S. (1999). A cascaded finite-state parser for syntactic analysis of swedish. In Proceedings of the 9th EACL, pages 245– 248, Oslo, Norway. Kokkinakis, D., Lundholm Fors, K., Bj¨orkner, E., and Nordlund, A. (2017). Data collection from persons with mild forms of cognitive impairment and healthy controls—infrastructure for classification and prediction of dementia. In Proceedings of the 21st Nordic Conference on Computational Linguistics, NoDaLiDa, 2224 May 2017, Gothenburg, Sweden, number 131, pages 172–182. Link¨oping University Electronic Press. Laske, C., Sohrabi, H. R., Frost, S. M., L´opez-de Ipi˜na, K., Garrard, P., Buscema, M., Dauwels, J., Soekadar, S. R., Mueller, S., Linnemann, C., et al. (2015). Innovative diagnostic tools for early detection of Alzheimer’s disease. Alzheimer’s & Dementia, 11(5):561–578. Le, X., Lancashire, I., Hirst, G., and Jokel, R. (2011). Longitudinal detection of dementia through lexical and syntactic changes in writing: A case study of three British novelists. Literary and Linguistic Computing, 26(4):435–461. Lundholm Fors, K., Fraser, K. C., and Kokkinakis, D. (2018). Automated syntactic analysis of language abilities in persons with mild and subjective cognitive impairment. In Proceedings of the Medical Informatics Europe (MIE) Conference. Mueller, K., Koscik, R., Hermann, B., Johnson, S., and Turkstra, L. (2017). Declines in connected language are associated with very early mild cognitive impairment: Results from the Wisconsin Registry for Alzheimer’s Prevention. Frontiers in Aging Neuroscience, 9(437):1– 14. Palmqvist, S., Terzis, B., Strobel, C., and Wallin, A. (2013). MMSE-SR: Mini Mental State Examination Svensk Revidering. Pedregosa, F., Varoquaux, G., Gramfort, A., Michel, V., Thirion, B., Grisel, O., Blondel, M., Prettenhofer, P., Weiss, R., Dubourg, V., Vanderplas, J., Passos, A., Cournapeau, D., Brucher, M., Perrot, M., and Duchesnay, E. (2011). Scikit-learn: Machine learning in Python. Journal of Machine Learning Research, 12:2825–2830. Pendlebury, S. T., Mariz, J., Bull, L., Mehta, Z., and Rothwell, P. M. (2012). MoCA, ACE-R, and MMSE versus the National Institute of Neurological Disorders
Proceedings of the LREC 2018 Workshop “Resources and ProcessIng of linguistic, para-linguistic and extra-linguistic Data from people with various forms of cognitive/psychiatric impairments (RaPID-2)”, Dimitrios Kokkinakis (ed.)
K.C. Fraser et al.: Improving the Sensitivity and Specificity of MCI Screening with Linguistic Information 26 ______________________________________________________________________________________________________
and Stroke–Canadian Stroke Network vascular cognitive impairment harmonization standards neuropsychological battery after TIA and stroke. Stroke, 43(2):464–469. Prud’hommeaux, E. and Roark, B. (2015). Graph-based word alignment for clinical language evaluation. Computational Linguistics, 41(4):549–578. Reisberg, B. and Gauthier, S. (2008). Current evidence for subjective cognitive impairment (SCI) as the premild cognitive impairment (MCI) stage of subsequently manifest Alzheimer’s disease. International Psychogeriatrics, 20(1):1–16. Rentoumi, V., Raoufian, L., Ahmed, S., de Jager, C. A., and Garrard, P. (2014). Features and machine learning classification of connected speech samples from patients with autopsy proven Alzheimer’s disease with and without additional vascular pathology. Journal of Alzheimer’s Disease, 42(S3):S3–S17. Ritchie, K. and Touchon, J. (2000). Mild cognitive impairment: conceptual basis and current nosological status. The Lancet, 355(9199):225–228. Roark, B., Mitchell, M., Hosom, J.-P., Hollingshead, K., and Kaye, J. (2011). Spoken language derived measures for detecting mild cognitive impairment. IEEE Transactions on Audio, Speech, and Language Processing, 19(7):2081–2090. Snowdon, D. A., Kemper, S. J., Mortimer, J. A., Greiner, L. H., Wekstein, D. R., and Markesbery, W. R. (1996). Linguistic ability in early life and cognitive function and Alzheimer’s disease in late life: Findings from the Nun Study. Journal of the American Medical Association, 275(7):528–532. Solomon, P. R. and Murphy, C. A. (2005). Should we screen for Alzheimer’s disease? Geriatrics, 60(11):26– 31. Vigliocco, G., Vinson, D. P., Druks, J., Barber, H., and Cappa, S. F. (2011). Nouns and verbs in the brain: A review of behavioural, electrophysiological, neuropsychological and imaging studies. Neuroscience and Biobehavioral Reviews, 35(3):407–426. Vincze, V., Gosztolya, G., T´oth, L., Hoffmann, I., Szatl´oczki, G., B´anr´eti, Z., P´ak´aski, M., and K´alm´an, J. (2016). Detecting mild cognitive impairment by exploiting linguistic information from transcripts. In Proceedings of the 54th Annual Meeting of the Association for Computational Linguistics (Volume 2: Short Papers), volume 2, pages 181–187. Wallin, A., Nordlund, A., Jonsson, M., Lind, K., Ed˚ G¨othlin, M., St˚alhammar, J., Eckerstr¨om, M., man, A., Kern, S., B¨orjesson-Hanson, A., Carlsson, M., Olsson, ¨ E., Zetterberg, H., Blennow, K., Svensson, J., Ohrfelt, A., Bjerke, M., Rolstad, S., and Eckerstr¨om, C. (2016). The Gothenburg MCI study: Design and distribution of Alzheimer’s disease and subcortical vascular disease diagnoses from baseline to 6-year follow-up. Journal of Cerebral Blood Flow and Metabolism : Official journal of the International Society of Cerebral Blood Flow and Metabolism, 36(1):114–31. Zadikoff, C., Fox, S. H., Tang-Wai, D. F., Thomsen, T., de Bie, R., Wadia, P., Miyasaki, J., Duff-Canning, S.,
Lang, A. E., and Marras, C. (2008). A comparison of the Mini Mental State Exam to the Montreal Cognitive Assessment in identifying cognitive deficits in Parkinson’s disease. Movement disorders, 23(2):297–299.
Proceedings of the LREC 2018 Workshop “Resources and ProcessIng of linguistic, para-linguistic and extra-linguistic Data from people with various forms of cognitive/psychiatric impairments (RaPID-2)”, Dimitrios Kokkinakis (ed.)