Improving Visual Representations of Code E.L. Burd, P.S. Chan, I.M.M. Duncan, M. Munro, P. Young
[email protected] Visualisation Research Group Centre for Software Maintenance University of Durham South Road, Durham, DH1 3LE, UK Keywords: code visualisation, call graphs, control flow, graph simplification, graph presentation
Abstract The contents of this paper describe the work carried out by the Visualisation Research Group in the Centre of Software Maintenance at the University of Durham. For obtaining a high level understanding of the code systems graphical representations are more useful than purely textual representations. However, graphical representations still have a tendency to provide the maintainer with too much information. This information overloading is detrimental to program comprehension therefore ways of reducing graphical complexity, preferably without information loss are required. Thus the work of the Visualisation Group has been to investigate strategies and heuristics for graphical information representation. Strategies considered include clustering and hiding nodes, layout, the use of colour, and the use of 3D technologies. This paper describes the results of this work and provides examples from a detailed case study that has been performed.
1. Introduction The term software visualisation has almost as many taxonomies as definitions [Pric93, Roma93, Myer90], each one offering a slightly different meaning and classification. The most fitting definition is that which encompasses all aspects of visually displaying a software system. This definition includes all possible views of the software and all possible representations which can range from source code listings through to the most abstract of graphical visualisations. Software visualisation typically encompasses the areas of algorithm animation and program visualisation, which in turn comprises of data visualisation and code visualisation both either static or dynamic. It is an obvious fact that when attempting to maintain a software system, the maintainer must first gain some understanding of the system. This understanding can come in numerous forms which may range from the system structure at various abstraction levels, to gaining knowledge of the program control flow or message passing mechanisms. It has long been known that
1
when gaining this understanding the maintainer will construct an internal cognitive model [Mayr95] of what ever aspect of the system they are interested in. Typically, to construct this cognitive model the maintainer will extract information directly from the source code and gradually piece together the software puzzle. This method of information gathering is far from efficient and requires the maintainer to continuously shift focus to various sections of the code and actively search for the information they require. What is needed is a method of presenting the necessary information in a readily understandable and intuitive manner which corresponds more closely to the structure of the cognitive model created by the maintainer.
2. Representation: Textual versus Graphical Purely textual source code is far from matching the maintainer’s cognitive model of the system, though it may be the case that the maintainer will use the relative locations of components within the source code as a basis for the model. Formatting or pretty-printing of the source code using techniques such as indentation and colouring give the code some visible structure, though this can only be viewed in small portions and the engineer must still navigate the code to construct an overall model. The popular approach taken is to display high level abstractions of the program as directed graphs. These graphs take on a number of forms and can represent various views of the program. The most common view of the program usually taken is the call graph which shows the functions and procedures as nodes and the function call relations as directed arcs depicting which functions are called and from where. Other views commonly shown are control flow, module dependencies, file inclusion hierarchies, hybrid call / control flow graphs, data flow and message passing. Each of these views provide the maintainer with a different perspective on the software system though none of them can give the full picture. 2.1 Textual Representation The problem for most maintainers is they have to maintain unfamiliar code that has been modified and the accompanying documentation is usually out of date, inadequate, inconsistent or sometimes non-existent. In the case where documentation does exist, maintainers may find it difficult to acquire sufficient information because documents are not necessarily produced with the needs of maintainers in mind. As a last resort, they have to rely on the source code in order to gain any understanding of the program. Sometimes, the source code may be the only reliable documentation available to them. Improving ways of abstracting relevant information from the source code is therefore much needed. This issue can be tackled in a number of ways: • • • •
the use of natural naming, the use of comments, modularisation, and pretty-printing the source code.
The development of high level languages such as Pascal and C++ was an important step towards increasing code readability and understandability. When maintainers first encounter an
2
identifier, they would invariably try to comprehend and infer a meaning from its name [Broo83]. The use of appropriate naming for variables and procedures is thus essential to bridge the gap between the programs and the semantics of the problem domain [Lait93]. It is common consensus that the use of suitable comments can be an invaluable aid to the comprehension process. The use of appropriate comments can be very powerful when used in conjunction with suitable naming of the identifiers. From the name of the identifier, maintainers would form an assumption about the functionality of that identifier. Maintainers would then search for extra cues from the source code in order to justify their assumptions [Broo83, Leto86]. Comments can be a valuable and effective source for these extra cues. Most maintenance activities are a cognitive skill. It is therefore subjected to the limitation of the human brain, i.e., only a limited amount of information can be studied at a time. Shneiderman [Shne80] conjectured that the information chunking process is used in understanding programs. Maintainers abstract the information in the program into chunks which are then built into an internal semantic structure representing the program. Complex problems are usually decomposed into sub-problems until these 'chunks' are reduced to manageable sizes. This echoes with the views expressed by both Wirth [Wirt71] and Parnas [Parn79]. Pretty-printing, which originated from [Ledg75], has gained much attention since the 1970s. It describes the use of indentation, spacing and layouts to make source code more presentable and readable to the programmers. The principal behind pretty-printing is that the appearance of the source code can affect the comprehension process. Shneiderman et al. [Miar83] conducted a comprehension experiment and they reported that the use of indentation and block-structured code strongly favour the comprehension process. They concluded that if no indentation is used in a large program, it would be a real hindrance and the program would be difficult to follow. The idea of pretty-printing is further explored by Baecker and Marcus. They developed a system, SEE, which can take the listings of a C program and produce a book-like layout [Baec90]. Oman and Cook have conducted several empirical studies and they believed that the book paradigm is superior to traditional methods [Oman90]. They argued that the book paradigm provides a method of formatting which is consistent with the comprehension strategies [Mayr95]. By providing visual cues and different ways to organise the source code, typographic formatting can reflect the underlying structure of the source code and aid the comprehension process. Almost all of the theories and strategies of program comprehension agree that it would involve an abstraction process and the construction of a cognitive model during the different stages of the comprehension process [Mayr95]. The abstraction process works hand in hand with the cognitive model. During the abstraction process, maintainers would look for various cues from the source code and try to extract relevant information from it. A cognitive model is then constructed which will later guide the maintainer to follow and understand the interrelationships between the program constructs. The discussion above addresses some of the ideas used for improving the understandability of the source code in order to facilitate the abstraction process. Nevertheless, the resulting textual representation may not be sufficient to reveal the interrelations straight away, especially when the relations are scattered and buried deep in the
3
source code. As a result, the cognitive model may be inadequate which will eventually lead to an incorrect interpretation of the program. The use of visualisation techniques to facilitate the comprehension process can be an important step forward. The ultimate goal of program visualisation is to help maintainers to form clear and correct mental images of a program's structure and functions. Graphical representations are useful in that they are not only easy to understand and to manipulate, but more importantly, they resemble more closely the structure of the cognitive model. These representations are a natural way to depict relations. 2.2 Graphical Representation A large number of software tools are available to aid the maintainer in understanding a software system, these range from maintenance or comprehension aids to full software development environments, for example McCabe, Logiscope [Meek88] and SNiFF+1. These tools provide graphical representations of some aspect of the software under analysis, typically a function call graph, class inheritance hierarchy or control flow graph. The graphs produced by these tools are unfortunately not very well presented and some use layout criteria which are not suitable for the data being displayed, such as symmetry and regular spacing of nodes. The control flow graphs produced by the tools are more aesthetically pleasing due to the inherent tree-like structure of these graphs. One important feature which is present in these tools is the ability to move from the visualisations to the source code fairly easily, thus allowing the maintainer to switch between the low-level detail and the abstract visualisations. The views available in software tools such as those above have the potential to provide valuable structural information, but are often badly displayed and unreadable making them more of a hindrance than an aid. A large number of tools appear to have put little effort into the layout or presentation of their graphical representations, apparently adopting the view that any visualisation will help. Unfortunately this is not the case, the layout and presentation of the visualisation could be construed as being of greater importance than the actual content of the visualisation. For instance, a badly presented graph containing key structural information could be extremely hard to read or follow, possibly resulting in the engineer spending valuable time deciphering the information or even gaining no information at all. On the other hand, a well presented and readable graph which contains little useful information could be quickly dismissed allowing time to be spent more profitably elsewhere. The layout and presentation of visualisations is extremely important and active research is being carried out in creating new views and representations of software which provide an intuitive and useful visualisation. The majority of software views are represented by directed graphs which are themselves the subject of presentation and layout research, though this research does not cater for the content and meaning of the graphs as they apply to software. Typical 2D call graphs are a popular choice of code visualisation, though for any reasonably large system these 1
McCabe by McCabe & Associates Logiscope by Verilog SNiFF+ by TakeFive Software
4
become overly complex and unreadable [Stor95]. The problem unfortunately lies with the typically extremely large set of relations and dependencies between software components such as functions, classes and data. Using standard 2D graphing techniques even relatively small graphs (when considering software systems) will soon clutter the display making an unreadable layout. Features such as a scrollable window or allowing nesting through multiple windows do make the graph more readable, however only a small area is visible at any one time and it is easy to lose context with regard to the whole graph. Three-dimensional graphical representations come some way to alleviating the problems of display size, though at present these views merely move the threshold back a little and still become overly complex for large graphs. Visualisation tools have been developed such as the SHriMP views [Stor95] incorporated in Rigi which use fisheye techniques and nested graphs to allow focusing on particular areas of the graph while still retaining a view of the whole structure.
3. Strategies for Improving Graph Presentation Generally a graphical presentation of source code gives a far superior view of the high level functioning of code compared to a textual representation. However, while graphical representations are an improvement upon textual ones they are still apt to provide maintainer with too much information. For this reason a number of strategies have been defined to improve existing graphical representations. Thus, in this paper a number of strategies are described which aid the graphical presentation of source code. These include: • • • • •
simplification involving the hiding of certain nodes clustering involving the grouping of certain nodes layout heuristics for clear presentation of nodes and arcs presentation including the use of colour the application of 3D representations
The strategies identified do not form a rigid method rather it is intended that maintainers will select those which provide the best results for the application under maintenance.
3.1 Graph simplification In the discussion above it was indicated that the presentation of information in a graphical format is a more flexible and understandable representation of high level maintenance information such as control flow. For small or simple programs their representation as a graph provides the maintainer with a clear and precise representation of its function. However, as
5
source code becomes larger and more complex the understandability of the graph produced decreases. In recognition of this point a number of ways in which the understandability of large graphical code representation can be improved were looked at. The procedure described is not intended to form a fixed method rather it should be viewed as a list of recommendations which when implemented either individually or collectively improve the presentation of information for maintainers. The examples used in this section are taken from the Mosaic (NCSA Mosaic for the X window System, Copyright (C) 1993, Board of Trustees of the University of Illinois) source code and show how improvements in the understandability of source code can be achieved automatically. The research work on visualisation has mainly concentrated on the C language but also under investigation are the needs of the COBOL language. In addition the representation of code in many forms which include call graphs and control flow have been considered. For the purpose of this paper concentration will be on C call graphs. However, the recommendations made are equally applicable to most modern programming languages and program representations. By way of example the source code in the file gui-dialogs.c has been selected. This defines or uses about 80 functions and makes about 300 calls to these functions. In addition the standard libraries stdio, string and sys/types and the 3rd party X window / Motif Xt and Xm are included. The Mosaic case study carried out has involved the analysis of 50,000 lines of C including the generation of call graphs and their simplifications and also the generation of control flow graphs. For a call graph functions are defined to be the nodes and the call to be the directed arcs of the graph. The initial representation of the graph is shown in figure 1 below.
Figure 1: initial representation of gui-dialogs.c
6
The call graph has been laid out in a graph drawing tool called graph-tool. The main feature of graph-tool is that it does not use dummy nodes when drawing lines but it can attempt to minimise crossing lines [Bodh94]. Drawing the same graph using other tools (daVinci 2, Dot) which use different layout criteria still produce a similar cluttered picture. The large number of the lines result in the graph providing little useful information to the maintainer. A number of simplification procedures to support the understanding process have therefore been identified. Clearly the different simplification procedures that are performed on the graph will change depending on the type of modifications that the maintainer intends to perform. However, since all the simplifications that are proposed can be performed automatically but also can be undone it is perfectly acceptable to keep updating the graph to suit the maintenance operation currently being performed. In order to assist the maintainer in identifying the similarity between each of the different views that are created the tool kit provides support for retaining and relocating of the initial node positioning. Four initial graph simplification strategies are proposed. These are: 1. 2. 3. 4.
arcs numbered hiding of 3rd party libraries hiding of the ANSI C standard libraries hiding of external function calls to the application's libraries
These strategies will now be described and their benefits discussed. In addition, example results using the Mosaic gui-dialogs.c source code described earlier will be presented at each stage. In the systems studied, one major cause of clutter is multiple calls of one function to another, leading to multiple directed arcs between the nodes. A solution is to replace these multiple arcs with a single arc. Making this simple change however will result with a loss of information (how many times a function calls another function). By replacing the 'calls' relation which annotates the directed arc with the number of times the function calls a particular function, the number of directed arcs is reduced and no information is lost. mo_post_open_window
mo_post_open_window
Calls Calls Calls
XmxSetConstraints
2
3
XmxSetConstraints
daVinci, V 4.1 by Universität Bremen
7
Figure 2: Removal of Multiple arcs Through the use of this simple procedure in this particular example the number of arcs (calls) was reduced by just under 40%. The updated graph is represented in figure 3 giving a clearer but still cluttered picture. open_local_win_cb
print_win_cb
save_win_cb
XmxTextSetString
mo_post_savebinary_window 1 1
savebinary_win_cb
savebinary_cancel_cb
strdup
mo_convert_newlines_to_spaces 2
XmxMakeScrolledText 1
XmxMakeToggleButton 2
mo_post_source_window
1
1
1
1 XmxAddCallback 1
mo_url_canonicalize_local
1
1
1
1 mo_assemble_help_url
XmxMakeInfoDialog
1
1
1
1
open_win_cb
2 2
1 1 1
rename_binary_file 1 2
1
10
1
XtManageChild 7
HTMLSetSelection
1 4 HTMLGotoId
1 mail_win_cb 5
2 1
1 HTMLSearchText
1
mo_load_window_text
1
6
1
1 1
1
1
mo_post_save_window
XmxMakeFileSBDialog
1
source_win_cb
1
1
2
XtParent
1
10
2
1 XmxMakeFormAndTwoButtonsSqueezed 2 1 1
1
2
1
search_win_cb
1 1
XmxMakeText 1 1
1 1
1 XmxAddCallbackToText 2
1 3
mo_post_open_window
format_optmenu_cb 1
1 2 1 1 XmxSetConstraints
1
5
1
2
11
1 4
1 XmxSetArg
mail_fmtmenu_cb
1
21 1 11 1 1
3 XmxSetToggleButton
1 2 XmxMakeFormAndFourButtons 1 2 1
8
3 1 4
11 1
1
1
1
2
2 14 2
2 1
1
1
1
4
1
1
1 1
1
1
1
1
XmxExtractToken
print_fmtmenu_cb
XmFileSelectionDoSearch 7 1
1
1
mo_open_another_window
1
2
1
1
1 1
1 HTMLGetText
XmxTextGetString
1
1 XtUnmanageChild
mo_tmpnam
free
1
1 1 mo_post_open_local_window
1
1 1 mo_send_mail_message
11
1
2 mo_post_mail_window
1
1
12
1
mo_post_print_window
2
2
2
2
3 XmxRMakeOptionMenu
XmxMakeFormAndThreeButtons
XmxMakeTextField
XmxMakeLabel 1
1
1
1 mo_post_search_window 5 1
1
11
1 11
11 3
1
XmxMakeFrame 1
1
1 XmxMakeFormDialog
XmxSetOffsets
XmxMakeForm
XmxMakeErrorDialog
XmxMakeHorizontalSeparator
5
XmxSetUniqid
mo_not_busy
mo_busy
fopen
fputs
fclose
strlen
XmxManageRemanage
XmStringGetLtoR
system
malloc
sprintf
Figure 3: gui-dialogs.c with multiple arcs removed The second strategy for graph simplification is the hiding of the 3rd party libraries. Such libraries could include the out-sourced C++ libraries or windowing system libraries such as Open Windows or as in the case of the Mosaic application the X/Motif libraries. The hiding of the nodes from the graph reduces the total number of nodes by 43%. In addition this also reduces the number of arcs quite drastically in this case by 68% compared with the graph with numbered call links and by 80% of the initial graph. Figure 4 shows the graph obtained by hiding the X/Motif libraries3.
3
An additional library called Xmx has also been included with the X/Motif libraries. In fact these libraries have been defined by the Mosaic application to simplify the programs interface to the X window libraries.
8
open_local_win_cb
print_win_cb
1
mo_post_savebinary_window
1
mo_post_source_window
savebinary_win_cb
save_win_cb
1
1
savebinary_cancel_cb
strdup
1
mo_convert_newlines_to_spaces
1
1 mo_assemble_help_url
1
mo_url_canonicalize_local
1
1 HTMLSetSelection
open_win_cb 1 HTMLGotoId
rename_binary_file 1
1
1 mail_win_cb
2 HTMLSearchText
mo_load_window_text
1
1
1
7
1
5
4
search_win_cb
mo_post_save_window
1
1
source_win_cb
3
3
1
1 mo_post_open_window
format_optmenu_cb
1 1
1
11
421
1 11
mail_fmtmenu_cb
1 34 1
1
2
2
2
2
1
1
1
1 1
1
1 print_fmtmenu_cb
HTMLGetText 1
mo_open_another_window
mo_tmpnam
mo_send_mail_message
free
1
mo_post_open_local_window
mo_post_mail_window
mo_post_print_window
mo_post_search_window
mo_not_busy
mo_busy
fopen
fputs
fclose
strlen
system
malloc
sprintf
Figure 4: gui-dialogs with X/Motif libraries removed A similar process to the one described above is the hiding of the ANSI C standard libraries. Obviously if one were investigating the maintenance implications of the code which relates to these libraries, such as memory management, then the hiding of these libraries would not be a sensible approach. However, assuming that, initially at least, the maintainer is trying to obtain an understanding of the internal functions of the code then hiding of the ANSI C standard libraries is an appropriate approach. In the example the removal of these libraries reduces the number of nodes by 21% and represents a total reduction in nodes of about 55% (when strategies 2 and 3 are performed). In terms of arcs this strategy further reduces the arcs by an additional 47% from the graph obtained from the application of strategy 3. In terms of the total number of arcs represented these have now been reduced by 90%. This graph is shown in figure 5.
9
open_local_win_cb
print_win_cb
mo_post_savebinary_window
1
mo_post_source_window
savebinary_win_cb
save_win_cb
1
1
savebinary_cancel_cb
1
mo_convert_newlines_to_spaces
1 mo_assemble_help_url
1
mo_url_canonicalize_local
1
1 HTMLSetSelection
open_win_cb 1 HTMLGotoId
rename_binary_file 1
1
1 mail_win_cb
2 HTMLSearchText
mo_load_window_text
1
1
1
search_win_cb
mo_post_save_window
source_win_cb
3
1
1
1 mo_post_open_window
format_optmenu_cb
1 1
1
1
1
1
mail_fmtmenu_cb
1 1 print_fmtmenu_cb
HTMLGetText mo_open_another_window
1
mo_tmpnam
mo_send_mail_message
1
mo_post_open_local_window
mo_post_mail_window
mo_post_print_window
mo_post_search_window
mo_not_busy
mo_busy
Figure 5: gui-dialogs with standard libraries removed The final strategy investigated is the removal of external function calls to the application's libraries, in this case to the Mosaic application libraries. This strategy provides a further reduction of 38% of nodes which is a reduction of 72% of nodes in total. Interestingly by applying all the strategies that have described only one arc remains. This need not always be the case, frequently it has been observed that through applying these strategies that the remaining links still have a complex relationship between the remaining objects but its understandability is greatly improved. The results obtained vary depending on the way in which the code is written. Results indicate that the module gui-dialogs provides callable functions that use the services of a number of other functions but not the services of itself . Given that the interactions between individual functions of the source code is low but interactions between these internal functions and external libraries is high the hiding of such information for visual representation is not a sensible approach. Instead the approach of information clustering may be more fruitful towards depicting the function of the gui-dialogs source code. 3.2 Clustering Information clustering is the process whereby information groups are abstracted from the call graph and represented as 'common nodes'. A single new node replaces the ones which have been removed. Therefore, the name given to the new node should represent the collection of nodes which it replaces. This information clustering principle is being used in a number of ways. These are:
10
1. 2.
grouping of function calls to other source code files grouping of function calls to other libraries
Figure 6 represents the graph after strategies 1 to 3 for graph simplification have been applied and shows how the information clustering principle increases the understandability of the graph. This example groups 32% of the nodes into 3 new nodes representing external source code identified by HTML.c, mo-www.c and gui.c. In addition this strategy removed 30% of the arcs. 1 mo_post_savebinary_window
rename_binary_file
savebinary_win_cb save_win_cb 2
2 print_win_cb open_local_win_cb
1
gui.c EXTERNAL_FUNCTIONS
mo-www.c EXTERNAL_FUNCTIONS
1
source_win_cb 2
4
1
4 2
2
2 mail_win_cb
1
gui_documents.c mo_load_window_text
open_win_cb 1 search_win_cb 3 4 whine.c mo_send_mail_message
HTML.c EXTERNAL_FUNCTIONS
mo_post_source_window
mo_post_open_local_window mo_post_print_window
mo_post_search_window
mo_post_save_window
mail_fmtmenu_cb
mo_post_mail_window
mo_post_open_window
savebinary_cancel_cb
print_fmtmenu_cb
format_optmenu_cb
Figure 6: The effect of clustering However, with this clustering strategy it is possible to group nodes using any / all of the above graph simplification strategies including grouping 3rd party and standard libraries. Unfortunately it has been observed that in some cases the grouping of some nodes will increase the complexity of the graph. Typically this occurs when nodes are grouped that each link to a large number of different nodes. In this case the grouping process does not greatly reduce the number of arcs with the parent nodes calling numerous newly grouped nodes thus meaning that the multiple arcs can be removed with the initial simplification strategy. An example of such clustering is represented in figure 7. In this case 30 nodes and 84 arcs are hidden. Figure 7 shows how clustering can sometimes fail to reduce complexity acceptably with the inclusion of nodes being called many times when compared with the hiding strategy of these nodes applied in figure 4. In addition for larger graphs this problem of minimal complexity reduction is compounded many times. It is possible to analyse graphs to identify those groups of nodes that benefit from clustering and those that would not. This can be calculated by taking the mean number of those nodes calling each of the nodes to be grouped. The higher the number obtained the greater the benefit of clustering. In this case a mean of 6 was achieved but frequently values of 15 or more can be achieved which indicates clustering to be a very useful concept to apply.
11
open_local_win_cb 3
print_win_cb 1
save_win_cb
2
savebinary_win_cb
savebinary_cancel_cb
strdup
mo_convert_newlines_to_spaces
5
Xmx_Library 30
1
mo_post_savebinary_window
1
3 mo_post_source_window
13
1
1
1
1
mo_url_canonicalize_local
1
1
mo_assemble_help_url
1
5
11
1 HTMLSetSelection
open_win_cb
18
1
1
1
1 HTMLGotoId
rename_binary_file 1
1
1 mail_win_cb
2 3 1 HTMLSearchText
mo_load_window_text
1
3
mo_post_save_window
37
1
1
1
7
1
2
4
5
2
search_win_cb
29
source_win_cb
XtParent 2
1
26
1
3
1
3
2
1 mo_post_open_window
1format_optmenu_cb
1 1 1
1
11
421
1 111
mail_fmtmenu_cb
1 34 1
1
2
1
2
2
2
1
1
1
1
1 1
1
print_fmtmenu_cb
1
HTMLGetText 1
mo_open_another_window
mo_send_mail_message
mo_tmpnam
Xt_Library
free
1
mo_post_open_local_window
1
1
mo_post_mail_window
mo_post_print_window
mo_post_search_window 1
mo_not_busy
mo_busy
fopen
fputs
fclose
strlen
Xm_Library
system
malloc
sprintf
Figure 7: Grouping resulting in nodes being called may times
3.3 Layout In general the approach is to retain the positioning on the nodes on the graph in order that cross reference can easily be made between each nodes after the application of the simplification and clustering strategies. The tools ensure that such node cross references can be made. In the diagrams above (except figure 6) use has been made of an automatic layout algorithm. This work has indicated that automatic graph layout does not always provide the simplest representation. The reason for this is that at present only general graphical layout algorithms are used. Examples of general layout heuristics are readily available [Bati85, Tama88]. Unfortunately, the best mode of layout is often application dependent. For this reason some more specific layout heuristics are defined. These include: • • • • • •
use straight lines grouping nodes into clumps where nodes have a high degree of fan-in or fan-out (those nodes which are called or call other nodes many times) ensuring there is plenty of white space between clumps entirely isolate subgraphs minimising crossing lines reducing the length of lines as far as possible especially within clumps
Many of the heuristics detailed above are in opposition of the ones applied to general graphs. The inclusion of white space is one example. Batini [Bati85] describes numerous heuristics that are defined to reduce the size of the overall graph and to keep nodes close together. Clearly not
12
all the heuristics can be used all the time but if any of these heuristics are to be broken attempts are made to minimise this to only using crossing lines and by increasing line lengths.
3.4 Presentation The way the graph looks very much depicts its understandability. Therefore apart from the graph layout strategies, a number of other approaches to support the understanding process have been applied. These include: • •
colour hierarchical views
Unfortunately the discussion on the use of colour for the enhancement of graphical representation of source code is restricted due to black and white printing restrictions. One use of colour however is to indicate clustering. When external calls to libraries are grouped then the new nodes are coloured to indicate that they are additions to the graph. In this way a different colour can be applied to each of the clustering principles thus making the difference between each of the new nodes explicit. However the use of colour is not only applied with simplification techniques it is also applied as a highlighting mechanism where 'parts' of the graph are highlighted by colouring nodes and / or arcs. Conversely colour is used for concealment. To prevent distraction by the appearance of certain nodes on the graph then these nodes are set to the same colour as the background. This in effect is similar to the hiding principles described above, but leaving the nodes on the graph. Colour is also used to identify a programs' hierarchical composition. The hierarchical layout of the directed graph divides nodes into a number of subsets called levels. The nodes in each level are traditionally laid on one horizontal line, and the levels are stacked vertically [Mess91]. The primary goal of the hierarchical layout is to try to reveal the ancestral relationship among nodes clearly and unambiguously. In a perfect hierarchy, all the nodes predecessors appear physically above, and all of the nodes successors appear physically below it. However, rarely are such perfect hierarchies achieved and thus using colour to represent hierarchical levels is a more flexible approach. In addition the necessity to restrict positioning of the nodes is elevated as the colour represents the levels therefore hierarchical views can be used in conjunction to our layout algorithms. In this way the use of colour for hierarchical views can be likened to a contour map.
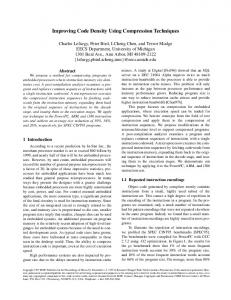
3.5 3D Representations Three-dimensional program representations offer yet another view on a software system. At present these views are limited to simply mapping the over-used 2D graphs into three dimensions in an attempt to alleviate the visual complexity, this unfortunately will not suffice. 3D call-graphs simply offer a greater working volume for the graphs thus increasing the
13
capacity for readability though in the same vein they also offer problems of their own such as foreground objects obscuring background objects, disorientation and spatial complexity. Unless the viewpoint on the 3D graph is actually within the graph structure, you are limited to merely a 2D picture of a 3D structure which results in information loss. What is needed for 3D visualisations to be effective is a paradigm which moves away from the standard graph structure and introduces a more meaningful and abstract program representation which makes full use of the 3D environment and thus the engineers natural intuition and perceptual skills. A useful representation as described above has unfortunately not yet been discovered. 3D software structure visualisations are still centred around creating standard call graphs within a 3D space, as in figure 8. This method does offer some slight advantages over standard 2D graphs namely the flexibility, the range of viewpoints and the increased working volume, though it does suffer from a range of problems as mentioned above. One possibility in displaying these 3D structural visualisations is that certain common ‘shapes’ or configurations may become apparent which could then be related directly to design features in the code. These shapes could possibly lead towards a visual metric or clue to aspects of software quality.
open_local_win_cb
mo_load_window_text mo_tmpnam mo_url_canonicalize_local
open_win_cb source_win_cb mo_convert_newlines_to_spaces
print_win_cb mo_not_busy
savebinary_win_cb
mo_open_another_window mo_assemble_help_url HTMLSearchText
mail_win_cb mo_busy search_win_cb
save_win_cb
HTMLGetText
HTMLSetSelection
HTMLGotoId
mo_send_mail_message
Figure 8: 3D representation of gui-dialogs Figure 8 shows a 3D representation of gui-dialogs.c after simplification steps 1, 2 and 3 have been applied. Further to this, all unconnected nodes have been removed from the graph so the visualisation can concentrate solely on the main structure or call network. The graph is produced using a three-dimensional variant on the force-directed placement algorithm [Fruc91] which models the graph as a physical system of forces. Nodes on the graph repel each other with a force inversely proportional to their separation whereas arcs pull connected nodes closer together with a force proportional to the length of the arc. The system is initially unstable and in
14
a high energy state, with nodes allowed to move freely within 3D space under the influence of the forces imparted on them. Typically within a number of iterations the positioning of the nodes will settle into an equilibrium or minimum energy state resulting in a completed layout. Layouts produced using this method provide interesting structural groupings and often result in aesthetically pleasing graphs. Unfortunately this form of presentation suffers similarly to 2D call graphs when given highly connected networks, resulting in the graph becoming very difficult to understand around nodes with high fan-in or fan-out. Figure 8 shows the graph hierarchy overlaid using the node colour with the hierarchy descending from light to dark colours (only two hierarchical levels in this graph). A variant on this approach is to constrain nodes of a particular level in the hierarchy to 2D horizontal planes within the 3D space. Nodes can move freely around their respective planes but cannot move vertically towards other levels of the hierarchy. This results in a tree-like view of the software structure which provides additional information on the relationships between software components. It has been found that a more complex graph can be made to easier to interpret using 3D technologies [Ware94] it is therefore important to consider this option for the presentation of complex graphs.
4. Conclusions This paper has identified the use of graphical representations to a maintainer for gaining a high level understanding of the source code. It was recognised that for large and complex code the understandability of these graphical representations are compromised and therefore a means of reducing their complexity is required. This paper described a number of ways in which the complexity of graphical code representations can be reduced. Since the effectiveness of the strategies identified is application specific a prescriptive method has not been identified, instead it should be left to individual maintainers to select the appropriate strategies for their application. In many cases trial and error may be required to identify an appropriate strategy and so for this reason whenever possible automatic tool support has been provided.
References [Baec90] [Basi82] [Bati85] [Broo83]
Baecker, R.M. and Marcus, A. Human Factors and Typography for More Readable Programs. Addison-Wesley, Reading, Massachusetts. 1990. Basili, V.R., and Mills, H.D. Understanding and Documenting Programs. IEEE Transactions on Software Engineering. March 1982. Vol. SE8, No. 3, pages 270-283. Batini, C. Furlani I. and Nardelli E. What is a good diagram? A pragmatic approach, Proceedings of the 4th International Conference on Entity Relationship Approach, Chicago, 1985. Brooks, R. Towards a Theory of the Comprehension of Computer Programs. International Journal of Man-Machine Studies. 1983, Vol. 18, No. 6, pages 543-554.
15
[Kunt84] [Fruc91] [Lait93] [Ledg75] [Leto86] [Mess91]
[Mayr95] [Meek88] [Myer90] [Miar83] [Oman90] [Parn79] [Pric93] [Roma93] [Shne80] [Stor95] [Tama88] [Ware94] [Wirt71]
Kunth, D. E. Literate programming. The Computer Journal. 1984. Vol. 27, No. 2, pages 97-111. Fruchterman, T.M.J. and Reingold E.M. Graph Drawing by ForceDirected Placement , Software Practice and Experience, Vol. 2, Part 11, November 1991. Laitinen, K. The Principle of Natural Naming in Software Documentation, Technical Research Centre of Finland, ESPOO Report Number 1498, 1993. Ledgard, H.F. Programming Proverbs. Hayden, Rochell Park. New Jersey. 1975. Letovsky, S. Cognitive Processes in Program Comprehension. Empirical Studies of Programmers, Albex, Norwood NJ, 1986. Pages 58-79. Messinger, E.B., Rowe L.A. and Henry, R.R. A Divide and Conquer Algorithm for the Automatic Layout of Large Directed Graphs IEEE Transactions on Systems, Man and Cybernetics, January/February 1991, Vol SMC-21, No 1, pages 1-11. von Mayrhauser, A. and Vans, A. M. Program Comprehension During Software Maintenance and Evolution. IEEE Computer. August, 1995. Vol. 28, No. 8, pages 44-55. Meekel, J. and Viala, M. Logiscope: A Tool For Maintenance, In Proceedings of the ICSM '88 Conference on Software Maintenance, papers 328 - 334, 1988. Myers, B.A. Taxonomies of visual programming and program visualisation. Journal of Visual Languages and Computing, 1990, Vol. 1, pages 97-123. Miara, R.J., Musselman, J.A., Navano, J.A. and Shneiderman, B. Program Indentation and Comprehensibility , Communications of the ACM. November, 1983. Vol. 26, No. 11, pages 861-867. Oman, P.W. and Cook, C.R. The Book Paradigm for Improved Maintenance. IEEE Software. January, 1990. Vol. 7, No. 1, pages 39-45. Parnas, D.L. On the criteria to be used in decomposing systems into modules. Communications of the ACM. 1972. Vol. 15, No. 12, pages 1053-1058. Price, B.A., Baecker, R.M., and Small, I.S.A Principled Taxonomy of Software Visualisation. Journal of Visual Languages and Computing 4(3):211266. Roman, G-C. and Cox, C. A Taxonomy of Program Visualisation Systems., IEEE Computer, December 1993, Vol. 26, No. 12, pages 11-24. Shneiderman, B. Software Psychology. Cambridge MA: Winthrop Publishers Inc. 1980. Storey, R. and Müller, H.A. Manipulating and Documenting Software Structures Using SHriMP Views. International Conference on Software Engineering. 1995, October 17-20, Opio (Nice), France, pages 275-284. Tamassia R., Di Battista G and Batini C. Automatic Graph Drawing and Readability of Diagrams, IEEE Transactions on Systems and Cybernetics, Vol 18, No 1, January / February, 1988. Ware C. and Franck G. Viewing a Graph in a Virtual Reality Display is Three Times as Good as a 2D Diagram, IEEE Conference on Visual Languages, Conference Proceedings, October 1994. Wirth, N. Program development by Stepwise Refinement. Communications of the ACM. April, 1971. Vol. 14, No. 4, pages 221-227.
16