Improving Web Search Results Using Affinity Graph Benyu Zhang1, Hua Li2, Yi Liu3, Lei Ji4, Wensi Xi5, Weiguo Fan5, 1 1 Zheng Chen , Wei-Ying Ma 1
Microsoft Research Asia, 49 Zhichun Road, Beijing, 100080, P. R. China
{byzhang, zhengc, wyma}@microsoft.com
2
LMAM, School of Mathematical Science, Peking University, Beijing, 100871, P. R. China
[email protected]
3
Department of Computer Science and Engineering, Michigan State University, East Lansing, MI 48824, USA
[email protected]
4
Department of Computer Science, Beijing Institute of Technology, Beijing, 100871, P. R. China 5
[email protected]
Virginia Polytechnic Institute and State University, Blacksburg, VA 24060, USA
{xwensi, wfan}@vt.edu ABSTRACT In this paper, we propose a novel ranking scheme named Affinity Ranking (AR) to re-rank search results by optimizing two metrics: (1) diversity -- which indicates the variance of topics in a group of documents; (2) information richness -- which measures the coverage of a single document to its topic. Both of the two metrics are calculated from a directed link graph named Affinity Graph (AG). AG models the structure of a group of documents based on the asymmetric content similarities between each pair of documents. Experimental results in Yahoo! Directory, ODP Data, and Newsgroup data demonstrate that our proposed ranking algorithm significantly improves the search performance. Specifically, the algorithm achieves 31% improvement in diversity and 12% improvement in information richness relatively within the top 10 search results.
Categories and Subject Descriptors H.3.3 [Information Storage and Retrieval]: Information Search and Retrieval – retrieval models, search process; H.2.8 [Database Management]: Database Applications – Data Mining
General Terms: Algorithms, Performance Keywords:
Affinity Ranking, Information Retrieval, Link Analysis, Diversity, and Information Richness
1. INTRODUCTION Most current web search engines tend to provide a list of search results to users’ queries according to the relevance score of each document to the query. This paradigm is very useful when users’ information needs (represented by the queries) are clear and they care more about precision than recall in the returned results. Unfortunately, many of the queries presented to a web search engine nowadays are ambiguous [5] and the user’s actual Permission to make digital or hard copies of all or part of this work for personal or classroom use is granted without fee provided that copies are not made or distributed for profit or commercial advantage and that copies bear this notice and the full citation on the first page. To copy otherwise, or republish, to post on servers or to redistribute to lists, requires prior specific permission and/or a fee. SIGIR’05, August 15–19, 2005, Salvador, Brazil. Copyright 2005 ACM 1-59593-034-5/05/0008...$5.00.
information needs are unknown. Users may suffer from the vast number of redundant and yet not very relevant documents that are related to a few most popular topics listed in the top of search results. Such search experience often makes users frustrated. Several approaches have been proposed to improve such situation. Carbonell et al [3] proposed a re-ranking method based on maximal marginal relevance criterion to reduce redundancy while maintaining query relevance in re-ranked documents. A marginal relevance of a document is defined as the relevance with a query minus that of previously selected documents. Maximizing this marginal relevance will help achieve a low redundancy in a group of documents. But there is no direct criterion about diversity evaluation to ensure that the group of documents with low redundancy can achieve large topic coverage. Recently proposed subtopic retrieval method [18] is another useful approach to improve the high redundancy search result. Different from Carbonell’s work, statistical language model is applied to calculate the document relevance and measure the novelty of a document. However, as the subtopic retrieval method is concerned mostly on covering as many subtopics of a query topic as possible, it may not achieve the lowest redundancy of a group of documents. As reported in [3], the majority of people in the experiments said they preferred the method which provides them search results with the most broad and interesting topics. However, since the top search results are very often dominated by a set of closely related documents on some specific topic, users often have to face the following two situations: (1) the top search results can hardly cover a sufficient variety of topics to meet the users’ diversified information need; (2) there is no indication about how informative a returned document is on the query topic. In traditional information retrieval research, precision and recall [1] have been used as metrics to evaluate information retrieval systems. Both metrics only concern about the relevance of the documents returned, without concerning the number of various topics that the returned document list covers, or the range of topics a single returned document covers. In web link analysis research, the popularity of a web page [9, 12] has been widely adopted to measure the quality of a web page. However, this kind of quality is computed based on web page link graph and is independent to the content of a web page. All these observations motivate us to introduce two novel metrics, diversity and information richness, which measure the quality of
search results by considering the content based link structure of a group of documents and the content of a single document in the search results. Diversity measures the variety of topics in a group of documents. It shows the holistic property of documents set. Information richness measures how many different topics a single document contains. Based on the two metrics, a novel algorithm named Affinity Ranking (AR) is proposed to re-rank the top search results. In particular, we first model the content based link structure of a group of documents as a directed graph which we call an Affinity Graph (AG) based on the asymmetric similarities between document pairs. Similar to web page link analysis, an “importance” score is computed based on Affinity Graph for each document indicating its information richness. Secondly, we apply a greedy algorithm to assign a penalty score to each returned document considering the diversity property of query-related topics. Thirdly, the AR score of each document is obtained as a combination of the information richness and diversity penalty scores. AR scores are then used to re-rank the top search results. Our experimental results in Yahoo! Directory and ODP Dataset demonstrate that our proposed AR algorithm significantly improves the coverage of query-related topics in the top 10 search results over the K-Means clustering algorithm. Meanwhile, experiments on a newsgroup data set show that the AR algorithm achieves about 31% improvement in diversity and 12% improvement in information richness in the top 10 search results without loss in precision and recall. The rest of the paper is organized as follows. In Section 2, we introduce the background by explaining the state-of-art link analysis algorithms. In Section 3, we introduce the Affinity Ranking algorithm, as well as the formal definitions of diversity and information richness. Experiments and evaluations are reported in Section 4. We conclude and discuss future works in Section 5.
2. BACKGROUND Recently, there have been growing research interests on mining the relationship between data objects, which is usually referred to as “link” in the literature. Link structure has been proved to be very useful in various applications such as information retrieval [9, 12], classification [10] and clustering [8]. Two of the most famous works on link analysis are Google’s PageRank algorithm [12] and Kleinberg’s HITS algorithm [9]. Both of them make use of the hyperlink structure among web pages to model a group of web pages as a link graph. “Explicit link analysis” and “implicit link analysis” [4, 16, 17] are currently two major sub-areas in link analysis research field. Hyperlinks embedded in web pages can be considered as “explicit links” since they explicitly provide a connection from one page to another. “Implicit links” refers to those linkages inferred from users’ behavior, such as the user’s access pattern on web pages. The difference between them is that explicit link represents web editor’s view since hyperlinks are edited by them, while implicit links represent end-users’ view. Two typical examples of implicit link analysis are DirectHit [6] and Small Web Search [17], which assumes that two web pages are implicitly linked if they are visited sequentially by the same end-user. DirectHit and Small Web Search can be considered as modified versions of HITS and PageRank algorithms applied on implicit link structure. However, the metrics used to evaluate these methods discussed are intrinsically subjective, and they can not quantify the information
contained in web pages objectively. In this work, we develop objective metrics to measure the amount of information contained in a single document and also the topic variety in a group of documents.
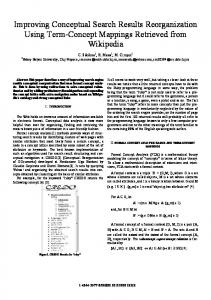
3. AFFINITY RANKING The framework of Affinity Ranking is illustrated in Figure 1. It includes three steps: (1) Affinity Graph (AG) based on the content link structure is constructed for the entire documents collection; Information richness of each document is then calculated based on AG. (2) For a given query, a result set of relevant documents are produced by the full-text search process. Based on AG and the information richness score, diversity penalty is imposed to each document in the result set. (3) The information richness and diversity penalty scores are combined to obtain the Affinity Rank score so as to re-rank the top returned document list.
Figure 1: The Affinity Ranking (AR) Framework We now give the formal definitions of information richness and diversity. Diversity: Given a set of documents R = {d1 , d 2 ,L d m } , we use diversity Div(R) to denote the number of different topics contained in R. Given a document Information Richness: collection D = {d i | 1 ≤ i ≤ n} , we use information richness
InfoRich(d i ) (see Eq. (1)) to denote the informative degree of the document d i , i.e. the richness of information contained in the document d i with respect to the entire collection D. Without loss of generality, we let InfoRich ( d i ) ∈ [0,1] . For a set of documents Rl = {d1 , d 2 ,L d l } which contain Div(R) topics (i.e. diversity = Div(R) ), its average information richness can be calculated as:
InfoRich( Rl ) =
1 Div ( Rl )
Div ( Rl )
∑ k =1
1 Nk
Nk
∑ InfoRich(d
i k)
(1)
i =1
Where d ki represents one of the N k documents associated with the k-th topic. In the rest of this paper, we use average information richness to refer to the information richness of a set of documents.
3.1 Affinity Graph Construction
Let D = {d i | 1 ≤ i ≤ n} denote a document collection. According to vector space model [15], each document d i can be represented
r as a vector d i . The similarity between a documents pair of d i and d j can be calculated as
r r r r di ⋅ d j sim(d i , d j ) = cos(d i , d j ) = r r di ⋅ d j
(2)
For further measurement on the significance of the similarity between each document pair, we define the affinity of d j to d i as r r di ⋅ d j (3) aff (d i , d j ) = r di What is worthy to be noted is that the affinity defined here is asymmetric because aff ( d i , d j ) ≠ aff ( d i , d j ) . If we consider documents as nodes, the document collection can be modeled as a graph by generating the link between documents using the following rule:
2. The more informative a document’s neighbors are, the more informative it is. Thus, the score of document d i can be deduced from those of all other document linked to it and it can be formulated in a recursive form as follows: ~ InfoRich (d i ) = InfoRich (d j ) ⋅ M j , i (6)
∑
all j ≠ i
And in a matrix form: ~
λ = MT λ
where λ = [ InfoRich (d i )]n×1 ~ Since M is normally a sparse matrix, all-zero rows could possibly appear, i.e. some documents have no other documents with significant affinity to them. To compute a meaningful eigenvector, we introduce a dumping factor c (similar to the random jumping factor in PageRank): InfoRich(d i ) = c ⋅
Link generation
threshold); otherwise no link is constructed (or the weight of the link is regarded as zero). Thus, each link in the graph has been assigned a weight indicating the similarity relationship between the corresponding document pair. Since all links are constructed according to the affinity value between document pairs, we call the graph as Affinity Graph. Usually, documents of the same topic are similar to each other. Hence, in Affinity Graph, a group of heavily linked documents naturally represents a topic group, documents connected by weak or no links belong to different topics.
3.2 Information Richness Computation After obtaining Affinity Graph, we apply a link analysis algorithm to compute the information richness for each node in AG. Similar to PageRank [10], we proposed the following algorithm. First, an adjacency matrix M is used to describe AG with each entry corresponding to the weight of a link in the graph. M = ( M i , j ) n×n is defined as below: M i, j
aff (d i , d j ), if aff (d i , d j ) ≥ aff t = 0 , otherwise
(4)
∑ InfoRich(d
all j ≠ i
A directional link from d i to d j ( i ≠ j ) with weight aff (d i , d j ) is constructed if aff (d i , d j ) ≥ aff t (afft is a
(7)
~ is the eigenvector of M T .
~
j ) ⋅ M j,i
+
(1 − c) n
(8)
And as a matrix form: ~
λ = cM T λ +
(1 − c ) r e n
(9)
r Where e is a unit vector with all components equaling to 1. The dumping factor c ∈ (0, 1) is set at 0.85 in our experiments. The computation of information richness can be explained in a way similar to the random surfer model, and we call it random information flow model. Imagine the information is flowing among the document nodes at each iteration and we assume it stops at document at current iteration. Let di A(d i ) = {d j | ∀j ≠ i, aff (d i , d j ) > aff t } be the set of documents which d i links. In the next iteration, the information can choose where to flow according to the following two rules: 1. With a probability c (i.e. the dump factor), the information will flow into one of the document nodes in A(d i ) , and the probability of flowing into the document d j is proportional to aff (d i , d j ) ; 2.
With a probability of 1 − c the information will randomly flow into any document in the collection.
Without loss of generality, M is normalized to make the sum of each row equal to 1. ~ M i, j M i, j = 0
n
n
∑ M i , j , if ∑ M i, j ≠ 0
j =1
j =1
(5)
, otherwise
~ ~ The normalized adjacency matrix M = ( M i , j ) n×n is used to compute the information richness score for each node. Our computation is based on the following two intuitions: 1. The more neighbors a document has, the more informative it is;
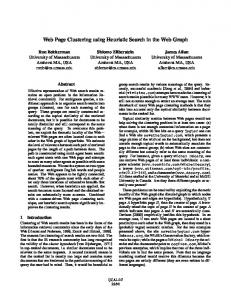
Figure 2: A simple example of Affinity Graph. Figure 2 gives an illustration of the “random information flow” model. On the Affinity Graph, beside links constructed by the “link generation” rule, we label an additional link by dotted line
which indicates the possibility of random information flow as described in Rule 2. A Markov chain can be induced from the above process, where the states are given by the documents and the transition (or flow) ~ 1 (1 − c) matrix is given by cM T + U , in which U = [ ]n×n . The n n stationary probability distribution of each state is given by the principal eigenvector of the transition matrix, which is equivalent to Equation (9).
3.3 Diversity Penalty Computing information richness helps us choose more informative documents to be presented in top search results. However, in some cases two most informative documents could be very similar (or in an extreme case they can be duplicates). To increase the coverage on the top search results, different penalty is imposed to the information richness score of each document in terms of its influences to the topic diversity. The diversity penalty is calculated by a greedy algorithm. At each iteration of the algorithm, penalty is imposed to documents topic by topic, and the Affinity Ranking score gets updated with it. The Greedy Algorithm for Diversity Penalty Step 0.
Initialize the two sets Α = Φ, Β = {d i | i = 1,2,L n} , and initialize the value of each document’s Affinity Rank score to its information richness score, i.e. ARi = InfoRich(d i ), i = 1,2,L n
Step 1.
Sort the documents in Β by their current Affinity Rank scores in descending order.
Step 2.
Suppose the document ranked highest in Β is d i . Move document d i from Β to Α , and then impose a penalty to the score of each document which has a link to d i as follows: For each document d j , j ≠ i
~ AR j = AR j − M j , i ⋅ InfoRich(d i )
(10)
Step 3.
Re-sort the documents in Β by the updated rank scores in descending order.
Step 4.
Go to Step 2 until Β = Φ or the iteration reaches a predefined maximum count.
The crucial part of the above greedy algorithm is Step 2, which embodies a basic idea of penalty -- decrease the Affinity Ranking scores of less informative documents by the part conveyed from the most informative one. The more a document is similar to the most informative one, the more penalties it receives and its Affinity Ranking score is decreased. It ensures only the most informative one in each topic becomes distinctive in the ranking process.
3.4 Re-ranking Method The re-ranking mechanism is a combination of results from fulltext search and Affinity Ranking. There are two schemes of combination: score-combination and rank-combination. A user query is denoted by q . A set of relevant documents by fulltext search is denoted by Θ . The score-combination scheme uses a linear combination of two parts: one comes from the score of fulltext search, and the other from the Affinity Ranking score.
However the two scores are always on different order of magnitudes and their raw values vary in a different range. Therefore, we perform different normalization (average normalization and log average normalization) for the two scores, and then combine the two parts together: Sim(q, d i ) log AR Θ , ∀d i ∈ Θ (11) Score(q, d i ) = α ⋅ +β⋅ log ARi SimΘ (q) where α + β = 1 and Sim Θ (q) = Max∀di∈Θ Sim(q, d i ) ARΘ = Max∀di∈Θ ARi
(12) (13)
The rank-combination scheme of re-ranking uses a linear combination of the ranks based on full-text search and Affinity Ranking, shown as follow: Score(q, d i ) = α ⋅ Rank Sim( q, d i ) + β ⋅ Rank ARi , ∀d i ∈ Θ (14)
The α and β in both two combination schemes are parameters which can be tuned. When β = 0 , no re-ranking is performed, and the search results are equivalent to full-text search; with the increase of β , more weight is put on the Affinity Ranking in the re-ranking process; when α = 0 (and β = 1 ), we totally rely on Affinity Ranking score to re-rank the search results.
4. EXPERIMENTS We conducted experiments on Yahoo! Directory, ODP Data and a Newsgroup data set to demonstrate the effectiveness of our proposed Affinity Ranking scheme.
4.1 Data Yahoo! Directory is one of the most famous Web directories. We downloaded the directory in June, 2004. It contained a total of 292,216 categories (including leaf categories and non-leaf categories). All categories are organized into a 16-level hierarchy. Similar to many previous works [2, 7], we downloaded the index pages of the websites listed in Yahoo! directory as the labeled documents. As a result, we have downloaded 792,601 documents in total. ODP (Open Directory Project) is another famous Web directory. It is probably the largest, most comprehensive human-edited directory on the Web, which is constructed and maintained by a vast, global community of volunteer editors [11]. We downloaded the directory in August, 2004. ODP includes a total of 172,565 categories. Similar to the Yahoo! dataset, we downloaded the index pages of the websites listed in ODP as labeled documents. As a result, we have downloaded 1,547,000 documents in total. The Newsgroup data is composed of 256,449 posts collected from 117 commercial applications related newsgroups over a period of 4 months with a total size of about 400M. A post parser is applied to remove the stop words and unrelated words such as “from”, “to”, “time”, “signature”, and “citations”, et al. The title and content of the post are given a 3:1 weighting ratio in indexing process. Porter stemming [13] is also performed over the entire dataset. For the Newsgroup dataset, there are two specific considerations. (1) There is no explicit link existing among the posts; (2) Newsgroup is a typical collection composed of documents with repetitive content because large amount of posts are very likely to be devoted to the same topic. Traditional information retrieval which purely relies on the full-text content will result in more redundancy due to similar posts in the top search results. Our
proposed Affinity Ranking scheme can be used to solve this problem. We used the Okapi system as our baseline retrieval system. For each query, Okapi provides a set of documents ranked by textbased similarity score.
4.2 Affinity Ranking vs. K-Means Clustering We conducted experiments on Yahoo! Directory and ODP Data set to compare AR and the traditional clustering method K-Means to see which method can cover more query-related topics in top 10 search results. We selected 20 queries from Yahoo! Directory category labels and ODP category labels, respectively. Table 1 and Table 2 give the queries.
Table 1: Queries used in Yahoo! Directory No. Query 1 Art History 2 Art Artists 3 Performing Arts Dance 4 Visual Arts Thematic 5 Consulting Medical 6 Science Astronomy 7 Science Physics 8 Science Alternative 9 Science Astronomy 10 Ecology 11 Education 12 Mathematics 13 Ethnic Studies 14 Political Science 15 Social Science Psychology 16 Women's Studies 17 Crime 18 Families 19 Relationships 20 Sexuality Table 2: Queries used in ODP Data No. Query 1 Internet Protocols 2 Home Cooking 3 Agriculture Horticulture 4 Science Chemistry 5 Food Baked Goods 6 Food Meat 7 Food Produce 8 Music Related Merchandise 9 Bagpipe Bands 10 Consumer Goods Eyewear 11 Dairy 12 Insurance Carriers 13 Literature American Early 14 Mystery 15 Poetry Fixed Verse 16 Poetry Forms 17 CGI 18 Diseases Liver 19 Dogs Training 20 E-Books
The top 1000 search results of each query are passed to AR or KMeans algorithm to re-rank top 10 results. For K-Means algorithm, we set K=10 and use the top 1 document of each cluster to construct the top 10 results. F value is used to measure the performance of Affinity Ranking and K-Means clustering. The recall ( R ), precision ( P ), and F are defined as follows: R=
| N label ∩ N sys | N label
P=
| N label ∩ N sys | N sys
F=
2RP R+P
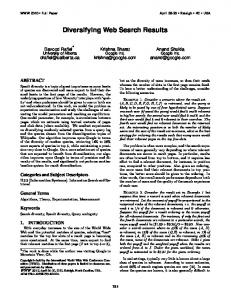
N label denotes the number of different sub-category labels in Yahoo! Directory or ODP. N sys denotes the corresponding subcategory label number in the top 10 search results re-ranked by AR or K-Means algorithm. Figures 3 and 4 show that AR significantly improves the coverage of topics compared to KMeans method on both Yahoo! and ODP Data.
Figure 3: F Values of AR and K-Means in Yahoo! Directory
Figure 4: F Values of AR and K-Means in ODP Data
4.3 Affinity Ranking in Newsgroup dataset 4.3.1 Evaluation Metrics and Ground Truth We used 20 queries listed in Table 3 to retrieve from the newsgroup dataset of documents, and apply the proposed AR scheme to re-rank top 50 documents returned from the baseline system (OKAPI) [14]. The queries vary from 1 word to 3 words, covering several commercial software products.
Table 3: Queries used in our experiments No. 1 2 3 4 5 6 7 8 9 10
Query Blue screen Office update activate product Excel formula Office assistant outer join Pie print preview SMTP word font
No. 11 12 13 14 15 16 17 18 19 20
Query System requirement Access update Excel crash Office 2003 Office uninstall Outlook print error pop3 server save attachment virus scan Word print
We compare our approach with the Okapi system in three aspects: diversity, information richness and relevance. The diversity for a document set and information richness for a single document have already been defined in Section 3. Similarly, the average relevance of a set of document Rl = {d1 , d 2 ,L d l } to a given query q is defined as follows: Rlv ( Rl , q ) =
1 l
l
∑ Rlv(d , q) i
(15)
i =1
where Rlv ( d i , q ) ∈ [0,1] is the relevance of document d i to query q. Four researchers in web search and mining area are hired to independently evaluate the experimental results. They labeled the top 50 search results for each of the 20 queries based on the following steps: 1. Make an overview of the 50 search results, and then manually cluster them into arbitrary number of groups. Each group should have one common topic and there should be no significant overlap between the group topics; 2. In each topic group, give each document a score indicating their information richness for that topic. The score ranges from 0 to 3 (3 - very informative, 2 - informative, 1 - less informative, 0 - not informative); 3. Give each document a score indicating their relevance to the query (2 - relevant, 1 - hard to tell, 0 – irrelevant). Finally, the scores in the step 2 and step 3 are normalized into [0, 1] according to the definitions of information richness and relevance. The labeled data served as the ground truth to evaluate the diversity, information richness and relevance of the top N search results ( N ≤ 50 ).
subscripts A and F represent results from our ranking scheme and full-text search, respectively.
4.3.2 Improvement in Top 10 Search Results As the top 10 search results always receive the most attention of end-users, we also conduct experiments to show how Affinity Ranking affects the top 10 search results from the newsgroup data set. Table 4 shows the relative improvement of AR re-ranking over Okapi system.
Table 4: Improvement in top 10 search results Diversity Relative Change p value at t-test
+31% 0.004632
Information Richness +12% 0.002225
Relevance +0.72% 0.067255
In this experiment, we use the rank-combination scheme and which α = 1 and β = 0 . From Table 4, we can see that our proposed Affinity Ranking achieves 31% and 12% improvements in diversity and information richness compared over the full-text search system. T-test result indicates that this improvement is statistically significant. The experiments results confirm that our proposed algorithm can improve the diversity and information richness of the top 10 search results without loss in relevance.
4.3.3 Improvement within Top 50 Search Results We also measure the improvements of AR within different number of search results. Figure 5 illustrates the relative improvement in diversity as the number of search results increases. It is shown that our method always improves the diversity in the search results. Initially, the diversity improvement increases sharply with the N value and reaches a maximum when N = 10 , which is usually the number of results fitting into the first search result page and browsed by most end-users. Then the diversity improvement gradually falls down to zero* when N reaches 50. We can conclude from the figure that the relative order of results is changed so that documents from different topics are shifted forward to the top of the returned search list; and consequently the topic diversity of the top returned results is improved.
Since the labeled ground truth (e.g. the number of topics in the top 50 search results) varies from user to user, our improvement measures are presented in the form of macro relative change which is defined as:
∆ macro
∆i =
∑ =
N
∆i
i =1
N
X Ai
−
X Fi
X Fi
(16)
Figure 5: Diversity improvement by Affinity Rank within top 50 search results
(17)
where N is the number of users, i.e. 4, X could be diversity, information richness, or relevance of the top search results, the superscript i denotes the i-th user’s ground truth, and the
*
Since re-ranking the top 50 results only changes their order, the relative change in diversity for all the 50 results is zero, c.f. the definition of diversity. (The same for “information richness” in Figure 4).
Figure 6: Information Richness improvement by Affinity Rank within top 50 search results Figure 6 illustrates the relative improvement in information richness as the number of top results increases. We found that an approximate 10% improvement can be achieved within the top 15 search results after re-ranking. With N increasing, the improvement gradually gets less distinct since more overlapping between full-text search results and re-ranked results appears. We conclude from this figure that more informative documents had been promoted towards the top position.
4.3.4 Improvement in Top 10 Search Results As mentioned in previous section, there are two ranking combination schemes to be used and a pair of parameters to be tuned. The ratio between the parameter pair, i.e. α : β , determines the weight of the Affinity Ranking score versus the full-text search score. Taking the top 10 search results as an instance, we give a range of values for α : β and compare the relative improvement in diversity and information richness. We also compare the two ranking combination schemes, and the results are shown in Figure 7 and Figure 8, respectively. Regardless of which scheme is used, as long as β : α is big enough (i.e., putting enough weight on Affinity Ranking), the improvement in both diversity and information richness will stay around the maximum value without much change. What’s more, the range for large value of α : β is quite significant. Although the optimum value of α : β is hard to formulate, the empirical results show that if we simply re-rank totally by Affinity Ranking, i.e. α = 0 a n d β = 1 (shown as α : β = 0 in the figures), the improvement in both diversity and information richness is very close to the maximum value we can achieve.
Figure 7: Parameter tuning for top 10 search results in the score-combination scheme
Figure 8: Parameter tuning for top 10 search results in the rank-combination scheme From the above two figures, it is easy to see that the rankcombination scheme is slightly better than score-combination when the ratio of β : α is sufficiently large.
4.4 A Case Study We provide a case study here to give an illustration on how our ranking method works. This example is extracted from our experiments on the Newsgroup search for the query “Outlook print error”. In this scenario, a user has a printing error while using Microsoft Outlook. He comes to the Newsgroup to ask for help. Quite naturally, he starts with “Outlook print error” to search and hopes to find a solution to the problem. Since there are many possible reasons that can lead to an Outlook print error, it is hard for him to find the right posts answering his specific error problem in a short time. By using full-text search, we can obtain an initial rank, part of which is shown in Table 5. The Affinity Rank score is given for each listed result with its topic indicated by some abbreviations. Since those search results are all newsgroup posts, we also label their threads with Roman numbers. For convenience, we name the retrieved post in the i-th position in the initial rank as post pi .
Table 5: Search results for “outlook print error” Initial Rank 1 2 3 4 5 6 7 8 9 10 13 17 24 25
Affinity Rank Score 8.5024e-006 2.18028e-006 4.08513e-006 1.36859e-006 6.92891e-006 2.82147e-006 8.56054e-006 2.95666e-006 1.21661e-006 6.27889e-006 2.95666e-006 6.92891e-006 6.27889e-006 8.56054e-006
Topic
Thread
u. e. u. e. u. e. u. e. u. e. i. a. u. e. u. e. u. e. u. e. n. i. u. e. p. f. u. e.
I II III I I IV I I I I I V VI VII
New Rank 2 4 3 9 11 1 12 6 14 19 8 5 10 7
In the top 50 retrieved posts, there are roughly 6-8 reasons for the Outlook print error, such as: 1. With prompted error code of “Unspecified Error”, abbreviated as “u. e.” in the table; 2. With prompted error code of “invalid argument”, abbreviated as “i. a.” in the table; 3. Error caused by some function not implemented, abbreviated as “n. i.” in the table; 4. A special error occurred only when print mails in the public folder in Outlook, abbreviated as “p. f.” in the table. Note that the topic of posts can not be judged simply by newsgroup threads. For instances, in Table 5, p1 and p 2 come from different threads but belong to the same topic, while p13 discusses a new topic other than most other posts’ in its thread. As can be seen from Table 5, the initial top 10 retrieved posts there only contain two topics involved – u. e. and i. a., and the top 10 is dominated by posts discussing the “u. e.” error. After reranking, the topic number in top 10 results increases to four. Posts p13 and p 24 are promoted to top 10 and bring two new topics. Also, p6 moves to the first position. Further analysis shows that p6 , p13 and p 24 are the most informative posts describing the “i. a.”, “n. i.” and “p. f.” problems, respectively. The ranks of the three posts are promoted because they have relatively large Affinity Rank scores (shown in Table 5). This case provides a typical example on how Affinity Ranking helps improve the diversity and information richness in the top search results.
5. CONCLUSIONS High-quality search results depend on many factors. The wellrecognized metrics such as relevance and importance do not necessarily guarantee the satisfaction from end-users. In this paper, we proposed two new metrics, diversity and information richness, to measure the search performance. Further, a novel ranking scheme, Affinity Ranking, is proposed to re-rank the search results to improve the diversity and information richness of the top search results. Our experiments showed that the proposed metrics and new ranking method can effectively improve the search performance by presenting wider topic coverage and more highly informative results in each topic in the top results. The improvement is significant compared with the traditional full-text search and brings no loss to relevance. Our future work includes scaling our Affinity Ranking computation, for example, to the Web scale.
6. REFERENCES [1] Baeza-Yates, R. and Ribeiro-Neto, B. Modern Information Retrieval. Addison Wesley Longman, 1999. [2] Calvo, R.A., Lee, J.-M. and Li, X. Managing Content with Automatic Document Classification. Journal of Digital Information, 5 (2). [3] Carbonell, J. and Goldstein, J., The use of MMR, diversitybased reranking for reordering documents and producing summaries. In Proceedings of the 21st annual international ACM SIGIR conference on Research and development in information retrieval, (Melbourne, Australia, 1998), 335-336.
[4] Chen, Z., Tao, L., Wang, J., Liu, W. and Ma, W.-Y., A Unified Framework for Web Link Analysis. In Proceedings of the 3rd International Conference on Web Information Systems Engineering, (Singapore, 2002), 63-72. [5] Croft, W.B., Cronen-Townsend, S. and Larvrenko, V., Relevance feedback and personalization: A language modeling perspective. In Proceedings of the DELOS Network of Excellence Workshop on "Personalisation and Recommender Systems in Digital Libraries", (Dublin City University, Ireland, 2001). [6] DirectHit. http://www.directhit.com. [7] Dumais, S. and Chen, H., Hierarchical classification of Web content. In Proceedings of the 23rd annual international ACM SIGIR conference on Research and development in information retrieval, (Athens, Greece, 2000), 256-263. [8] Gibson, D., Kleinberg, J.M. and Raghavan, P., Inferring Web communities from link topology. In Proceedings of the 9th ACM Conference on Hypertext and Hypermedia, (Pittsburgh, PA, 1998), 225-234. [9] Kleinberg, J.M. Authoritative sources in a hyperlinked environment. Journal of the ACM (JACM), 46 (5). 604-632. [10] Lu, Q. and Getoor, L., Link-based Classification. In Proceedings of the International Conference on Machine Learning, (Washington DC, 2003), 496-503. [11] ODP. http://dmoz.org/. [12] Page, L., Brin, S., Motwani, R. and Windograd, T. The pagerank citation ranking: Bring order to the web, Stanford Digital Library Technologies Project, 1998. [13] Porter, M.F. An algorithm for suffix stripping Program, 1980, 130-137. [14] Robertson, S.E., Walker, S., Hancock-Beaulieu, M., Gull, A. and Lau, M., Okapi at TREC. In Proceedings of the Text REtrieval Conference, (1992), 21-30. [15] Wong, S.K.M. and Raghavan, V.V., Vector space model of information retrieval: a reevaluation. In Proceedings of the 7th annual international ACM SIGIR conference on Research and development in information retrieval, (Cambridge, England, 1984), 167-185. [16] Xi, W., Zhang, B., Chen, Z., Lu, Y., Yan, S., Ma, W.-Y. and Fox, E.A., Link fusion: a unified link analysis framework for multi-type interrelated data objects. In Proceedings of the 13th international conference on World Wide Web, (New York, NY, USA, 2004), 319-327. [17] Xue, G.-R., Zeng, H.-J., Chen, Z., Ma, W.-Y., Zhang, H.-J. and Lu, C.-J., Implicit link analysis for small web search. In Proceedings of the 26th annual international ACM SIGIR conference on Research and Development in Information Retrieval, (Toronto, Canada, 2003), 56-63. [18] Zhai, C.X., Cohen, W.W. and Lafferty, J., Beyond independent relevance: methods and evaluation metrics for subtopic retrieval. In Proceedings of the 26th annual international ACM SIGIR conference on Research and development in information retrieval, (Toronto, Canada, 2003), 10-17.