Acoust. Sci. & Tech. 28, I (2007)
Impulse response measurement that maximizes signal-to-noise ratio against ambient noise Naoya Moriya" and Yutaka Kaneda" Department of Information and Communication Engineering, School of Engine ering, Tokyo Denki University, 2-2 Kanda-Nishiki -cho, Chiyoda-ku, Tokyo, /01-8457 Japan (Received 3 May 2006, Ac cepted for publi cation /0 July 2006)
Keywords: Impulse response, SNR, Swept-sine, TSP, M-sequence PACS number: 43.58.-e, 43.58.Gn, 43.60.-c [doi:10.1250/ast.28.43]
1. Introduction Impulse response measurement is very important in acoustic measurement and signal processing. However, measurement errors occur due to ambient noise. M-sequence [I] and swept-sine signals (such as TSP signal [2]) are widely used to solve this problem. In recent years, effective signals have been proposed for impulse response measurement in the presence of low-frequency ambient noise [3,4]. In this study, we produced measurement signals that have maximal signal to-noise (SN) ratios against ambient noise with an arbitrary spectrum.
i ,:,
2. Optimal spectrum of measurement signal 2.1. Noise-induced error Figure lea) shows the principle of impulse response measurement in the frequency domain. A signal with the frequency spectrum Sew) (hereafter abbreviated as S) is applied to a target system whose transfer function is H. By multiplying the observed output H . S by I/S, the transfer function H of the system is obtained (the inverse Fourier transform of H represents its impulse response). Figure l(b ) shows the case in which the ambient noise No is added to the observed output H . S. Here, the noise is assumed to be stationary. In this case, No/S is added to the measurement result as a noise-induced error. 2.2. Optimal spectrum Let w(= 1,2 , ,N ) be the discrete frequency . The energy spectrum of the measurement signal S is denoted as Ps(w)(= IS(w)!2). The entire energy of the signal is given by 00
'
N
PSt = L
Ps(w) .
(I)
w= 1
Furthermore, by denoting the energy spectrum of the ambient noise as PN(w)(= E[INo(w)12] , where E[ .] is the expectation value), the entire energy PNt of the noise-induced error No/S is N
P Nt
= LPN(W)/PS(w).
(2)
w= 1
Here, assuming that the entire energy of the measurement "Current affiliation: Yamaha Co. te-mail:
[email protected]
signal P« is kept constant at C, the energy spectrum of the measurement signal, PSopt(w ), that makes noise-induced error (P Nt) minimum is derived by solving simultaneous equations consisting of unknown Ps(w) (where w = 1,2, oo .,N) and A [5]
a
8P s(W)
(PNt
+ A(Pst - C» =
(3)
O.
Then, the optimum spectrum PSopt(w) is given as PSopt () W
C~
_ -
rfJfi\
",PN(I)
(4)
~
+ ",PN(2 ) + ...+ JPN(M) .
From this equation, it is clear that the energy spectrum of the signal that minimizes the noise-induced error and maximizes the SN ratio, P sopt(w), is proportional to the square root of the energy spectrum of noise, PN(W) . 2.3. Synthesis of optimum measurement signal The two commonly used representative signals are M sequence and swept-sine signals. Generally, the spectrum of these signals is white. However, the noise-induced error can be minimized by introducing the optimum spectrum, as discussed in section 2.2. • Random signal Prior to actual calculations, the energy spectrum of the noise, PN(W), is measured and a random signal that has the fourth-order root of the spectrum PN(W) as its amplitude is synthesized. More practically , one period of an M-sequence signal is converted into a signal in the frequency domain. We then multiply the frequency-domain signal by the optimal amplitude spectrum (the fourth-order root of PN(w». There after, the signal is reconverted back to a time-domain signal and we designate it as the measurement signal. • Swept-sine signal If the amplitude characteristics are altered while main taining the phase characteri stics of a swept-sine signal, the constant-amplitude characteristics of its waveform, which are the advantage of this approach, disappear. Therefore, we produce the optimum energy spectrum PSopt(w) by adjusting the sweeping time for each frequency. By utilizing the fact that the phase characteristics of a constant-amplitude swept sine signal can be obtained if the energy spectrum is integrated twice, we can obtain the desired swept-sine signal [5].
43
Acoust. Sci. & Tech. 28, 1 (2007) (a)
i,
System
conventional method
S
~
HS
il
k'" (M-sequence)
CD E -10
2
:I
proposed method
13 Q)
Ii 'I
System
(b)
S = 1/S £~1
....
0
-I;l - + HS+N ~ S
o
x
I
c. -15 til
....................................................
e
............ ...
UJ -20
H+No/S
o Fig. 1 Principle of impulse response measurement and noise-inducederror characteristics: (a) without ambient noise, (b) with ambient noise.
1000
2000
3000
4000
Frequency [Hz]
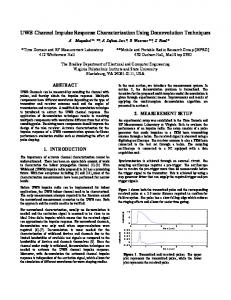
Fig. 3 Comparison of noise-induced error spectra when ambient noise is low-frequency noise.
O r---~---~--~-----'
noise-induced error ~
Q)
_ _~A~
~
\
"0
~ 0..0
CD
e-:
-5
~
~ -10
E
«
: .... : 0.
13 Q)
f \:
c. en
:
f ! j
o
10
20
30
40
50
60
70
80
Time [ms]
Simulation conditions To confirm the effectiveness of the proposed method, we simulated the procedure. The object of measurement in this study is an impul se response of a loudspeaker. In the conventional method, an M-sequence signal with length 2 13-1 was used. In the proposed method, a signal in which the optimal spectrum is assigned to the M-sequence was used. Furthermore, a) low-frequency noise and b) 500-1 ,000 Hz band noise are added to the signal as ambient noise. 3.2. Results Figure 2 shows an example of the measurement results. Measurement errors like a stationary noise contaminate the impul se respon se. We calculated the spectrum of the noise induced errors included in each measurement result. Figure 3 shows the results for the case of a low-frequency noise. When the conventional method is used, the error spectrum is the same as that of ambient noise No(w) because S == 1 in Fig. l(b). On the other hand , in the proposed method, the low-frequency component, the energy of which is large, was suppres sed . The noise suppression effect of the propo sed method for the entire band was approximately 3 dB .
\ \ :
0.3
o
proposed method :° 0
1000
.. .
t1 :\ f\ :"': t~ f\ f
2000
3000
4000
Frequency [Hz]
Fig.2 Measurement result contaminated by noise-induced error.
3. Error reduction simulation
conventional method (M-sequence)
Fig. 4 Comparison of noise-induced error spectra when ambient noise is band noise.
3.1.
44
Figure 4 shows the results for the case of band noise. In the proposed method, the error spectrum is reduced in a manner similar to that in the case shown in Fig. 3, although it is slightly enlarged in the high-frequency range . The noise suppression effect for the entire band was approximately 6 dB.
4. Conclusions We proposed a spectrum of an impul se response measure ment signal that maximizes the SN ratio of the measurement result to ambient noise. In practice, this method is used by synthesizing random and swept-sine signals with the above spectrum. In our simulations, we were able to reduce noise induced errors by approximately 3-6 dB.
References [1] J. Vanderkooy, "Aspects ofMLS measuring systems," J. Audio Eng. Soc., 42, 219-231 (1994).
[2] Y. Suzuki, F. Asano, H. Y. Kim and T. Sone, "An Optimum computer-generated pulse signal suitable for the measurement of very long impulse responses," J. Acoust. Soc. Am., 97, 1119
07)
N. MORlY A and Y. KANEDA: IMPULSE RESPONSE MEASlTREMENT MAXIMIZING SNR 1123 (1995). [3] T. Fujimoto, "A study of TSP signal getting higher SN ratio at low frequency bands," Proc. Autumn Meet. Acoust. Soc. lpn., pp. 433-434 (1999). [4] M. Morise, T. Irina, H. Banno and H. Kawahara, "A method for
designing acoustic measurement signals robust against back ground noise," IEICE Tech. Rep., EA2004-44 (2004). [5] N. Moriya and Y. Kaneda, "A study on the optimal signal for impulse response measurement," IEICE Tech. Rep., EA2004 136 (2005).
)00
JOO
ioise. in a
.ough noise 6dB.
.sure ment ~d by ibove
ioise
4udio
imum ement ll19
45