In-Depth Guide – Advanced Database Concepts. Learning Objectives. By
reading and completing the activities in this chapter, you will be able to: •
Retrieve ...
In-Depth Guide – Advanced Database Concepts Learning Objectives By reading and completing the activities in this chapter, you will be able to: Retrieve specified records from a database using Query by Example Create simple forms based on a specification Create simple reports based on a specification
Introduction In a previous In-Depth Guide, you learned how to create and populate a Microsoft Access database. In this guide, we help you learn how to retrieve data using queries, and how to create simple forms and reports. Forms are used to enter records into a database and to retrieve and display small amounts of data. Reports also display data, but work better than forms for larger amounts of data.
Database Queries A query is an operation that retrieves specified records from a database. For example, you could retrieve all records related to a particular order from an order processing database. You specify which records to retrieve based on criteria related to values of fields within one or more tables. These criteria use operators such as equals (=), greater than (>) and less than (). If you want to include all of a table’s fields, select the double greater-than symbol (>>). You can remove a field from the Selected Fields list by clicking on the less-than symbol (= #1/1/1998# as our criterion.) The pound symbols (#) tell Access that you are using a date for the criterion. (See http://office.microsoft.com/en-us/access-help/examples-of-query-criteria-HA010066611.aspx for more information on using dates as criteria.)
Figure 17 – Query for a Report
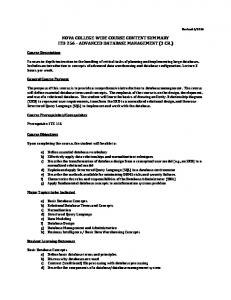
After creating the underlying query, we start the Report Wizard, which is on the Create ribbon. After selecting the correct query and fields, we need to tell the wizard how we want to view the data on our report, as shown in Figure 19. This is similar to the Main/Subform Wizard. In this case, we want the report to show the data by customer. Then within each customer, we want to see data about the customer’s order. In a report, you can have multiple grouping levels, which can also be added through a later dialog box. After selecting how we want to view the data, we tell Access how to sort the data and then select the report’s orientation (portrait or landscape). Note that Access automatically sorts by any grouping levels (CustomerID in our case). For this report, sorting by OrderDate within each customer makes sense. Of course,we also need to save our report. Rememer to give the report a meaningful name.
We want to see data by customer
So it will lay out like this
Figure 18 – Report Wizard
When finishing the report, you choose whether to preview the report or open the report in the design view so that you can make changes. If you preview the report, Access opens the report in a print preview mode. To exit this view, just click on the “Close Print Preview” button. Like forms, you can modify reports using either the layout or design views. See http://office.microsoft.com/en-us/access-help/ways-to-change-a-reportRZ010292018.aspx?CTT=1§ion=9 for more information on how to modify reports using these views. If you need to change the criteria for selecting which records to include in a report, all you have to do is change the criteria in the underlying query, then rerun the report. The new report will use the updated criteria.
Summary This In-Depth Guide covers how to perform queries and create forms and reports using Microsoft Access. Specifically, we covered: Database queries Creating queries using Query-by-Example Creating forms Creating report LEARNING ACTIVITIES The following activities use the Northwind Traders database, which is available from: http://www.microsoft.com/download/en/details.aspx?id=19704 1. Create a query that shows the Country, City, CustomerID, and Customer CompanyName for all customers located in France, Spain, or Sweden. Sort the query by Country, then CompanyName. 2. Create a query that shows the ProductID, ProductName and UnitPrice for all products with a UnitPrice greater than $50. Sort the query in descending order of UnitPrice. 3. Create a query that shows the CategoryName, ProductID, ProductName and UnitPrice for all products in the Produce or Seafood categories. Sort the query in order of CategoryName, then ProductName. 4. Create a query that shows the Supplier CompanyName, CategoryName, ProductID, and ProductName for all products in the Produce or Seafood categories. Sort the query in order of Supplier CompanyName, then CategoryName, then ProductName. 5. Create a query that shows the OrderID, OrderDate, Customer CompanyName and Country for all orders placed by customers in the UK. Sort the query by CompanyName. 6. Create a query that shows the OrderID, OrderDate, Customer CompanyName, ProductName, Quantity, and UnitPrice for all products included in the order. Use UnitPrice from the Order Details table (not the Products table). Only show orders from the Companies named “Lonesome Pine Restaurant” or “Rattlesnake Canyon Grocery.” Sort the query by order date, then CompanyName. 7. Create a form that will let you enter data for all fields included in the Customers table. 8. Create a form that shows the CategoryID, CategoryName and Description for each category, along with the ProductID, ProductName and UnitPrice for all products in that category. The form should be similar to the one shown below.
9. Create a well-formatted report that shows the data from the query in Activity #2. 10. Create a well-formatted report that shows the Supplier’s CompanyName, CategoryName, ProductName, and UnitPrice for all Products. 11. Create a well-formatted report that shows the data from the query in Activity #6.