Incorporating Concept Hierarchies into Usage Mining Based Recommendations Amit Bose
Kalyan Beemanapalli
University of Minnesota
University of Minnesota
4-192 EE/CS Building, 200 Union Street SE
4-192 EE/CS Building, 200 Union Street SE
Minneapolis, MN 55455, USA
Minneapolis, MN 55455, USA
001 (612) 625 6597
001 (612) 625 6597
[email protected]
[email protected]
Jaideep Srivastava
Sigal Sahar
University of Minnesota
Intel Corporation
4-192 EE/CS Building, 200 Union Street SE
FM1-56, 1900 Prairie City Road
Minneapolis, MN 55455, USA
Folsom, CA 95630, USA
001 (612) 625 6597
001 (916) 356 7642
[email protected]
[email protected]
ABSTRACT
Keywords
Recent studies have shown that conceptual and structural characteristics of a website can play an important role in the quality of recommendations provided by a recommendation system. Resources like Google Directory, Yahoo! Directory and web-content management systems attempt to organize content conceptually. Most recommendation models are limited in their ability to use this domain knowledge. We propose a novel technique to incorporate the conceptual characteristics of a website into a usage-based recommendation model. We use a framework based on biological sequence alignment. Similarity scores play a crucial role in such a construction and we introduce a scoring system that is generated from the website’s concept hierarchy. These scores fit seamlessly with other quantities used in similarity calculation like browsing order and time spent on a page. Additionally they demonstrate a simple, extensible system for assimilating more domain knowledge. We provide experimental results to illustrate the benefits of using concept hierarchy.
Web usage mining, recommendation system, concept hierarchy, sequence alignment, similarity model.
Categories and Subject Descriptors H.2.8 [Database Management]: Applications – data mining; I.5.5 [Pattern Recognition]: Clustering – Similarity measures; H.3.3 [Information Storage and Retrieval]: Information Search and Retrieval
General Terms Algorithms, Performance, Design, Experimentation. Permission to make digital or hard copies of all or part of this work for personal or classroom use is granted without fee provided that copies are not made or distributed for profit or commercial advantage and that copies bear this notice and the full citation on the first page. To copy otherwise, or republish, to post on servers or to redistribute to lists, requires prior specific permission and/or a fee. WEBKDD'06, August 20, 2006, Philadelphia, Pennsylvania, USA. Copyright 2006 ACM 1-59593-444-8...$5.00.
1. INTRODUCTION Web Mining is described as the application of data mining techniques to extract patterns from usage information [5]. Internet usage continues to grow at a tremendous pace as an increasing number of activities are performed online. Computers on the Internet that host websites, the web servers, are capable of collecting information about website usage. Given the popularity of the Internet the volume of such data is enormous. The rapid increase in secondary storage size and decrease in their cost has made it feasible to store all this information. This information is a valuable repository for mining and discovering interesting patterns. Researchers have focused on using the extracted patterns to predict the next user request during an online session with the website. Such systems are called Recommender Systems and are useful tools to predict user requests. This predictive ability has application in areas like pre-fetching of pages, increase in overall usability of the website, etc [26]. Various data mining methods have been used to generate models of usage patterns. Models based on association rules [16], clustering algorithms [15], sequential analysis [17] and Markov Models [2, 28] have been well studied in the literature. All these models are predominantly based on usage information from weblogs alone. They are not easily extensible to include other pieces of information that may be available. Gündüz et al [12], for instance, use a new technique which combines usage behavior with the time spent by the user on each of the pages visited. The inclusion of the additional dimension, time spent on page, appears to improve the recommendations made. Significant improvement can also be achieved by making use of domain knowledge, which is usually available from domain experts, content providers, web designers and the web-pages themselves.
Few recommendation models have been suggested which make use of the domain knowledge [1]. Nakagawa et al [19] propose a recommendation model based on website topology. Here the emphasis is on the link structure of the website and the degree of connectivity. The paper argues that these characteristics of the website have a profound impact on the behavior of the recommendation models. Jia et al [13] discuss a new recommendation model based on usage data, content data and structure data in a website for generating better user navigational models. It is appropriate to mention the contribution of Sieg et al [25] which makes use of concept hierarchy of a website for information retrieval. Nasraoui et al [20] assume that the URLs of web-pages convey an implicit hierarchical relationship between pages. They quantify this relationship as a distance measure and use it for clustering. Pierrakos and Paliouras [21] create Community Directories from web directories through the use of usage information by viewing the web directory as a concept hierarchy. Nakagawa et al [18] give a detailed evaluation of the impact of website characteristics on the recommendation models. Though a few methods have been proposed to incorporate knowledge of the website’s target domain, very few techniques exist which use a combination of usage behavior and domain knowledge to make recommendations. Domain knowledge can exist in various forms: concept hierarchy, website topology and semantic classification. This knowledge in conjunction with usage behavior data can be used to improve the performance of the recommendation engine. In this paper we introduce a new model that effectively combines usage information with information from the conceptual structure of the website to generate our recommendations. Such a structure is termed the concept hierarchy of the website. It is important to emphasize here that we limit ourselves only to the hierarchy of pages of an individual website and do not deal with a hierarchy of the entire web. A suitable analog of web directory like Google Directory [10] or Yahoo! Directory [29] for a website, or the information from content-management systems could be used to approximate the concept hierarchy. Overall, the dimensions that are considered for making recommendations are the sequences of web pages browsed in sessions, time spent on these web pages and the position of pages in the concept hierarchy. Experimental results show that incorporating the concept hierarchy to make recommendations indeed improves the efficiency of the recommendation engine. Moreover, our model is flexible enough to be extended to incorporate other kinds of domain information like website topology and semantic classification of documents of the website. The remaining paper is organized as follows: in Section 2 we briefly review the model proposed by Gündüz et al [12] which provides the framework for our proposition. In Section 3 we detail the methods used for incorporating concept hierarchy into the model. In Section 4 we describe the experiments we performed and discuss the results. We conclude in Section 5 and discuss future work. Finally in section 6 we acknowledge other people who contributed to this work.
2. BACKGROUND In this section we briefly describe the method proposed by [12] which forms the basis for our model. The proposed method is based on optimal sequence alignment of two user sessions. The remaining part of the section covers the sequence alignment
method for defining session similarity and the prediction model using clickstream tree representation of data.
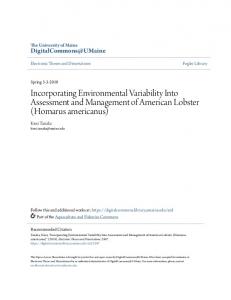
2.1 Optimal Sequence Alignment based Session Similarity Optimal sequence alignment is defined as the optimal alignment of two sequences such that their alignment score is maximized. Algorithms for finding such optimal alignments are well studied and are based on dynamic programming. A user session can be represented as a sequence of pairs, each pair containing the web page accessed and the normalized time spent on that page. For instance a user session S can be represented as: S = (, , , …,) where, P1, P2, P3, P4,… are the pages in the session, and T1, T2, T3, T4,… are the respective normalized times. Given two such user sessions, using dynamic programming one can calculate the optimal alignment of the sessions. A scoring method is employed to denote matching and mismatching of pages. A simple method would be to use a score of 2 for a match and -1 for a mismatch. For instance, consider the following two sequences of web-pages Q1 and Q2: Q1 = (P1, P2, P3, P4, P5) Q2 = (P2, P4, P5, P6) Using dynamic programming and applying the simple scoring method [11], the alignment matrix for these two sequences would look like Figure 1. The highest score in this table is defined as the alignment score of the sessions. Using another table for backtracking, the optimal alignment obtained is: __ P2 __ P4 P5 P6 P1 P2 P3 P4 P5 __ Intuitively, we are finding sessions that are similar in terms of their order of occurrence in the pages in the two sessions. The similarity score between the two sessions is determined using the optimal alignment score calculated in this manner by additionally considering the time spent on these web pages. The formulae used for calculating the similarity score are detailed in [12]. Every distinct pair of sessions is aligned in this fashion, and the resulting alignment scores form a session similarity matrix. Value in cell (i,j) of this matrix gives the similarity score for sessions i and j.
P1
P2
P3
P4
P5
-
P2
1
2
1
1
-2
-4
P4
-1
0
1
2
-1
-3
P5
-4
-3
-2
-1
0
-2
P6
-5
-4
-3
-1
-1
-1
-
-5
-4
-3
-2
-1
0
Figure 1. Calculation of similarity score between sequences using dynamic programming
Root
Data Table Page identifier 1_1 7_2
1_1
2_1
2
2
Normalized time
3_1 6_3
7_2
2_1
4_2
1
1
2
3_1
3_1
3_1
7_1
1
1
1
1
6_3
4_1
6_3
6_2
1
1
1
1
Session count
2_1 4_1 5_3 4_2 6_2 7_1 5_3 1
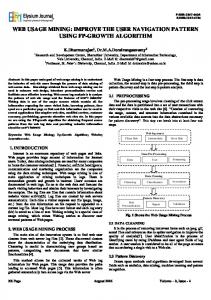
Figure 2. Example clickstream tree
2.2 Clustering of Sessions The session similarity matrix is the input to a clustering algorithm based on graph partitioning. The algorithm creates a graph in which the vertices are the sessions and the edge between every pair of vertices is weighted by the similarity score between the corresponding two sessions. The problem of clustering user sessions is formulated as partitioning the graph into sub-graphs by minimizing the Min-MaxCut function [8]. The sub-graphs are generated such that similarity between inter-cluster sessions is minimized and similarity between intra-cluster sessions is maximized. We make use of the clustering package Cluto [3] to achieve this.
2.3 Prediction Model using Clickstream Trees The clusters of user sessions can be efficiently represented using a data structure called the clickstream tree [12]. The tree is indexed by a data table for easy look-up of nodes in the tree while searching. Each node in the tree consists of three components: page identifier, normalized time spent on the page and a count variable. Each page in the web-site is identified uniquely through the page identifier. Time spent on a page is indicative of the importance of the page within a session and it is normalized as mentioned in [12]. The purpose of the count variable is to keep
track of how many sessions in the cluster have traversed the path to that node. The data table holds the pointers to the nodes in the tree. Hence, to find a particular node in the tree, we search the data table to find the pointer to the node and use this to access the actual node in the tree. Each node in the tree also points to a similar node (having same page number and normalized time) existing in the different part of the tree. This link helps us to navigate efficiently and quickly through all the nodes in the tree which match the search criteria. Figure 2 shows an example clickstream representation for the following sessions: S1 = ( , , , ) S2 = (, , , , ) S3 = (, < P4,2>, , < P6,3>) S4 = (, , , ) During the online phase, a user’s session is matched against the sessions in the clusters and a recommendation score is assigned to each such match. A session from the cluster with highest recommendation score is generated and the next page from this session is recommended to the user.
Student Services
Advising
How-to Guides
Registration
Returning
...
Grading
after absence Pre-registration ...
Career Services
Options
Credit Requirements
...
...
...
... 13-creditpolicy.htm
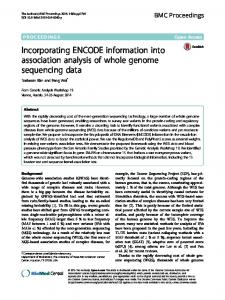
Figure 3. Example concept hierarchy for a university student-services website
3. CONCEPT HIERARCHY AND RECOMMENDATIONS In this section we explain the role of concept hierarchy for measuring similarity between user sessions, and then introduce a method for calculating this similarity value. Finally, the overall workflow of the system is described to show how the different components fit together.
3.1 Motivation The method of sequence alignment is based on the idea of quantifying similarity between pages. To calculate this similarity, a distance measure is required that scores similar pages with lower values and dissimilar pages with larger values. There are two related challenges in defining a distance measure: (a) on what basis do we decide that two given pages are similar or dissimilar, and, (b) what is the procedure for calculating a metric that expresses the strength of this similarity. The model for calculating distances should be such that it captures notions of similarity in terms of quantities that can be actually measured and manipulated. The semantics of aligning sequences (of web-pages, proteins etc) provides a suitable starting point in the quest for a good model. In the context of web-usage mining, the string of web-pages that we call a sequence is actually a session of usage of the website. It is reasonable to assume that each session is guided by the user’s need to achieve specific goal(s) during the browsing session. The session is therefore representative of the intent of the user browsing the website. We can expect the pages viewed in a session to be focused around a particular intent. This interpretation of a session is fundamental in trying to align sequences of web-pages. When we try to align sessions optimally, we are searching for the best matching of user intents. The best match is obtained by aligning pages that are the same or are
strongly correlated in the context of user’s intent. With only the usage logs for one’s perusal, it is difficult to correctly discover the user’s intent. This is where domain knowledge is handy.
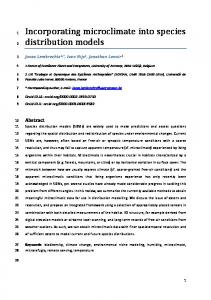
3.2 Concept Hierarchy Websites of any reasonable size usually are organized and structured in ways that reflect the functional characteristics of the website. A natural form of organization is a hierarchical arrangement. Work in the field of document retrieval suggests that relations between documents, based on semantic similarity, can be considered to be taxonomic or hierarchical [23]. That is, the relationship forms a directed acyclic graph, with documents forming the leaves, and internal nodes of the tree representing instances of some dimension that relates the documents. This hierarchy is a collection of domain concepts and documents organized according to an “IS-A” relationship. Such an abstract hierarchical organization of content is called Concept Hierarchy: it structures content into units which are formal abstractions of concepts of human thought, allowing meaningful comprehensible interpretation [9, 25]. Figure 3 illustrates an example concept hierarchy for a student services website in a university. Each part of the hierarchy is usually designed to address a particular functionality, or more generally, to address an idea or a concept. The intent of a user browsing the website is directly influenced by the website’s functionality. This would suggest that all the different concepts in the website’s concept hierarchy are a reflection of probable user intents, as expected by the content designer. In other words, one can make an informed guess about the user’s intent during a session by determining the concept(s) in the hierarchy that subsume pages viewed in that session. Similarity between sessions can then be deduced by measuring the similarity between subsuming concepts. Determining page similarity now becomes equivalent to determining concept similarity within the concept hierarchy.
3.3 Similarity Model An obvious and widely used method to calculate distance between nodes of a hierarchy is edge counting [14, 22, 23]. Here one tries to find the shortest number of edges required to reach one concept from the other; the smaller the number of edges, the smaller the distance and the greater the similarity between the concepts. If there are multiple paths, the distance is the shortest of all possible paths. Edge counting assumes that concepts are farther apart from each other if one needs to ascend the hierarchy significantly in an attempt to go from one node to the other. However, edge counting also assumes that all links in the hierarchy represent the same distance semantically [24]. In actual hierarchies, there may be wide variation in the distance covered by a link. For example, a concept that has many “child”-concepts is more distant to each one of its children than another concept that has fewer children. This makes sense because the concept having many children is much more generalized and is therefore conceptually farther from its children who are specialized concepts and documents. Resnik [24] proposes a model to calculate similarity between words in a language from a word-taxonomy using ideas from information theory. The model we propose here for similarity calculation is an adaptation of the aforementioned model to the context of the web documents. This method does not assume all links to represent the same distance. It also combines the hierarchy with probability estimates. The concept hierarchy of a website is fairly static, and changes only when the site undergoes a major overhaul. Page content changes frequently, and so one could expect the popularity of pages (and hence their probabilities) to vary quite a bit over time. The model we describe here allows us to use relatively static concept information in such a dynamic environment while limiting the changes needed due to content updates. Suppose we have the concept hierarchy of a website, with concepts and pages represented by particular nodes. Each node is
assigned a probability value that measures the strength of the concept or page that it represents. That is, a node having a high probability signifies that the corresponding concept or page is popular and occurs very often. Nodes in the concept hierarchy can belong to different subsuming concepts simultaneously, and thus the hierarchy is really a directed acyclic graph, instead of a tree. Any node in the graph represents a union of concepts represented by its children, and so any instance of a child concept is also an instance of the parent concept. This constrains probability values to be monotonically non-decreasing as we ascend the hierarchy. The nodes at the upper levels of the hierarchy have high probabilities, with the root node having a probability of 1, if one exists. Using principles on information theory, the information content of a node is defined as the negative logarithm of its probability. Let I(n) denote the information content of a node n in the hierarchy. Then,
I ( n ) = − log p ( n ) In the above formula, p(n) is the probability assigned to node n. One can see that as probability of a node increases, the amount of information that one gets from it decreases. This directly results in higher level nodes having lesser information content than the lower ones, with the root node providing no information at all. Defining information content in this manner makes sense when we consider the closest subsuming node for a given pair of nodes: the higher the subsumer in the hierarchy, the higher its probability and hence the lesser the similarity is between the nodes. Formally, let S(n1,n2) represent the similarity between two nodes n1 and n2, both of which represent pages of the website. Since a particular page can belong to multiple concepts, it is possible that n1 and n2 may have more than one parent node, and hence more than one path to the root of sub-graph to which they belong to. Let A represent the set of least common ancestors of n1 and n2 for all possible combinations of such paths for the two
Student Services (I = 0)
Advising
Registration
How-to Guides
(I = …)
(I = 2.17891)
(I = 4.5362)
Returning
Career Services (I = …)
...
after absence
Pre-registration
(I = …)
(I = 5.29699)
... Credit
Grading Options (I = …)
Requirements
...
(I = 4.9578) ... ...
... 13-creditpolicy.htm
Figure 4. Annotated concept hierarchy for student-services example
nodes. The least common ancestor on a path combination is that node which appears in both paths and that is as far away as possible from the root. Set A will thus contain one ancestor node for every pair of paths-to-root that has at least one node in common. The overall similarity can be obtained from the maximum value of the information content of nodes in A. Thus,
S ( n1 , n 2 ) = max { I ( a i ) } ai ∈ A
Resnik [24] mentions that a more faithful way to calculate S(n1,n2) would be to weight each candidate common ancestor according to some measure and take a weighted average of information contents as the similarity value. In this paper, however, we do not explore such a possibility. Figure 4 shows a portion of the annotated concept hierarchy for the student services website.
3.4 Implementation
can be readily extracted from such systems. Given a concept hierarchy, the task that remains in the realization of this similarity model is to assign probabilities (and hence information content values) to the nodes of the hierarchy. We rely on the actual usage of pages to calculate probabilities. Each page that is found in the usage log of the website is considered as an occurrence of every concept that it belongs to, taking care to do so exactly once. Owing to the IS-A property of the hierarchy, these concepts are not just the immediate parents of a node, but include each one of the node’s ancestors in the hierarchy. Formally,
∑ count (n)
freq(c) =
n ∈ pages ( c )
where pages(c) is the set of pages that a concept node c subsumes, and count(n) is the number of occurrences of a page n. When all pages in the usage log have been processed, the relative frequency of each concept node c gives the probability of occurrence of that node:
The concept hierarchy for a website can be obtained directly from its content designers. Many sites nowadays use a content management system to store their content. Concept hierarchies
pˆ (c) =
freq (c ) N
where N is the total number of pages encountered in the log,
Offline Web Logs
Website
Session
Hierarchy
Identification
Generation Session Alignment
…
…
Session Similarity …
Graph
…
Concept Hierarchy
Partitioning Sessions Session Clusters
Get
Clickstream Trees
Recommendations Recommendations
HTML + Recommendations
Web Server
Recommendation System
Web Client
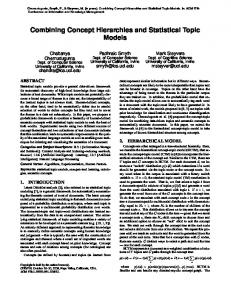
Webpage request Online Figure 5. The Recommender System
excluding those that were not part of the given hierarchy. A more detailed discussion on this general method can be found in [24]. Information content of a node, being a logarithm, lies in the range 0 to ∞. This range needs to be normalized if information values are to be used for calculating alignment scores of sessions. In addition, the notion of penalizing mismatching alignments needs to be accommodated in the similarity values. Thus, we normalize the similarity value calculated from information content of nodes so that it lies in the range -1 (maximum penalty) to 1 (maximum reward). Thus, normalized similarity between page nodes n1 and n2 is given as
S (n1 , n2 ) −1 I M Sim(n1 , n2 ) = S (n1 , n2 ) − I M I MAX − I M
if S (n1 , n2 ) ≤ I M otherwise
where IM and IMAX are the median and maximum values of the information contents of all concept nodes of the hierarchy. Normalized similarities calculated in this way are used directly in calculating alignment metrics like alignment score component and local similarity component. Remaining tasks in the offline analysis of web logs (similarity matrix generation, clustering and clickstream tree generation) are described in [12]. The online component of the recommendation engine finds a set of the best k-pages for every page requested by the user. To do this, the recommendation engine keeps track of the user's online session by storing the pages accessed and times spent on them. Then it finds all occurrences of the current page in the clickstream trees. For each occurrence, an upward traversal of the tree is performed till the root to extract the partial session associated with that clickstream branch. Once a set of such sessions has been obtained, a pair-wise alignment with the online session is performed and an alignment score is obtained for each partial session. We designate the alignment score as our recommendation score, although a more complex measure could be devised by combining the alignment score with the number of occurrences of the page across all clusters and size of the cluster. The recommendation scores are ranked in non-increasing order and the top k-sessions are selected for making the recommendations. By doing so, we have found the top k-sessions which are the best match for the current user session. Hence the next page from each of these k-sessions is given as a recommended page to the user.
3.5 Overall Workflow Figure 5 provides a schematic description of the recommendation process. The inputs to the system are the web-usage logs from the web-servers and the concept hierarchy of the website content. Usage logs are cleaned, pre-processed and structured into user sessions using heuristic techniques described in [4]. Simultaneously, the concept hierarchy is annotated with information content values using the web-usage logs. User sessions and concept hierarchy are utilized to generate a similarity score for each session pair based on optimal sequence alignment using the similarity model described before. The sessions are then clustered based on their similarity scores using graph partitioning. We use the clustering tool Cluto [3] for this purpose. These clusters are represented as clickstream trees. During an online session, the web-server receives requests for web-pages. The request is then passed to the recommendation system to generate recommendations for the currently requested page. The system tries to align the pages visited so far optimally with clickstream
sessions. Best alignments are ranked and form the basis for recommendations. The recommendations are then assimilated into the web-page that was requested, and the combined document is sent back to the client for display.
4. EXPERIMENTS AND RESULTS We call our method of page and session similarity calculation, described in Section 3, concept-aware similarity model (CASM). We carried out a series of experiments to evaluate the performance of this model as compared to other methods: one that assigns a score of 2 to a match and -1 to a mismatch (the “2,-1” scoring system), as described in [12], and the other that assigns similarity values randomly. We call the first comparative model, simple similarity model (SSM), and the second one, random similarity model (RSM). In carrying out these tests, the only variation across these methods was the manner of calculating similarity between pages; all other steps, including clustering and recommendation generation were identical in all three methods.
4.1 Experimental setup The experiments were carried out on web-server logs obtained from the College of Liberal Arts of University of Minnesota [27]. The College of Liberal Arts is the largest college at the University of Minnesota, serving over 14,500 students in nearly 70 majors. In particular, we used the Student Services website as the data source, which contains over 1,500 web pages and other documents. The usage logs available had over 200,000 sessions with majority of them being one-page sessions. Such sessions are not useful in making predictions, and therefore were disregarded leaving 20,000 sessions as useful data. In addition, the classification of the documents into topics/subtopics was available [7]. This classification, in combination with (human) expert knowledge about the website and topology of the website was used to manually create a concept hierarchy that represented Student Services as well as possible. The general method for testing used was as follows: from the cleaned logs, we used a portion of the logs to train the recommendation system. The remaining sessions were treated as test sessions, for which we predicted the next page that will be requested at every stage of the session using the clickstream trees constructed. Intuitively, if predicted pages were actually accessed by the user in the session later on, it would mean that the clickstream trees were indeed capable of making sensible recommendations. The performance of various models for similarity can then be compared quantitatively on the basis of the “success rate” of their predictions. The following measures were used to assess the success of predictions based on different models: • Predictive Ability (PA): Percentage of pages in the test sessions for which the model was able to make recommendations. This is a measure of how useful the model is. • Prediction Strength (PS): Average number of recommendations made for a page. • Hit Ratio (HR): Percentage of hits. If a recommended page is actually requested later in the session, we declare a hit. The hit ratio is thus a measure of how good the model is in making recommendations. • Click Reduction (CR): Average percentage click reduction. For a test session (p1, p2,…, pi…, pj…, pn), if pj is recommended at
Table 1. Comparison of different models for various recommendation sizes Model
Metric PA
PS
HR
CR
RQ
Maximum number of recommendations = 3 RSM
93.42
2.99
31.23
21.67
2.11
SSM
97.50
2.99
33.98
21.67
2.20
CASM
97.27
2.99
34.50
23.49
2.26
RSM
93.42
4.96
38.13
27.09
3.12
SSM
97.50
4.96
37.93
24.50
3.59
CASM
97.27
4.96
40.20
27.65
3.41
RSM
93.42
9.82
45.22
32.98
6.23
SSM
97.50
9.81
42.17
27.38
6.28
CASM
97.27
9.80
54.08
38.89
6.38
Maximum number of recommendations = 5
Maximum number of recommendations = 10
page pi, and pj is subsequently accessed in the session, then the click reduction due to this recommendation is,
Click reduction =
j −i i
• Recommendation Quality (RQ): Average rank of a hit. Recommendations made for a page are ranked as described in Section 3.4. If a recommendation is a hit, then the rank of the recommendation is the rank of that hit. The lower the rank of a hit, the better the quality of recommendation. The first two measures simply validate the utility of the system as a predictive tool. A good hit ratio indicates that the model was able to successfully learn usage patterns from the training data. In defining a hit, we do not restrict ourselves to testing only against the next requested page, as in [6]. This is because the recommendations are made after the user has browsed the
website. Recommendations are thus “passive” and cannot influence the user’s choice of next page. Similarly, in getting to the target page(s), the user is likely to browse other navigational pages that are not necessarily desired. Recommendations can reduce the number of clicks needed to reach the intended page. Click reduction measures the usefulness of recommendations from this point of view.
4.2 Comparison on number of recommendations made Table 1 compares the three similarity models by varying the maximum number of recommendations generated. The recommendation size is limited to these typical values: 3, 5 and 10. The models were trained on data containing 5,000 user sessions, with clickstream trees grouped into 10 clusters. Remaining 15,000 sessions were used for testing.
Table 2. Comparison of different models for various cluster sizes Model
Metric PA
PS
HR
CR
RQ
Number of clusters = 5 RSM
94.40
4.96
38.20
27.00
3.03
SSM
97.46
4.96
43.68
29.37
3.50
CASM
96.67
4.96
43.88
29.34
3.37
Number of clusters = 10 RSM
93.42
4.96
38.13
27.09
3.12
SSM
97.50
4.96
37.93
24.50
3.59
CASM
97.27
4.96
40.20
27.65
3.41
Number of clusters = 20 RSM
91.81
4.96
23.56
15.50
3.95
SSM
97.82
4.96
34.70
23.20
3.40
CASM
96.83
4.96
34.67
23.71
3.69
The predictive ability of all three models is fairly good, although not 100%. This happened because we were working with an incomplete data-set - test sessions contained pages that were not present either in the training sessions or in the concept hierarchy (The concept hierarchy available was not for the same time-span as covered by the available usage logs). The system is clueless about these pages, and is therefore unable to make predictions for them. All three models have good prediction strength and can produce desired number of recommendations. Comparisons on hit ratio and click reduction indicate that CASM outperforms the other two models in all three cases, with the disparity increasing with number of recommendations. An interesting point to be noted is that RSM performs better than the SSM on hit ratio and click reduction. This is an indication of the fact that a naïve scoring method of assigning 2 for match and -1 for mismatch is not a good idea and it should be substituted by a more sophisticated scoring method. CASM performs the best when we try to make larger number of recommendations. This is an indication of the power of the model not only to capture the top recommendations but also recommendations which are lower in the order. CASM however performs slightly worse on the recommendation quality aspect, and the difference is more pronounced with more recommendations. This probably is due to the manner in which recommendations are ranked: we used domain knowledge only during the process of session alignment and therefore for the generation of candidate recommendations. Ranking within the candidates does not make use of any domain knowledge but instead relies solely on usage information (implicitly contained in the clickstream construction). The recommendation model needs to be improved, and using domain information is one way of doing that. In our future work, we intend to find out ways in which the concept hierarchy may be used for ranking as well. Generalizing this idea to include other forms of domain knowledge should also be helpful.
4.3 Comparison on number of clusters Table 2 compares the similarity models by varying the number of clusters used while building the clickstream trees. The cluster sizes used were 5, 10 and 20. The models were trained on data containing 5000 user sessions and the remaining 15,000 sessions were used for testing. Recommendations were limited to 5. The results show that our recommendation model outperforms the other two models when number of clusters is limited to 10. The overall trend in the measurements shows that CASM performs at least as good as SSM if not better. For the College of Liberal Arts data-set that we used, it appears that a smaller number of clusters is more representative of the actual clustering pattern that exists in the data. Currently the cluster count is a parameter that needs to be externally supplied. However, here again one can estimate the likely number of clusters by using other information, e.g. the number of nodes in the concept hierarchy at a pre-defined level can be one such estimate. Devising such estimators is another aspect that we will work on.
5. CONCLUSIONS AND FUTURE WORK Recommendation models based only on usage information are inherently incomplete because they neglect domain knowledge. Better predictions can be made by modeling and incorporating context dependent information: concept hierarchy, link structure and semantic classification allow us to do so. In this paper, we have described a method to combine usage information and
domain knowledge based on ideas from bioinformatics and information retrieval. The results are promising and are indicative of the utility of domain knowledge. We believe that more improvement can be achieved, and therefore intend to enhance and augment the method described here in several ways: Investigate similarity calculations that use information content values weighted by context that could provide better estimates for similarity. There is a substantial scope for improvement in the ranking of recommendations: domain knowledge can again be used along with the local sequence alignment. In fact, we believe that the similarity model should incorporate link structure and semantics of documents, appropriately weighted, to provide a composite similarity score that can be used in alignment. Testing and evaluation of the system also presents opportunities for improvement: testing with domain experts or average users should verify the ultimate usefulness of recommendations that use concept hierarchy. Devising better metrics for performance comparison is another area that we intend to work on. Finally, creating the concept hierarchy from scratch may be a very tedious task. Automating this will increase the applicability of methods like ours to a wider class of websites.
6. ACKNOWLEDGEMENTS This work is supported by research grants from Intel IT Research towards development of a recommender system for internal use. In particular we would like to thank Amy Auler, Bill Draven, Brandon Bohling, Brian Quiner, Jerzy Bilchuk, Sri Canakapalli from Intel for their inputs on implementing the proposed system. We also thank Colin DeLong from University of Minnesota College of Liberal Arts for providing the data sources.
7. REFERENCES [1] Adomavicius, G., and Tuzhilin, A. Towards the Next Generation of Recommender Systems: A Survey of the State-of-the-Art and Possible Extensions. IEEE Transactions on Knowledge and Data Engineering (June 2005), vol. 17.
[2] Anderson, C., Domingos, P., and Weld, D. Relational Markov models and their application to adaptive Web navigation. In Proceedings of 8th ACM SIGKDD Intl. Conf. on Knowledge Discovery and Data Mining (Edmonton, Canada, 2002), 143-152.
[3] Cluto. http://www-users.cs.umn.edu/karypis/cluto/index.html.
[4] Cooley, R., Mobasher, B., and Srivastava, J. Data preparation for mining World Wide Web browsing patterns. Journal of Knowledge and Information Systems 1, 1 (1999).
[5] Cooley, R., Srivastava, J., and Mobasher, B. Web Mining: Information and pattern discovery on the world-wide web. 9th IEEE International Conference on Tools with Artificial Intelligence (November 1997).
[6] Cosley, D., Lawrence, S., and Pennock, D. M. REFEREE: An open framework for practical testing of recommender systems using research index. In Proceedings of 28th International Conference on Very Large Databases, VLDB 2002 (Hong Kong, August 2002).
[7] DeLong, C., Desikan, P., and Srivastava, J. USER (User Sensitive Expert Recommendation): What Non-Experts NEED to Know, WebKDD 2005 Workshop.
[8] Ding, C., He, X., Zha, H., Gu, M. and Simon, H. Spectral min-max cut for graph partitioning and data clustering. Technical Report TR-2001-XX, Lawrence Berkeley National Laboratory, University of California, Berkeley, CA (2001).
[9] Ganter, B., and Wille, R. Formal Concept Analysis Mathematical Foundations. Springer Verlag (1999).
[10] Google Directory. http://directory.google.com [11] Gusfield,D. Algorithms on Strings, Trees and Sequences: Computer Science and Computational Biology. Cambridge University Press (1997).
[12] Gündüz, S., and Ozsu, M. T. A Web Page Prediction Model Based on Click-Stream Tree Representation of User Behavior. In Proceedings of the 9th ACM SIGKDD International Conference on Knowledge Discovery and Data Mining (2003), 535-540.
[13] Jia, L., and Zaïane, O. R., Combining Usage, Content, and Structure Data to Improve Web Site Recommendation. ECWeb 2004, 305-315.
[14] Lee, J. H., Kim, M. H., and Lee, Y. J. Information retrieval based on conceptual distance in IS-A hierarchies. Journal of Documentation (1993), 49 (2), 188-207.
[15] Mobasher, B., Cooley, R., and Srivastava, J. Creating adaptive web sites through usage-based clustering of URLs. Knowledge and Data Engineering workshop, 1999.
[16] Mobasher, B., Dai, H., Luo, T., and Nakagawa, M. Effective Personalization Based on Association Rule Discovery from Web Usage Data. In Proceedings of the 3rd ACM Workshop on Web Information and Data Management (WIDM’01)/International Conference on Information and Knowledge Management (CIKM’01) (Atlanta GA, November 2001).
[17] Mobasher, B., Dai, H., Luo, T., and Nakagawa, M. Using sequential and non-sequential patterns for predictive web usage mining tasks. In Proceedings of the IEEE International Conference on Data Mining (ICDM’02) (Maebashi City, Japan, December 2002).
[18] Nakagawa, M., and Mobasher, B. Impact of site characteristics on recommendation models based on association rules and sequential patterns. In Proceedings of the IJCAI 2003.
[19] Nakagawa, M., and Mobasher, M. A hybrid web personalization model based on site connectivity. In Proceedings of WebKDD (2003), 59-70.
[20] Nasraoui, O., Frigui, H., Joshi, A., and Krishnapuram, R. Mining Web Access Logs Using Relational Competitive Fuzzy Clustering. In Proceedings of the 8th International Fuzzy Systems Association World Congress (IFSA 99)(Taipei, August 1999).
[21] Pierrakos, D., and Paliouras, G. Exploiting Probabilistic Latent Information for the Construction of Community Web Directories. In Proceedings of 10th International Conference on User Modeling (UM'05)(Edinburgh, UK, July 2005), 89 98.
[22] Rada, R., and Bicknell, E. Ranking documents with a thesaurus. JASIS (1989), 40 (5), 304-310.
[23] Rada, R., Mili, H., Bicknell, E., and Blettner, M. Development and application of a metric on semantic nets. IEEE Transaction on Systems, Man, and Cybernetics (1989), 19 (1), 17-30.
[24] Resnik, P. Semantic Similarity in a Taxonomy: An Information-Based Measure and its Application to Problems of Ambiguity in Natural Language. Journal of Artificial Intelligence Research 11 (1999), 95-130.
[25] Sieg, A., Mobasher, B., and Burke, R. Inferring User’s Information Context: Integrating User Profiles and Concept Hierarchies. In Proceedings of the 2004 Meeting of the International Federation of Classification Societies (Chicago IL, 2004).
[26] Srivastava, J., Cooley, R., Deshpande, M., and Tan, P. N. Web usage mining: Discovery and applications of usage patterns from web data. SIGKDD Explorations (2000), 1(2):12–23.
[27] University of Minnesota College of Liberal Arts. http://www.class.umn.edu
[28] Zhu, J., Hong, J., and Hughes, J. G. Using Markov Models for website link prediction. In Proceedings of the 13th ACM Conference on Hypertext and Hypermedia (2002), 169-170.
[29] Yahoo! Directory. http://dir.yahoo.com