YNICL-00531; No. of pages: 11; 4C: NeuroImage: Clinical xxx (2015) xxx–xxx
Contents lists available at ScienceDirect
NeuroImage: Clinical journal homepage: www.elsevier.com/locate/ynicl
3
4 5
Tzipi Horowitz-Kraus⁎, Mark DiFrancesco, Benjamin Kay, Yingying Wang, Scott K. Holland Pediatric Neuroimaging Research Consortium, Cincinnati Children3s Hospital Medical Center, Cincinnati, OH, USA
a b s t r a c t
a r t i c l e
i n f o
7 8 9 10 11
Article history: Received 20 March 2015 Received in revised form 6 June 2015 Accepted 26 June 2015 Available online xxxx
12 13 14 15 16 17
Keywords: Dyslexia Dual-networks top-down model Independent component analysis Reading fluency Resting-state fMRI
The Reading Acceleration Program, a computerized reading-training program, increases activation in neural circuits related to reading. We examined the effect of the training on the functional connectivity between independent components related to visual processing, executive functions, attention, memory, and language during rest after the training. Children 8–12 years old with reading difficulties and typical readers participated in the study. Behavioral testing and functional magnetic resonance imaging were performed before and after the training. Imaging data were analyzed using an independent component analysis approach. After training, both reading groups showed increased single-word contextual reading and reading comprehension scores. Greater positive correlations between the visual-processing component and the executive functions, attention, memory, or language components were found after training in children with reading difficulties. Training-related increases in connectivity between the visual and attention components and between the visual and executive function components were positively correlated with increased word reading and reading comprehension, respectively. Our findings suggest that the effect of the Reading Acceleration Program on basic cognitive domains can be detected even in the absence of an ongoing reading task. © 2015 Published by Elsevier Inc. This is an open access article under the CC BY-C-D license (http:// creativecommons.org/licenses/by-nc-nd/4.0/).
C
T
E
D
6
36 34 33
R
35
1. Introduction
38
Developmental dyslexia or reading difficulty (RD) is a deficit in acquiring fluent reading skills despite remedial intervention (IDA, 2011) that is accompanied also by diminished executive functions (EF) (Breznitz, 2006). These difficulties lead to a failure in reading words in a holistic manner (i.e., orthographic reading) (Turkeltaub et al., 2003). Reading is a higher-order cognitive ability that relies on phonology, orthography, and semantics, along with several key EF [e.g., working memory (de Jong, 1998), speed measures (Breznitz and Misra, 2003), and switching/shifting attention and cognitive control (Houde et al., 2010)]. The occipito-temporal cortex (also named the Visual Word Form Area or VWFA) is composed of the fusiform gyrus (FG) and has been specifically shown to activate in response to word recognition, but not during non-words or presentation of letters (Cohen and Dehaene, 2004; Cohen et al., 2002; Vinckier et al., 2007). It has been suggested that individuals with RD show lower activation in the left FG during word reading compared to typical readers (TRs) (Benjamin and Gaab, 2012). Individuals with RD also show deficits in EF (Altemeier
47 48 49 50 51 52 53 54
O
C
N
45 46
U
43 44
R
37
41 42
18 19 20 21 22 23 24 25 26 27 28 29 30
E
31 32
39 Q4 40
R O O F
2
Increased resting-state functional connectivity of visual- and cognitive-control brain networks after training in children with reading difficulties
P
1Q3
⁎ Corresponding author at: Pediatric Neuroimaging Research Center, 3333 Burnet Avenue MLC 5033, Cincinnati, OH 45229-3039, USA. Tel.: +1 513 803 5162. E-mail address:
[email protected] (T. Horowitz-Kraus).
et al., 2008; Brosnan et al., 2002; Gooch et al., 2011; Helland and Asbjornsen, 2000) with some specific reports of attention difficulties (Facoetti et al., 2000; Shaywitz and Shaywitz, 2008). Indeed, the severity of cognitive deficits has been positively correlated with reading impairments (Horowitz-Kraus, 2014; Horowitz-Kraus and Breznitz, 2013). These findings suggest that deficits in underlying cognitive abilities such as attention and EF may be related to RD in dyslexia. In the past decade, several neuroimaging studies supported the altered activation of neural circuits supporting EF in individuals with RD and the over-activation in these regions as a strategy of compensating for RD (Pugh et al., 2000; Rumsey et al., 1997). The authors suggested that at baseline, when children with RD encounter a word that they struggle to decode, the inferior frontal gyrus (related to semantic abilities) and the dorsolateral prefrontal cortex (related to EF) are employed as compensatory circuits (see also Heim et al., 2013 for demonstration of this phenomenon in adults). Demonet and colleagues also reported a greater activation of frontal regions in children with RD (specifically of the inferior frontal regions) compared to TRs and suggested that this reflects the compensatory pathways of individuals with RD in different types of phonological processing (Demonet et al., 2004). Heim and colleagues suggested that the lower level of activation of the ventral-occipital temporal route for words is shared among individuals with RD (Heim et al., 2013). Other genetic studies also indicated a
http://dx.doi.org/10.1016/j.nicl.2015.06.010 2213-1582/© 2015 Published by Elsevier Inc. This is an open access article under the CC BY-C-D license (http://creativecommons.org/licenses/by-nc-nd/4.0/).
Please cite this article as: Horowitz-Kraus, T., et al., Increased resting-state functional connectivity of visual- and cognitive-control brain networks after training in children with re..., NeuroImage: Clinical (2015), http://dx.doi.org/10.1016/j.nicl.2015.06.010
55 56 57 58 59 60 61 62 63 64 65 66 67 68 69 70 71 72 73 74 75 76 77
2
101 102 103 104 105 106 107 108 109 110 111 112 Q5 113 114 115 116 117 118 119 120 121 122 123 124 125 126 127 128 129 130 131 132 133 134 135 136 137 138 139 140 141 142 143
195
2.1. Participants
196
Children with RD [n = 18, mean age = 9.9 years, standard deviation (SD) = 1.3 years; 9 females] and TR (n = 18, mean age = 9.8 years, SD = 1.7 years; 9 females) participated in the study. Participant groups were matched for nonverbal IQ scores (mean standard score = 103, SD = 7.43) as measured by the Test of Nonverbal Intelligence, third edition (TONI-3; Brown, 1997). Both reading groups underwent baseline behavioral and neuroimaging assessments followed by 4 weeks of the RAP training with follow-up (behavioral and neuroimaging) assessments. All participants were right-handed, native-English speakers with average socioeconomic status, normal or corrected-to-normal vision in
197
O
F
2. Materials and methods
R O
99 100
P
97 98
144 145
D
95 96
BA 18,19) compared with TRs (Koyama et al., 2013). Studies have demonstrated the possible positive effects of reading training, not only on the activation of reading circuits in individuals with RD, but also on the functional connectivity with other regions related to attention or EF (Horowitz-Kraus and Breznitz, 2013; Koyama et al., 2013). However, as previously suggested (Price and Devlin, 2011; Vogel et al., 2013), the human brain is not “tuned” specifically to reading, but rather it depends on networks that maintain other functions and also enable reading (such as visual processing, attention, and language-related regions) (Vogel et al., 2013). Therefore, when reading interventions are administered, they may actually target brain regions that are not reading specific. Previous studies (Horowitz-Kraus and Breznitz, 2013; HorowitzKraus et al., 2014b) repeatedly determined that the RAP training resulted in greater activation in regions that are specific to visual processing (i.e., related to word recognition), such as the FG. However, there are reports of the effect of the RAP training on activation of regions that are not specific to reading (i.e., attention, EF, working memory, and language) (Horowitz-Kraus and Breznitz, 2013; Horowitz-Kraus et al., 2014b). Therefore, our current study aimed to determine the effect of the RAP on connectivity among neural circuits supporting both reading and EF/attention in the absence of a stimulus, i.e., in a resting-state condition, by focusing on the functional connectivity with regions related to visual processing, as reported by other studies related to the effect of the RAP training and other studies related to reading (Koyama et al., 2013). Unlike task-based fMRI studies, fluctuations in blood-oxygenationlevel-dependent (BOLD) signals during a resting-state fMRI condition are observed in the absence of an experimental stimulus. The degree of temporal correlation of these fluctuations between brain regions is thought to reflect interregional functional connectivity. This concept extends to connectivity of entire functional networks. The current study was designed to answer the following questions: 1) What are the changes in functional connectivity between networks supporting reading (e.g., visual processing) and networks related to EF, attention, memory, and language following the RAP intervention in either individuals with RD or TRs? 2) Will connectivity within or between the EF circuits be altered after the RAP training during a resting-state condition in either individuals with RD or TRs? To answer these questions, children with RD and TRs participated in two resting-state fMRI scans before and after 4 weeks of training with the RAP. Data were analyzed using an independent component analysis (ICA) approach to extract pertinent functional networks (components). We hypothesized that children with RD would show increased functional connectivity between the visual processing component and components related to EF, attention, memory, and language after the RAP training. We also hypothesized that automatic reading in TRs after training would result in reduced functional connectivity between visual processing and language components [as observed in Vogel et al., 2014]. We postulated that a specific increase in functional connectivity between the visual processing component and attention and EF components after training would be correlated with greater word reading and comprehension scores in both groups.
E
93 94
T
91 92
C
89 90
E
87 88
R
85 86
R
84
O
82 83
C
80 81
decreased activation in the dorsolateral prefrontal cortex (Wang, 2014) and decreased gray-matter volumes (Black et al., 2012) in 5 year olds and 4 year olds with a familial risk to develop RD, respectively. These studies support altered EF abilities as well as the neural circuits supporting EF in individuals with RD, but are lacking a direct examination of the relationship between neural circuits supporting reading, language, and other cognitive domains, such as EF in individuals with RD. Vogel and colleagues suggest that the VWFA is functionally connected with the dorsal attention network in the inferior parietal lobule as determined during resting-state functional magnetic resonance imaging (fMRI) (Vogel et al., 2012; Vogel et al., 2014). This connectivity was observed to increase with age and reading ability. The precuneus is part of this dorsal attention network and supports visual attention (Vogel et al., 2014), and this region is thought to be part of a wider cognitive-control model named ‘the dual-networks top-down model’ (Dosenbach et al., 2008). This model proposes two cognitive-control/ EF networks with different neuroanatomical correlates. The first is the rapid adaptive control network that allocates attention to a cue and involves a frontal–parietal circuit that includes the precuneus. The second is the set-maintenance network that maintains task goals, sustains adjustments for feedback control, monitors errors, and involves a cingulo-opercular circuit. The connectivity within these networks increases throughout development (Dosenbach et al., 2008). Both networks are engaged during reading (Ihnen et al., 2015), but only the functional connectivity between the fronto-parietal network and the FG has been positively correlated with reading skill and age (Vogel et al., 2014). The authors highlight the role of visual attention in reading and suggest that a deficit in visual attention may contribute to the reading impairments in individuals with RD [see also Lassus-Sangosse et al., 2008; Valdois et al., 2004; Vidyasagar and Pammer, 2010]. The role of attention as the basis for memory, EF, and reading outcomes also is supported by behavioral studies (Masur et al., 2013). Fluent reading depends on accurate, timely decoding of words (Breznitz, 2006). Word decoding relies not only on intact phonology, orthography, and semantics, but also on intact basic cognitive abilities such as attention, speed of processing, and working memory (which are part of the umbrella term ‘executive functions’) (Christopher et al., 2012). The Reading Acceleration Program (RAP) is an EF-based computerized reading intervention (Breznitz et al., 2013). This reading training focuses on language abilities while also exercising the domains of attention, working memory, and speed of processing that support EF. The RAP forces the reader to visually follow letters (i.e., attention) as they are erased from the screen (i.e., reliance of working memory) at a progressively faster speed (i.e., speed of processing). Monitoring comprehension ensures that the trainees do not only track the letters with their eyes, but that they also keep this information in their memory and process it linguistically. This procedure forces the reader to process words in a fast, holistic manner and ‘releases’ the bottleneck in working memory, enabling comprehension (Horowitz-Kraus and Breznitz, 2013). In turn, the readers3 ability to read words improves as their mental lexicon becomes more stable and their error monitoring improves (Horowitz-Kraus and Breznitz, 2013; Horowitz-Kraus et al., 2014a, 2014b). Previous studies have shown that improvement in error-monitoring, working memory, and other EF after the RAP training is accompanied by greater frontal activation [inferior frontal gyrus; Brodmann area (BA) 44 and anterior cingulate cortex (ACC); BA 24] (Horowitz-Kraus et al., 2014b). We also have observed greater functional connectivity between frontal (BA 24) and visual (FG; BA 37) regions during an fMRI reading task after the RAP training, suggesting that as the RAP forces the reader to read faster and visually attend and track the letters, both EF and attention improve. A recent resting-state functional connectivity analysis in 7–15 yearold children with RD demonstrated increased functional connectivity between the left VWFA (BA 37) and both frontal regions related to EF (medial FG; BA 10) and other reading regions (middle occipital regions;
U N
78 79
T. Horowitz-Kraus et al. / NeuroImage: Clinical xxx (2015) xxx–xxx
Please cite this article as: Horowitz-Kraus, T., et al., Increased resting-state functional connectivity of visual- and cognitive-control brain networks after training in children with re..., NeuroImage: Clinical (2015), http://dx.doi.org/10.1016/j.nicl.2015.06.010
146 147 148 149 150 151 152 153 154 155 156 157 158 159 160 161 162 163 164 165 166 167 168 169 170 171 172 173 174 175 176 177 178 179 180 181 182 183 184 185 186 187 188 189 190 191 192 193 194
198 199 200 201 202 Q6 203 204 205 206
T. Horowitz-Kraus et al. / NeuroImage: Clinical xxx (2015) xxx–xxx
both eyes, and normal hearing. None had a history of neurological or psychiatric disorders, and no differences were found between children 209 with RD and TRs in attention ability as measured by the Conners 210 Q7 questionnaires (Conners, 1989; self-report t(36) = 1.227, P N 0.05 and 211 parental report, t(36) = 0.249, P N 0.05). Participants were recruited 212 from posted ads and through commercial advertisement. 213 Children with RD either had received a formal diagnosis or present214 ed with parentally reported difficulty with reading, which was con215 firmed by the study3s reading battery. Reading ability was evaluated 216 using a battery of normative reading tests in English: 1) word-reading 217 accuracy/orthography: word-reading efficiency subtest [test of word 218 Q8 reading efficiency (TOWRE; Torgesen et al., 1999)]; 2) decoding accura219 cy: decoding subtest for nonwords reading (TOWRE; Torgesen et al., 220 Q9 1999); and 3) contextual oral-reading fluency: Gray oral-reading test 221 Q10 (GORT-IV, Wiederholt and Bryant, 1992). Reading fluency in the GORT 222 takes into account both the accuracy and the reading-rate levels, 223 i.e., when errors are committed it affects the overall fluency score. 224 Children with RD had to reach a standard score of −1 or below (25th 225 percentile and below) in both word reading, decoding, and fluency tests 226 (i.e., in all three tests). TRs were age-matched students who volunteered 227 for the study and had fluent and accurate reading [according to norms; 228 i.e., reached a standard score of 1.5 (90th percentile) or higher in all 229 reading tests] as verified using the same tests that were used to evaluate 230 the children with RD. 231 To assess the effect of intervention on behavioral reading mea232 sures, we used separate repeated measures analysis of variance 233 (RM-ANOVA) utilizing the reading scores for the different reading 234 domains (i.e., TOWRE, GORT-IV, and reading comprehension and 235 speed as measured by the RAP). Different forms of these same measures 236 were used after intervention to avoid a priming effect (the after237 intervention assessment was taken approximately 5 weeks after the 238 first training session). 239 The study was carried out in the Imaging Research Center at Cincin240 nati Children3s Hospital Medical Center (CCHMC), Cincinnati, OH. All 241 participants gave their informed written assent and their parents 242 provided informed written consent prior to inclusion in the study, and 243 all were compensated for their participation. The CCHMC Institutional 244 Review Board approved the experiment.
Reconstructed fMRI data for each scanning session were then preprocessed using SPM8 software (http://www.fil.ion.ucl.ac.uk/spm/), including slice-timing correction, realignment to the first image of the session to correct for motion using 3 translational and 3 rotational parameters, coregistration of the anatomical image to the mean aligned functional image, normalization of all images to the Montreal Neurological Institute (MNI) template, which was found to be appropriate for children age 5 and above (Altaye et al., 2008), and spatial smoothing with an 8-mm full width at half-maximum (FWHM) Gaussian kernel. Following pre-processing, the resting-state data were fed into the ICA pipeline.
268 269
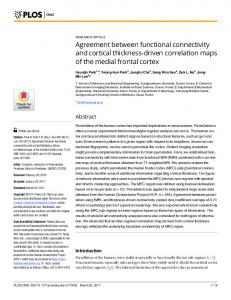
2.3.2. Independent component analysis The pre-processed image volumes from 72 datasets (18 datasets each for children with RD and TRs, both before and after training) were submitted to subject-wise group ICA implemented in the Group ICA of fMRI Toolbox (GIFT; http://mialab.mrn.org/software/gift/index. htm) (see Fig. 1 for the steps of the analysis). ICA is a multivariate data-driven method that does not assume an a priori task-driven hemodynamic response (Calhoun et al., 2001). The subject-wise temporal concatenation technique has been shown to produce the best overall performance compared to other proposed methods (Schmithorst and Holland, 2004). Using the minimum description length (MDL) criterion modified to account for spatial correlation built into the toolbox, we estimated 47 group components for the pre/post-conditions for both participant groups. The MDL model selection criterion is designed to
279 280
270 271 272 273 274 275 276 277 278
281 282 283 284 285 286 287 288 289 290 291 292
R
E
C
T
E
D
P
R O O F
207 208
3
2.2. MRI paradigms
246
2.2.1. Resting-state condition Participants were asked to look at a gray cross in the center of a black background on a screen for 5.5 min. They were asked to avoid sleeping or closing their eyes. Participants performed this scan prior to and following the RAP training (approximately 5 weeks apart).
250
O
249
C
247 248
R
245
264
2.3. Data analysis
265 266
2.3.1. Pre-processing During image reconstruction, a gradient-echo field was used to correct for geometric distortion due to B0 field inhomogeneity.
254 255 256 257 258 259 260 261
267
U
252 253
N
262 263
2.2.2. Data acquisition All images were acquired on a Philips Achieva 3 T MRI scanner (Philips Medical Systems, Best, The Netherlands). A T2*-weighted, gradient-echo planar imaging (EPI) sequence was used with fMRI parameters: TR/TE = 2000/38 ms, matrix size = 64 × 64, slice thickness = 5 mm, resulting in a voxel size = 4 × 4 × 5 mm3. Artifacts at this long echo time were minimized using a SENSE factor of 2 in a 32channel RF head coil. During the resting-state scan, 165 whole-head volumes were acquired for a total imaging time of 5.5 min. The initial 10 time points acquired were discarded to allow for T1 relaxation equilibrium. In addition, a high-resolution T1-weighted 3D anatomical scan was acquired using an inversion-recovery-prepared turbo gradientecho acquisition protocol with a spatial resolution of 1 × 1 × 1 mm.
251
Fig. 1. fMRI data pipeline. A flow chart illustrating the pipeline used to process the multisubject fMRI data through the group independent component analysis (ICA) and back projection to generate the IC maps and time courses. All results were corrected for multiple comparisons using false discovery rate or FDR and thresholded for statistical significance Q1 at P-corrected b 0.05.
Please cite this article as: Horowitz-Kraus, T., et al., Increased resting-state functional connectivity of visual- and cognitive-control brain networks after training in children with re..., NeuroImage: Clinical (2015), http://dx.doi.org/10.1016/j.nicl.2015.06.010
4
T. Horowitz-Kraus et al. / NeuroImage: Clinical xxx (2015) xxx–xxx
293 estimate the optimal dimension of the signal subspace in fMRI data 294 Q11 before the Principal Component Analysis (PCA) reduction step
299 300 301 302 303 304 305 306 307
2.3.3. Independent component selection Since ICA may produce ICs representing noise (e.g., movement artifact) in addition to biological signals (Hyvarinen and Oja, 2000), a 311 procedure was implemented to identify group ICs of interest. Often, in312 dependent component time courses are correlated to the time course of 313 a task to identify task-related ICs (Karunanayaka et al., 2011; Kim et al., 314 2011; Schmithorst et al., 2006). Since this resting-state study did not in315 corporate a specific cognitive task, ICs were included or excluded based 316 on visual inspection of their spatial distributions. Exclusion of ICs 317 proceeded using two previously published criteria: 1) ICs residing pri318 marily in white matter, ventricle(s), or outside the brain were excluded 319 on the basis that these regions do not generate BOLD signal (Calhoun 320 et al., 2008; Damoiseaux et al., 2006). 2) ICs symmetrically distributed 321 over large portions of the brain were excluded on the basis that they 322 do not describe plausible resting-state networks (Kiviniemi et al., 323 2003). After applying the initial exclusion criteria, we visually searched 324 for the independent component that represents visual processing [see 325 Smith et al., 2009 for a description of this component]. Canonical 326 templates may be used to aid in the identification of specific networks, 327 but these have not been shown to make identification more reliable 328 Q12 compared to manual network selection (Franco et al., 2009). We elected 329 to identify networks manually to avoid inadvertently rejecting valid ICs 330 not included in an a priori template. We then focused on the connectiv331 ity between the visual processing component and the remaining includ332 ed ICs (Fig. 1). 308
2.4. Correlation of network functional connectivity and behavioral measures
353
To relate behavioral reading scores to functional connectivity between the ICs, a Pearson correlation was performed between reading
340 341 342 343 344 345 346 347 348 349
354
C
339
U N
337 338
2.5.1. Stimuli The RAP bank of 1500 sentences was composed of moderateto high-frequency words in the English language (http://www. wordfrequency.info/). Each stimulus was a sentence with a multiplechoice question followed by four possible answers. Each sentence was 9–12 words in length, comprised of 45–70 letters with a letter width of 5 mm, extended over 1–2 lines, and with 18 mm between lines. Each sentence was presented once during the entire training. The sentences have been tested and verified for their level of difficulty in previous studies in English (move refs so English first since this study was in English) (Breznitz, 2006) as well as in Hebrew (Horowitz-Kraus et al., 2014a, 2014b, 2014c; Horowitz-Kraus and Holland, 2015).
364
2.5.2. Training procedure Reading training was administered via the Internet using a computer in each participant3s house. The primary investigator monitored training by a remote access to the training records. Through the administration option of the RAP, the study personnel monitored the start and end time for each session, making sure that the program was not left unattended during the training session. Comprehension and reading speed were monitored as well. In this way, we could assure that 5 valid training sessions were performed each week. The participants were trained for 4 weeks, 5 times each week, 15–20 min per session, for a total of 20 sessions, and reading a different set of 50 randomly presented sentences in each session. The initial and final reading pace and comprehension were measured by the evaluation mode of the RAP, which measures these variables in a self-paced reading condition (Breznitz et al., 2013). The duration of a sentence on the screen was calculated individually for each participant based on the diagnostic mode (see the following section; Presentation rate). Duration was controlled by text erasure, starting from the beginning of the sentence and advancing at a given per-character rate. All participants were presented with the same sets of sentences, in the same order. They were instructed to read the sentence silently and while doing so, the sentence disappeared from the computer screen and a multiple-choice comprehension question with four optional answers appeared and remained on the screen until the participant responded. They were instructed to choose the correct answer by pushing the corresponding number on the numeric keypad of the computer. The disappearance of the question from the computer screen prompted the next sentence.
377 378
2.5.3. Presentation rate The initial text erasure rate was determined specifically for each participant, based on a pre-test evaluation mode administered prior to training. The evaluation mode consisted of 12 sentences and 12 multiple-choice questions (Breznitz and Leikin, 2000 or Breznitz and Leikin, 2001). The mean reading rate (milliseconds per letter) for the sentence correctly answered by each participant determined the initial presentation rate of the RAP for that participant.
405
P
D
E
T
C
E
R
R
351 352
335 336
O
350
2.3.4. Statistical analysis of inter-component connectivity To test the differences between correlation coefficient values between each pair of ICs before and after intervention between the groups, we performed a 2 × 2 RM-ANOVA for Group (RD, TRs) and Testing time (Test 1, Test 2). We also compared resting-state network connectivity, defined as the Pearson correlation of time courses between pairs of ICs, between reading groups (children with RD and TRs) and within groups between the different conditions [baseline measures (Test 1) and post-intervention measures (Test 2) in each group separately]. The number of comparisons was limited by designating IC1 (visual processing component) as our independent component of interest and considering only the correlations between IC1 and the remaining included ICs (the selection of ICs is described in Fig. 1). P-values for each of the seven comparisons of pairwise correlation coefficients between ICs were adjusted for multiple comparisons using false discovery rate (FDR). This correction for multiple comparisons was performed for each of the four experimental conditions separately and thresholded for statistical significance at P-corrected b 0.05.
363
R O
309 310
333 334
2.5. The Reading Acceleration Program
F
297 298
(Yourganov et al., 2010). PCA was then used for dimensionality reduction in a two-stage process to reduce the computational complexity of the ICA (Calhoun et al., 2001). First, PCA was applied to each individual 165-volume dataset to obtain the first 71 principal components. After temporal concatenation of all datasets, a second application of PCA to the concatenated data reduced the dimensionality to 47 principal components, the number estimated by the MDL. Following this step, we proceeded with ICA using the Infomax algorithm (Bell and Sejnowski, 1995). The resulting 47 aggregate group components were then backprojected using the GICA3 algorithm (Erhardt et al., 2011), yielding corresponding individual-subject independent components (ICs) and time courses. Mean group ICs and time courses were then generated across subjects (Fig. 1).
355 356
O
295 296
measures and functional connectivity of participants at baseline before the RAP training (i.e., Test 1). To relate the behavioral gains from training to the change in functional connectivity between the ICs, we calculated the difference in connectivity before and after the RAP training for each pair of components for each participant and performed Pearson correlations between the difference in reading measures and the change in functional connectivity.
357 358 359 360 361 362
365 366 367 368 369 370 371 372 373 374 375 376 Q13
379 380 381 382 383 384 385 386 387 388 389 390 391 392 393 394 395 396 397 398 399 400 401 402 403 404
406 407 408 409 410 411 412
2.5.4. Accelerated training condition 413 In the first training session, 50 sentences were presented consecu- 414 tively on the screen. The letters in each sentence disappeared one 415
Please cite this article as: Horowitz-Kraus, T., et al., Increased resting-state functional connectivity of visual- and cognitive-control brain networks after training in children with re..., NeuroImage: Clinical (2015), http://dx.doi.org/10.1016/j.nicl.2015.06.010
5
T. Horowitz-Kraus et al. / NeuroImage: Clinical xxx (2015) xxx–xxx
after the other, according to the mean reading time (milliseconds per letter) recorded on the pre-test. Following the disappearance of the sen418 tence from the computer screen, participants were instructed to answer 419 the question at a self-paced rate. The per-letter “presentation rate” 420 decreased from one sentence to the next in steps of 2% (Breznitz, 421 Q14 1997a,b) in a staircase-like procedure, and the “disappearance rate” in422 creased only when the participants3 answers to the probe questions 423 were correct for 10 consecutive sentences.
the RAP) in Test 2 versus Test 1 compared to the TRs. See Table 1 for 436 these results. 437
416 417
3.2. Imaging data
438
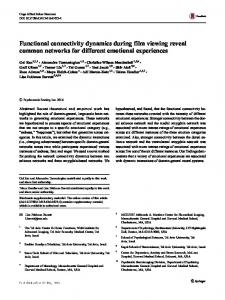
3.2.1. Selection of group ICs Of the 47 group ICs for all conditions (i.e., children with RD in Tests 1 and 2, and TRs in Tests 1 and 2), eight survived our exclusion criteria, and one IC representing the visual processing independent component (IC1) was selected as the IC to which connectivity was assessed, as shown in Fig. 2. Spatial maps of the remaining seven ICs are presented in Fig. 3. Note that each group aggregate IC map (shown in Figs. 2 and 3) was thresholded at 99% of the robust range to generate these figures, where the robust range was defined as the 2nd–98th percentiles of voxel intensities within a volume.
439
3.2.2. Functional connectivity between the visual processing component and the other components RM-ANOVA revealed a main effect of Group for IC1−IC4 [F(1,30) = 7.586, P b 0.05, ɳ2 = 0.202], revealing an overall greater functional connectivity between the visual and sensory–motor ICs in children with RD compared to TRs; a main effect of Test for IC1−IC7 [F(1,30) = 5.548, P b 0.05, ɳ2 = 0.156], and IC1−IC8 [F(1,30) = 2.689, P b 0.05, ɳ2 = 0.082] was also found, suggesting greater functional connectivity
449 450
3. Results
425
3.1. Behavioral data
426 427
435
The different two-way (2 × 2) RM-ANOVAs [Group (children with RD, TRs)] × [Test (Test 1, Test 2)] revealed greater word and nonword reading scores after intervention in both children with RD and TRs with relatively lower reading scores in children with RD as compared to TRs (from the TOWRE, for words and nonwords). The same direction of results was observed for the contextual fluency reading as well as reading speed and comprehension conditions: Although both reading groups gained from training (i.e., a main effect of Test), children with RD showed a relatively greater increase in reading fluency (from the GORT-IV) and speed per sentence and comprehension scores (from
t1:1 t1:2
Table 1 Reading measures in participants (children with reading difficulties and typical readers) prior to (Test 1) and following (Test 2) training with the Reading Acceleration Program.
428 429 430 431 432
Test
RD group
t1:5
TR group
Test 1(A) Word recognition
TOWRE (SWE) (percentile)
Test 2(B)
12.6 (13.7)
TOWRE (PWE) (percentile)
9.69 (12.03)
Contextual reading speed (per paragraph)
t1:21
t1:25 t1:26 t1:27 t1:28 t1:29 t1:30 t1:31 t1:32
O
Acceleration speed (ms/letter) (from the RAP)
N
t1:17 t1:18 t1:19 t1:20
U
t1:16
t1:24
F test
Contrast
73.35 (16.08)
Test: [F(1,38) = 25.87*** ή2 = 0.41] Group: [F(1,3) = 87.86*** ή2 = 0.70] Interaction: [F(1,38) = 4.59* ή2 = 0.11]
AbB
−2.43*
AbC
−9.09***
BbD
−12.31***
17.06 (17.49)
59.8 (20.18)
CbD AbB
−5.43*** −2.74**
AbC
−11.57***
BbD
−12.31***
CbD ANB
−4.75*** 2.32*
74.7 (19.14)
166.88 (60.3)
125.91 (44.1)
103.55 (39.58)
71.57 (19.17)
C
Contextual reading speed (per letter)
R
t1:11
t1:23
56.45 (20.28)
Test 2(D)
R
Nonword decoding
t1:10
t1:22
18.66 (17.62)
E
t1:7
t1:12 t1:13 t1:14 t1:15
Test 1(C)
C
t1:6
t1:8 t1:9
E
Ability
t1:4
T
t1:3
D
P
433 434
R O O F
424
Contextual comprehension
GORT-IV, Fluency (percentile)
Acceleration comprehension (percentile) (from the RAP)
11 (7.66)
64 (6.97)
14.67 (10.62)
88.37 (7.2)
59.3 (19.77)
96.36 (5.35)
71.9 (17.74)
95.86 (6.39)
Test: [F(1,38) = 17.39*** ή2 = 0.405] Group: [F(1,38) = 98.18*** ή2 = 0.72]
Test: [F(1,36) = 13.59** ή2 = 0.27] Group: [F(1,36) = 32.69*** ή2 = 0.48]
Test: [F(1,39) = 32.80*** ή2 = 0.46] Group: [F(1,39) = 144.30*** ή2 = 0.79] Interaction: [F(1,39) = 10.86** ή2 = 0.22] Test: [F(1,39) = 65.26*** ή2 = 0.64] Group: [F(1,39) = 168.75*** ή2 = 0.82] Interaction: [F(1,39) = 70.93*** ή2 = 0.66]
t-Score (P value)
ANC
3.780***
BND
5.01***
CND CbD
4.56*** −6.39**
AbC
−10.04***
BbD
−12.38**
AbB
−10.46
AbC
−16.14***
BbD
−3.39**
Results are presented as mean (standard deviation) of reading measures before (Test 1) and after (Test 2) training intervention in RD versus TR. Results for the F test from the RM ANOVA as well as post-hoc t-tests are provided. Contrasts for the t-test analyses are provided in the right column. All results were corrected for multiple comparisons, per test, using Bonferroni correction. RD, children with reading difficulties; TR, typical readers; TOWRE, test of word reading efficiency; SWE, site word efficiency; PWE, pseudoword efficiency; RAP, Reading Acceleration Program; GORT-IV, Gray oral reading test. * P b 0.05. ** P b 0.01. *** P b 0.001.
Please cite this article as: Horowitz-Kraus, T., et al., Increased resting-state functional connectivity of visual- and cognitive-control brain networks after training in children with re..., NeuroImage: Clinical (2015), http://dx.doi.org/10.1016/j.nicl.2015.06.010
440 441 442 443 444 445 446 447 448
451 452 453 454 455 456
6
D
P
R O
O
F
T. Horowitz-Kraus et al. / NeuroImage: Clinical xxx (2015) xxx–xxx
T
E
Fig. 2. Independent component 1 (IC1) represents the visual processing component. IC1 corresponds to the visual processing component (Smith et al., 2009) including bilateral occipital lobe: fusiform gyrus (BA 37), cuneus (BA 17), lingual gyrus (BA 17), and inferior temporal gyrus (BA 19). Axial slices are Z = 13 up to Z = 42. Activation levels are represented by color, ranging from green = lesser activation to red = greater activation. Radiological orientation used; Left = Right, Right = Left. Intensity = 14.43.
482
3.3. Correlation of behavioral and imaging data
483 484
Pearson correlation between the behavioral measures before training (Test 1) and the connectivity values between pairs of ICs before training revealed a significant negative correlation between the connectivity of IC1 (visual processing component) and IC4 (sensory–motor component) and the word and nonword reading scores (from the
466 467 468 469 470 471 472 473 474 475 476 477 478 479
485 486 487
E
R
R
464 465
O
463
C
461 462
U N
459 460
C
480 481
between the visual component and the dorsal attention and memory components following intervention (Test 2 as compared to Test 1). A significant Group × Test interaction was found for IC1−IC2 [F(1,30) = 6.275, P b 0.05, ɳ2 = 0.173], IC1−IC5 [F(1,30) = 5.81, P b 0.05, ɳ2 = 0.162], and IC1−IC6 [F(1,30) = 4.372, P b 0.05, ɳ2 = 0.127] demonstrating overall increased correlation coefficient values following intervention in children with RD between the visual component and EF, language, and OT stream components. The t-test analyses revealed that before intervention, children with RD showed decreased functional connectivity between IC1 (visual processing component) and IC2 (EF component) and between IC1 (visual processing component) and IC3 (attention component) as compared to TRs. However, children with RD showed greater functional connectivity between IC1 (visual processing component) and IC4 (sensory– motor component) as compared to TRs. After intervention, children with RD showed greater functional connectivity between IC1 (visual processing component) and IC5 (language component) as compared to TRs. Within-subject paired t-test analysis revealed that after training, children with RD demonstrated greater functional connectivity between IC1 (visual processing component) and IC2 (EF component) and between IC1 and ICs 6–8 (occipito-temporal, dorsal attention, and memory components), whereas TRs showed decreased functional connectivity between IC1 (visual component) and IC5 (language component) after training (Table 2).
457 458
TOWRE word recognition subtest: r = −0.526, P b 0.01; and from the TOWRE nonword decoding task: r = −0.499, P b 0.01). These findings suggest that greater functional connectivity between the visual and sensory–motor components is associated with decreased reading ability throughout the entire sample. Positive correlations of connectivity between IC1 (visual processing component) and IC3 (attention component) and between IC1 (visual processing component) and IC6 (occipito-temporal component) and word-recognition ability also were observed (although did not reach significance: r = 0.313, P = 0.07 and r = 0.324, P = 0.06, respectively). These results suggest that increases in functional connectivity between the visual component and attention or occipital–temporal components tend to be associated with better word reading at baseline, before reading training. The correlations between the gain in reading ability (the difference between reading speed and comprehension in Test 1 vs. Test 2, as measured by the RAP) and the change in connectivity after intervention revealed that greater gain in reading comprehension resulted in greater increases in functional connectivity between IC1 (visual processing component) and IC2 (EF component) in the entire sample (r = 0.482, P b 0.001). No significant correlation was found between behavioral measures and ICs 3–8.
488 489
4. Discussion
509
The goal of this study was to determine whether the previously found reading improvement following the RAP training involves changes in functional connectivity between the visual network (including the VWFA) and networks related to EF, attention, memory, and language during the resting-state condition after the training (in the absence of a task). As postulated, our results demonstrate that reading improvement was accompanied by greater functional connectivity between the visual processing component and the attention, EF, and language components in both children with RD and TRs. After the RAP, TRs
510 511
Please cite this article as: Horowitz-Kraus, T., et al., Increased resting-state functional connectivity of visual- and cognitive-control brain networks after training in children with re..., NeuroImage: Clinical (2015), http://dx.doi.org/10.1016/j.nicl.2015.06.010
490 491 492 493 494 495 496 497 498 499 500 501 502 503 504 505 506 507 508
512 513 514 515 516 517 518
N
C
O
R
R
T. Horowitz-Kraus et al. / NeuroImage: Clinical xxx (2015) xxx–xxx
Please cite this article as: Horowitz-Kraus, T., et al., Increased resting-state functional connectivity of visual- and cognitive-control brain networks after training in children with re..., NeuroImage: Clinical (2015), http://dx.doi.org/10.1016/j.nicl.2015.06.010
U
E
C
T
E
D P
R O
O
F
Fig. 3. ICs correlated with IC1. Figures are in radiological orientation (Right = Left, Left = Right). Axial slices are Z = 13 up to Z = 42. Activation levels are represented by color, ranging from green = lesser activation to red = greater activation. Q2 (1) Executive functions component. IC2 corresponds to the frontal executive functions component (Smith et al., 2009; Hacker et al., 2013) including the left and right superior frontal gyrus (BA 8) and middle frontal gyrus (Koyama et al., 2013; Vogel et al., 2014). Intensity = 25.35 (2) Attention component. IC3 corresponds to the attention component (Smith et al., 2009) including the right and left anterior cingulate gyri (BA 24) and the superior frontal gyrus (BA 6). Intensity = 7.77. (3) Sensory–motor component. IC4 corresponds to the sensory motor component (see Hacker et al., 2013 not in the original refs list — more info?) and most prominently features the bilateral precentral gyrus (BA 5) and postcentral gyrus (BA 3). Intensity = 10.90. (4) Language component. IC5 corresponds to the language component (see Hacker et al., 2013) and most prominently features the bilateral inferior frontal gyrus (BA 44) and middle frontal gyrus (BA 10), anterior cingulate cortex (BA 24), left superior parietal lobe (BA 5), and left supramarginal gyrus (BA 40). Intensity = 6.53. (5) Occipito-temporal component. IC6 corresponds to the occipital temporal stream for naming and language (Koyama et al., 2013) including the right and left lingual gyrus (BA 18), right and left middle temporal gyrus (BA 21), and right and left fusiform gyrus (BA 37). Intensity = 30.30. (6) Dorsal attention component. IC7 corresponds to the dorsal attention component (Callejas et al., 2014; Vogel et al., 2014) including the left and right precuneus (BA 7), left and right superior frontal gyrus (BA 10), right and left lingual gyrus (BA 18), right and left middle temporal gyrus (BA 21), and right and left angular gyrus (BA 39). Intensity = 8.84. (7) Memory component. IC8 corresponds to the memory component (Karunanayaka et al., 2007; Smith et al., 2009) including the parahippocampal gyrus (BA 35). Intensity = 9.56.
7
8 t2:1 t2:2
T. Horowitz-Kraus et al. / NeuroImage: Clinical xxx (2015) xxx–xxx
Table 2 Results for correlation coefficient of the exported components before and after the reading intervention. Condition
Component
Regions (BA)
x
y
z
t2:4 t2:5 t2:6 t2:7 t2:8 t2:9 t2:10 t2:11 t2:12 t2:13 t2:14 t2:15 t2:16 t2:17 t2:18 t2:19 t2:20 t2:21 t2:22 t2:23 t2:24 t2:25 t2:26 t2:27 t2:28 t2:29 t2:30 t2:31 t2:32 t2:33 t2:34 t2:35 t2:36 t2:37
Component of interest
IC1: visual component
Children with RD Test 1 b TR Test 1
IC1 and IC2: executive functions
R inferior occipital gyrus (BA 18) L inferior occipital gyrus (BA 18) R superior frontal gyrus (BA 8) L superior frontal gyrus (BA 8) L middle frontal gyrus (BA 6) R middle frontal gyrus (BA 6) L anterior cingulate gyrus (BA 24) R anterior cingulate gyrus (BA 24) L insula (BA 13) R insula (BA 13) R precentral gyrus (BA 5) L precentral gyrus (BA 5) R paracentral gyrus (BA 5) L paracentral gyrus (BA 5) L cingulate (BA 31) R inferior frontal gyrus (BA 9) L inferior frontal gyrus (BA 9) L middle frontal gyrus (BA 8) L anterior cingulate gyrus (BA 24) L precuneus (BA 19) R lingual gyrus (BA 18) L lingual gyrus (BA 18) R inferior temporal gyrus (BA 20) L cuneus (BA 17) L inferior occipital gyrus (BA 17) R precuneus (BA 7) L precuneus (BA 7) R superior frontal gyrus (BA 9) Left superior temporal gyrus (BA 39) R angular gyrus (BA 39) L parahippocampal gyrus (BA 35) R parahippocampal gyrus (BA 35) See above See above
24 −30 18 −21 −33 36 0 3 −42 42 30 −30 3 −3 0 51 −48 −48 −3 −33 18 −15 60 0 −15 3 −3 6 −54 57 −27 30
−96 −90 39 39 18 18 33 30 3 12 −36 −36 −36 −36 −36 15 15 24 0 −63 −87 −90 −54 −96 −96 −60 −60 57 −60 −54 −27 6
3 −9 51 51 57 57 18 18 15 18 57 57 54 54 36 27 27 30 30 48 −12 −12 −15 6 −6 45 45 24 24 24 −24 −21
Children with RD Test 2 N children with RD Test 1
IC1 and IC6: the OT stream
D
IC1 and IC7: dorsal attention
IC1 and IC8: memory IC1 and IC2: executive functions IC1 and IC5: language
T
TR Test 2 b TR Test1
P
IC1 and IC5: language
E
Children with RD Test 2 N TR Test 2
R O
IC1 and IC4: sensory–motor
O
IC1 and IC3: attention
Δr
P value
P-FDR corrected
0.16
0.02
0.05
0.13
0.05
0.11
0.17
0.01
0.05
0.18
0.02
0.11
.2
0.02
0.04
0.19
0.001
0.02
0.23
0.01
0.03
0.16 0.12
0.05 0.03
0.09 0.24
F
t2:3
The results of the difference in correlation coefficients between the component of interest (IC1) and the other components (IC2–8) between the different conditions are noted in the right columns (Δr = correlation coefficient value, P = significance without correction for multiple comparisons, FDR = significance with false discovery rate correction for multiple comparisons). All results were corrected for multiple comparisons using false discovery rate (FDR). BA, Brodmann area; IC, independent components; RD, children with reading difficulty; TR, typical readers; L, left; R, right; OT, occipito-temporal.
519 520
showed decreased functional connectivity between the visual and language components, which involve frontal regions. Interestingly, the components in which connectivity changes correlated with reading changes share regions that are part of the fronto-parietal or cinguloopercular networks. These results suggest that the fronto-parietal network is involved in reading, as has been previously suggested (Dosenbach et al., 2008; Vogel et al., 2014). The results also demonstrate the involvement of regions that are part of the cingulo-opercular network (i.e., the ACC), which is supported by the literature indicating the positive effect of the RAP training on error monitoring (evoked from the ACC) in both TRs and children with RD (Horowitz-Kraus and Breznitz, 2013). In addition, our results confirm the positive effect of the RAP training on rewiring neural circuits related to the visual processing, EF, attention, memory, and language regions in individuals with RD (Breznitz et al., 2013; Horowitz-Kraus and Breznitz, 2013; Horowitz-Kraus et al., 2014a; Horowitz-Kraus et al., 2014b; Niedo et al., 2014) even in the absence of stimuli (i.e., in a resting-state condition), which supports our original hypotheses.
527 528 529 530 531 532 533 534 535 536 537 538 539 540 541 542 543
R
O
525 526
C
523 524
U N
521 522
R
E
C
t2:38 t2:39 t2:40 t2:41
4.1. Decreased functional connectivity between visual and attention and EF components in children with RD during rest Decreased functional connectivity between the visual processing (IC1) and EF (IC2) and attention (IC3) components in children with RD as compared to TRs during rest also has been suggested by Koyama and colleagues (Koyama et al., 2013), as well as by other neuroimaging studies indicating a decreased activation of neural circuits supporting EF
in children with RD (Wang, 2014; Black et al., 2012). Koyama and colleagues demonstrated weaker functional connections between the inferior parietal lobule and the middle frontal gyrus in children with RD (Koyama et al., 2013). Based on the ‘dual-networks top-down control’ model, the inferior parietal lobe (BA 7) and the middle frontal gyrus (BA 10) are part of the fronto-parietal network (Dosenbach et al., 2008). This network is particularly important for allocating visual attention during reading (Vogel et al., 2014). The activation of the frontal (inferior frontal gyrus and dorsolateral prefrontal cortex) and parietal (precuneus) regions that are part of this network has been determined to be predictive of proficient reading even before reading ability is completely acquired in 6 year-old children (Horowitz-Kraus et al., 2014c). Taken together, these findings support the suggestion that better reading ability is supported by neural networks related to cognitive control, i.e., the fronto-parietal network [as was also described by Dosenbach et al., 2008; Vogel et al., 2014]. However, a further study should examine the effect of the RAP training on a priori-defined regions of interest comprising the fronto-parietal network or using a parcellation approach [see also Power et al., 2011]. Interestingly, in addition to the decreased functional connectivity between the visual and frontal and parietal components, we also found an overall main effect of group as well as an increased functional connectivity between the visual processing (IC1) and sensory–motor (IC4; composed of frontal and parietal regions) components in children with RD compared to TRs before training (i.e., in Test 1). The sensory– motor deficit in individuals with RD related to the magnocellular difficulty in this population was described previously (Ramus, 2003; Stein,
Please cite this article as: Horowitz-Kraus, T., et al., Increased resting-state functional connectivity of visual- and cognitive-control brain networks after training in children with re..., NeuroImage: Clinical (2015), http://dx.doi.org/10.1016/j.nicl.2015.06.010
544 545 546 547 548 549 550 551 552 553 554 555 556 557 558 559 560 561 562 563 564 565 566 567 568 569 570
T. Horowitz-Kraus et al. / NeuroImage: Clinical xxx (2015) xxx–xxx
594 595 596 597 598 599 600 601 602 603 604 605 606 607 608 609 610 611 612 613 614 615 616 617 618 619 620 621 622 623 624 625 626 627 628 629 630 631 632 633 634
R O O F
593
4.2. The effect of the RAP on functional connectivity of the visual processing component and components related to cognitive control The current study confirms our hypothesis that greater functional connectivity between the visual processing component (IC1) and components related to cognitive control (i.e., IC2–EF, IC7–dorsal attention, and IC8–memory components) showed an increased functional connectivity after the RAP training, in both reading groups (i.e., a main effect of Test). We also hypothesized that greater functional connectivity would be found between the visual processing (IC1) and EF (IC2) components and dorsal attention (IC7) and memory (IC8) components in children with RD after the RAP training, even at rest. Moreover, an increased change in functional connectivity between IC1 (for visual processing) and IC2 (EF), IC6 (OT stream), and IC5 (language) was found to be significantly greater in the RD group, compared to the TRs (i.e., a significant interaction). This may explain previous findings showing overall improvements in attention and EF non-linguistic tasks following the RAP training (Horowitz-Kraus and Breznitz, 2013), as well as an overall improvement in the linguistic domain in both children with RD and TRs, compared to children with RD who did not train on the RAP program (Horowitz-Kraus et al., 2014b). The greater reliance on frontal regions following acceleration manipulation also has been reported in adult TRs (Benjamin and Gaab, 2012). The role of the frontal lobe as a possible compensatory pathway in children with RD by means of semantic retrieval or reliance on EF was previously suggested (Pugh et al., 2000; Rumsey et al., 1997). The functional regions of the EF and dorsal attention components found in the current study are part of the frontoparietal network (Dosenbach et al., 2008). Our results therefore suggest that these sub-regions of the fronto-parietal network, which are involved in rapid adaptive control processes, also are affected by the RAP. Previous results from studies of the effect of the RAP have suggested that improved reading and EF are related to both better error monitoring (Horowitz-Kraus and Breznitz, 2014) and greater involvement of cognitive-control processes related directly to reading (HorowitzKraus et al., 2014a, 2014b). In addition to the involvement of parts of the fronto-parietal network (the first network in the ‘dual-networks top-down control’ model) in the significantly increased functional connectivity with the visual processing components (IC1) after training, we also found increased functional connectivity between IC1 and the occipital–temporal components (IC 6, which includes the ACC), as well as the language component (IC5, which includes the ACC), which may be related to a greater involvement of the cingulo-opercular network.
P
592
D
590 591
The cingulo-opercular network is the second network in the ‘dualnetworks top-down control’ model and is related to sustained adjustments for feedback control and error monitoring (Dosenbach et al., 2008). Interestingly, rather than being autonomous, the two control networks work with each other and also with the cerebellum where error information is both received and sent (Dosenbach et al., 2008). In the current study, sub-regions of the cingulo-opercular network were found to be positively correlated with the visual processing components following training with the RAP, which confirms our previous findings of greater error-monitoring processes after training (Horowitz-Kraus and Breznitz, 2013). The ACC plays an important role in error monitoring (Falkenstein et al., 1991). The activation of this region in typical developing 6 and 11 year-old children during a verbgeneration task was found to be positively correlated with reading at the age of 16 years (Horowitz-Kraus et al., 2014c). The authors suggest that this region may be more active when reading has not been fully mastered, and therefore this process demands a greater monitoring. We previously demonstrated that training with the RAP results in greater activation of the error-monitoring system while performing reading errors, which was positively correlated with reading accuracy and speed in children with RD and TRs (Horowitz-Kraus and Breznitz, 2013). This was consistent with the greater functional connectivity between the FG (which is part of the VWFA) and the ACC in children with RD during a lexical decision task after training with the RAP. As suggested previously (Breznitz et al., 2013), the manipulation of the RAP involves erasing letters from the screen, which requires several steps: 1) The trainees develop a better visual attention allocation, store the phonemes and then the words in memory, and then retrieve them for the comprehension stage: all of which demand better higher-order processes in reading. 2) After executing the response (i.e., reading the word), the trainees need to monitor their performance, which requires a comparison of the desired form of the word (stored in the mental lexicon) to the actual read word, and this is done in the process of error monitoring (Horowitz-Kraus and Breznitz, 2008). We suggest that the first stage can be represented by the increased functional connectivity between the visual and the EF, attention, and memory components (all involve regions of the fronto-parietal network), which also is supported by the positive correlation we determined between the functional connectivity of the visual processing and the EF components with reading comprehension. The second stage may involve greater functional connectivity with the occipito-temporal and language components and involves regions that are part of the cingulo-opercular network. These encouraging findings may lead to examination of the cingulo-opercular network specifically in children with RD and an examination of the functional connectivity of this network with the VWFA after training with the RAP. According to our data and in contrast with the children with RD, TRs showed less functional connections between the visual processing (IC1) and language (IC5) components after training. These findings can be interpreted in several ways. First, the language component is comprised of the ACC, which is part of the cingulo-opercular network. In line with our previous assumption, it may be that for TRs less monitoring is needed and hence, less engagement required for the ACC during the reading process after the RAP resulting in decreased functional connections of IC1 and IC5. This also has been confirmed by the absence of ACC activation in TRs at the age of 16 (Horowitz-Kraus et al., 2014c). Second, previous studies have shown that the lower the starting point is, the higher the gain from the RAP training (Horowitz-Kraus and Breznitz, 2013). We suggest that for TRs, who have intact reading to start with, a longer/more intense intervention is needed to modify the functional connectivity between the visual component and regions participating in the fronto-parietal/cingulo-opercular networks involved in reading. Third, it is possible that since the current task is a resting-state condition, the executive-control process specifically for reading did not show as much change in TRs as in children with RD. Future studies using region of interest-based analysis focusing on reading and EF-
E
588 589
T
586 587
C
584 585
E
582 583
R
580 581
R
578 579
O
577
C
575 576
N
573 574
2001; Stoodley et al., 2000). We suggest that the increased functional connectivity between IC1 and IC4 is linked to the pathology of individuals with RD: slower word and nonword reading. This is supported by the correlation of the functional connectivity between IC1 and IC4 and slower reading pace (as measured by the RAP) in this study. This assumption does not contradict the positive contribution of the frontoparietal network to the reading process, since the post-central and pre-central gyri that comprise the sensory–motor component are not part of the fronto-parietal network (Dosenbach et al., 2008). Our data, specifically the decreased functional connectivity of the visual processing (IC1) and the attention (IC3) components in children with RD compared to TRs before intervention, connect the impairments in attentional and EF processes to difficulties with reading found in children with RD (Facoetti et al., 2000; Horowitz-Kraus, 2014; Shaywitz and Shaywitz, 2008). Attention and EF should be allocated to the process of letter selection from irrelevant letters (Bouma, 1970; Bouma and Legein, 1977) by rapid orienting of visual attention (Yeshurun and Rashal, 2010) before the correct letter-to-speech sound integration applies (Facoetti et al., 2000; Hari and Renvall, 2001; Vidyasagar and Pammer, 2010; Zorzi et al., 2012). Ultimately, the next intriguing question is whether a reading training that is EF-based, such as the RAP, improves reading through modifying these functional connections.
U
571 572
9
Please cite this article as: Horowitz-Kraus, T., et al., Increased resting-state functional connectivity of visual- and cognitive-control brain networks after training in children with re..., NeuroImage: Clinical (2015), http://dx.doi.org/10.1016/j.nicl.2015.06.010
635 636 637 638 639 640 641 642 643 644 645 646 647 648 649 650 651 652 653 654 655 656 657 658 659 660 661 662 663 664 665 666 667 668 669 670 671 672 673 674 675 676 677 678 679 680 681 682 683 684 685 686 687 688 689 690 691 692 693 694 695 696 697 698 699 700
10
T. Horowitz-Kraus et al. / NeuroImage: Clinical xxx (2015) xxx–xxx
724 725 726 727 728 729 730 731 732 733 734 735 736 737 738 739 740 741 742 743 744 745 746 747 748
751
This work was supported by the Fulbright Foundation, the United
752 Q15 States–Israel Binational Science Foundation (BSF), and the University 753 Q16 of Cincinnati Research Council.
754
Acknowledgments
755
The authors thank Kendall O3Brien, the Imaging Research Center technologist, for his assistance in acquiring the imaging data and J. Denise Wetzel, CCHMC Medical Writer, for editing the manuscript. The authors also would like to thank the Edmond J. Safra Brain Center for the Studies of Learning Disabilities, University of Haifa, Israel, for providing the Reading Acceleration Program.
756 757 758 759 760
O
F
762 763 764 765 766 767 768 769 770 771 772 773 774 775 776 777 778 779 780 781 782 783 784 785 786 787 788 789 790 791 792 793 794 795 796 797 798 799 800 801 802 803 804 805 806 807 808 809 810 811 812 813 814 815 816 817 818 819 820 821 822 823 824 825 826 827 828 829 830 831 832 833 834 835 836 837 838 839 840 841 842 843 844 845
R O
722 723
Altaye, M., Holland, S.K., Wilke, M., Gaser, C., 2008. Infant brain probability templates for MRI segmentation and normalization. NeuroImage 43 (4), 721–730. http://dx.doi. org/10.1016/j.neuroimage.2008.07.06018761410. Altemeier, L.E., Abbott, R.D., Berninger, V.W., 2008. Executive functions for reading and writing in typical literacy development and dyslexia. J. Clin. Exp. neuropsychol. 30 (5), 588–606. http://dx.doi.org/10.1080/1380339070156281818569253. Bell, A.J., Sejnowski, T.J., 1995. An information-maximization approach to blind separation and blind deconvolution. Neural Comput. 7 (6), 1129–1159. http://dx.doi.org/10. 1162/neco.1995.7.6.11297584893. Benjamin, C.F., Gaab, N., 2012. What3s the story? The tale of reading fluency told at speed. Hum. Brain Mapp. 33 (11), 2572–2585. http://dx.doi.org/10.1002/hbm. 2138421954000. Black, J.M., Tanaka, H., Stanley, L., Nagamine, M., Zakerani, N., Thurston, A., Kesler, S., Hulme, C., Lyytinen, H., Glover, G.H., Serrone, C., Raman, M.M., Reiss, A.L., Hoeft, F., 2012. Maternal history of reading difficulty is associated with reduced languagerelated gray matter in beginning readers. Neuroimage 59 (3), 3021–3032. http://dx. doi.org/10.1016/j.neuroimage.2011.10.02422023744. Bouma, H., 1970. Interaction effects in parafoveal letter recognition. Nature 226 (5241), 177–178. http://dx.doi.org/10.1038/226177a05437004. Bouma, H., Legein, C.P., 1977. Foveal and parafoveal recognition of letters and words by dyslexics and by average readers. Neuropsychologia 15 (1), 69–80. http://dx.doi. org/10.1016/0028-3932(77)90116-6831155. Breznitz, Z., 2006. Fluency in Reading: Synchronization of Processes. Lawrence Erlbaum Associates, Mahwah, NJ. Breznitz, Z., Leikin, M., 2000. Syntactic processing of Hebrew sentences in normal and dyslexic readers: electrophysiological evidence. J. Genet. Psychol. 161 (3), 359–380. http://dx.doi.org/10.1080/0022132000959671810971914. Breznitz, Z., Leikin, M., 2001. Effects of accelerated reading rate on processing words3 syntactic functions by normal and dyslexic readers: event related potentials evidence. J. Genet. Psychol. 162 (3), 276–296. http://dx.doi.org/10.1080/ 0022132010959748411678364. Breznitz, Z., Misra, M., 2003. Speed of processing of the visual–orthographic and auditory– phonological systems in adult dyslexics: the contribution of “asynchrony” to word recognition deficits. Brain Lang. 85 (3), 486–502. http://dx.doi.org/10.1016/S0093934X(03)00071-312744959. Breznitz, Z., Shaul, S., Horowitz-Kraus, T., Sela, I., Nevat, M., Karni, A., 2013. Enhanced reading by training with imposed time constraint in typical and dyslexic adults. Nat. Commun. 4, 1486. http://dx.doi.org/10.1038/ncomms248823403586. Brosnan, M., Demetre, J., Hamill, S., Robson, K., Shepherd, H., Cody, G., 2002. Executive functioning in adults and children with developmental dyslexia. Neuropsychologia 40 (12), 2144–2155. http://dx.doi.org/10.1016/S00283932(02)00046-512208010. Calhoun, V.D., Adali, T., Pearlson, G.D., Pekar, J.J., 2001. A method for making group inferences from functional MRI data using independent component analysis. Hum. Brain Mapp. 14 (3), 140–151. http://dx.doi.org/10.1002/hbm.104811559959. Calhoun, V.D., Kiehl, K.A., Pearlson, G.D., 2008. Modulation of temporally coherent brain networks estimated using ICA at rest and during cognitive tasks. Hum. Brain Mapp. 29 (7), 828–838. http://dx.doi.org/10.1002/hbm.2058118438867. Callejas, A., Shulman, G.L., Corbetta, M., 2014. Dorsal and ventral attention systems underlie social and symbolic cueing. J. Cogn. Neurosci. 26 (1), 63–80. http://dx.doi.org/10. 1162/jocn_a_0046123937692. Christopher, M.E., Miyake, A., Keenan, J.M., Pennington, B., DeFries, J.C., Wadsworth, S.J., Willcutt, E., Olson, R.K., 2012. Predicting word reading and comprehension with executive function and speed measures across development: a latent variable analysis. J. Exp. Psychol. Gen. 141 (3), 470–488. http://dx.doi.org/10.1037/ a002737522352396. Cohen, L., Dehaene, S., 2004. Specialization within the ventral stream: the case for the visual word form area. NeuroImage 22 (1), 466–476. http://dx.doi.org/10.1016/j. neuroimage.2003.12.04915110040. Cohen, L., Lehéricy, S., Chochon, F., Lemer, C., Rivaud, S., Dehaene, S., 2002. Languagespecific tuning of visual cortex? Functional properties of the visual word form area. Brain J. Neurol. 125 (5), 1054–1069. http://dx.doi.org/10.1093/brain/ awf09411960895. Damoiseaux, J.S., Rombouts, S.A., Barkhof, F., Scheltens, P., Stam, C.J., Smith, S.M., Beckmann, C.F., 2006. Consistent resting-state networks across healthy subjects. Proc. Natl. Acad. Sci. U. S. A. 103 (37), 13848–13853. http://dx.doi.org/10.1073/ pnas.060141710316945915. de Jong, P.F., 1998. Working memory deficits of reading disabled children. J. Exp. Child Psychol. 70 (2), 75–96. http://dx.doi.org/10.1006/jecp.1998.24519729450. Démonet, J.F., Taylor, M.J., Chaix, Y., 2004. Developmental dyslexia. Lancet 363 (9419), 1451–1460. http://dx.doi.org/10.1016/S0140-6736(04)16106-015121410. Dosenbach, N.U., Fair, D.A., Cohen, A.L., Schlaggar, B.L., Petersen, S.E., 2008. A dualnetworks architecture of top-down control. Trends Cogn. Sci. (Regul. Ed.) 12 (3), 99–105. http://dx.doi.org/10.1016/j.tics.2008.01.00118262825. Erhardt, E.B., Rachakonda, S., Bedrick, E.J., Allen, E.A., Adali, T., Calhoun, V.D., 2011. Comparison of multi-subject ICA methods for analysis of fMRI data. Hum. Brain Mapp. 32 (12), 2075–2095. http://dx.doi.org/10.1002/hbm.2117021162045. Facoetti, A., Paganoni, P., Turatto, M., Marzola, V., Mascetti, G.G., 2000. Visual–spatial attention in developmental dyslexia. Cortex J. Devoted Study Nerv. Syst. Behav. 36 (1), 109–123. http://dx.doi.org/10.1016/S0010-9452(08)70840-210728901. Falkenstein, M., Hohnsbein, J., Hoormann, J., Blanke, L., 1991. Effects of crossmodal divided attention on late ERP components. II. Error processing in choice reaction tasks. Electroencephalogr. Clin. Neurophysiol. 78 (6), 447–455. http://dx.doi.org/10.1016/ 0013-4694(91)90062-91712280.
P
720 721
C
718 719
E
716 717
R
714 715
R
712 713
O
710 711
C
708 709
U N
707
761
D
Funding
705 706
References
E
750
703 704
T
749
related seeds or a data-driven parcellation method [see Power et al., 2011] rather than using ICs might answer this question. The results of the current study should be evaluated taking into account the following limitations. First, the results represent the data from a resting-state condition and, despite the correlation analysis with behavioral measures, do not reflect the actual participating components in the reading process. A future study should examine the correlations between the visual and EF and attention components after training with the RAP during a reading task. Second, since our results showed that the visual component was correlated with components that are composed of regions that are parts of networks from the ‘dual-networks top-down control’ model, we have discussed the results in the context of the fronto-parietal and cingulo-opercular networks. However, it is important to note that since the main aim of the study was to examine the effect of the RAP training on the functional connections between the visual component and other components related to cognitive control and language, we were not focused on these cognitive-control networks specifically. To validate our interpretation, a region-of-interest analysis should be carried out using an a priori selection of the functional regions participating in the model. A further analysis should examine the functional connectivity of each of the voxels in the VWFA with the cingulo-opercular and fronto-parietal networks as has been done previously (Greene et al., 2014). Third, FDR correction was used to correct for multiple comparisons when considering differences in pairwise correlations between ICs within each experimental condition. Seven ICs being compared to an eighth IC equals 7 comparisons within each condition, times 4 experimental conditions equals 28 total comparisons. Since FDR was performed separately within each condition and not across all 28 comparisons, the reported corrected P values are smaller than they would be had FDR been performed across all 28 comparisons. Lastly, we selected an acquisition time of 5.5 min to facilitate compliance of our pediatric study population and minimize motion artifacts. Future studies might increase statistical power by increasing the acquisition time or concatenating several resting-state acquisitions. In conclusion, the current study indicates that the RAP, an intervention designed to improve reading performance in children with RD, is associated with changes in connectivity in EF, attention, memory, and language resting-state components that correlate with improvement in reading performance. The observation of changes in functional connectivity between these components and the visual-processing component, even in the absence of a linguistic task (i.e., at rest) suggests that the RAP has an effect on basic cognitive domains that can be detected even in the absence of a reading task. Therefore, two clinical implications should be considered: 1) Special attention should be given to EF, attention, and memory domains during diagnosis of children with RD. 2) Reading intervention programs should include an attention/EF/memory component in order to train these abilities as part of reading remediation.
701 702
Please cite this article as: Horowitz-Kraus, T., et al., Increased resting-state functional connectivity of visual- and cognitive-control brain networks after training in children with re..., NeuroImage: Clinical (2015), http://dx.doi.org/10.1016/j.nicl.2015.06.010
T. Horowitz-Kraus et al. / NeuroImage: Clinical xxx (2015) xxx–xxx
N
C
O
R
R
E
C
D
P
R O O F
deficits and treatment effects on attention in childhood absence epilepsy. Neurology 81 (18), 1572–1580. http://dx.doi.org/10.1212/WNL.0b013e3182a9f3ca24089388. Niedo, J., Lee, Y.-L., Breznitz, Z., Berninger, V.W., 2014. Computerized silent reading rate and strategy instruction for fourth graders at risk in silent reading rate. Learn. Disabil. Q. 37 (2), 100–110. http://dx.doi.org/10.1177/073194871350726324914248. Power, J.D., Cohen, A.L., Nelson, S.M., Wig, G.S., Barnes, K.A., Church, J.A., Vogel, A.C., Laumann, T.O., Miezin, F.M., Schlaggar, B.L., Petersen, S.E., 2011. Functional network organization of the human brain. Neuron 72 (4), 665–678. http://dx.doi.org/10. 1016/j.neuron.2011.09.00622099467. Price, C.J., Devlin, J.T., 2011. The interactive account of ventral occipitotemporal contributions to reading. Trends Cogn. Sci. (Regul. Ed.) 15 (6), 246–253. http://dx.doi.org/10. 1016/j.tics.2011.04.00121549634. Pugh, K.R., Mencl, W.E., Jenner, A.R., Katz, L., Frost, S.J., Lee, J.R., Shaywitz, S.E., Shaywitz, B.A., 2000. Functional neuroimaging studies of reading and reading disability (developmental dyslexia). Ment. Retard. Dev. Disabil. Res. Rev. 6 (3), 207–213. http://dx. doi.org/10.1002/1098-2779(2000)6:3b207::AID-MRDD8N3.0.CO;2-P10982498. Ramus, F., 2003. Developmental dyslexia: specific phonological deficit or general sensorimotor dysfunction? Curr. Opin. Neurobiol. 13 (2), 212–218. http://dx.doi.org/10. 1016/S0959-4388(03)00035-712744976. Rumsey, J.M., Nace, K., Donohue, B., Wise, D., Maisog, J.M., Andreason, P., 1997. A positron emission tomographic study of impaired word recognition and phonological processing in dyslexic men. Arch. neurol. 54 (5), 562–573. http://dx.doi.org/10.1001/ archneur.1997.005501700420139152113. Schmithorst, V.J., Holland, S.K., 2004. Comparison of three methods for generating group statistical inferences from independent component analysis of functional magnetic resonance imaging data. J. Magn. Reson. Imaging 19 (3), 365–368. http://dx.doi.org/ 10.1002/jmri.2000914994306. Schmithorst, V.J., Holland, S.K., Plante, E., 2006. Cognitive modules utilized for narrative comprehension in children: a functional magnetic resonance imaging study. NeuroImage 29 (1), 254–266. http://dx.doi.org/10.1016/j.neuroimage.2005.07. 02016109491. Shaywitz, S.E., Shaywitz, B.A., 2008. Paying attention to reading: the neurobiology of reading and dyslexia. Dev. psychopathol. 20 (4), 1329–1349. http://dx.doi.org/10.1017/ S095457940800063118838044. Smith, S.M., Fox, P.T., Miller, K.L., Glahn, D.C., Fox, P.M., Mackay, C.E., Filippini, N., Watkins, K.E., Toro, R., Laird, A.R., Beckmann, C.F., 2009. Correspondence of the brain3s functional architecture during activation and rest. Proc. Natl. Acad. Sci. U. S. A. 106 (31), 13040–13045. http://dx.doi.org/10.1073/pnas.090526710619620724. Stein, J., 2001. The magnocellular theory of developmental dyslexia. Dyslexia 7 (1), 12–36. http://dx.doi.org/10.1002/dys.18611305228. Stoodley, C.J., Talcott, J.B., Carter, E.L., Witton, C., Stein, J.F., 2000. Selective deficits of vibrotactile sensitivity in dyslexic readers. Neurosci. Lett. 295 (1–2), 13–16. http:// dx.doi.org/10.1016/S0304-3940(00)01574-311078925. Turkeltaub, P.E., Gareau, L., Flowers, D.L., Zeffiro, T.A., Eden, G.F., 2003. Development of neural mechanisms for reading. Nat. Neurosci. 6 (7), 767–773. http://dx.doi.org/10. 1038/nn106512754516. Valdois, S., Bosse, M.L., Tainturier, M.J., 2004. The cognitive deficits responsible for developmental dyslexia: review of evidence for a selective visual attentional disorder. Dyslexia 10 (4), 339–363. http://dx.doi.org/10.1002/dys.28415573964. Vidyasagar, T.R., Pammer, K., 2010. Dyslexia: a deficit in visuo-spatial attention, not in phonological processing. Trends Cogn. Sci. (Regul. Ed.) 14 (2), 57–63. http://dx.doi. org/10.1016/j.tics.2009.12.00320080053. Vinckier, F., Dehaene, S., Jobert, A., Dubus, J.P., Sigman, M., Cohen, L., 2007. Hierarchical coding of letter strings in the ventral stream: dissecting the inner organization of the visual word-form system. Neuron 55 (1), 143–156. http://dx.doi.org/10.1016/j. neuron.2007.05.03117610823. Vogel, A.C., Miezin, F.M., Petersen, S.E., Schlaggar, B.L., 2012. The putative visual word form area is functionally connected to the dorsal attention network. Cereb. Cortex 22 (3), 537–549. http://dx.doi.org/10.1093/cercor/bhr10021690259. Vogel, A.C., Petersen, S.E., Schlaggar, B.L., 2013. Matching is not naming: a direct comparison of lexical manipulations in explicit and implicit reading tasks. Hum. Brain Mapp. 34 (10), 2425–2438. http://dx.doi.org/10.1002/hbm.2207722711620. Vogel, A.C., Petersen, S.E., Schlaggar, B.L., 2014. The VWFA: it3s not just for words anymore. Front. Hum. Neurosci. 8, 88. http://dx.doi.org/10.3389/fnhum.2014.0008824688462. Wang, Y., Danielle, N.M.R., Sliva, M., Mauer, S., Powers, B., Becker, B., Peysakhovich, N., Gaab, 2014. Atypical Development of Executive Function in Pre-readers at Familial Risk for Dyslexia: A Longitudinal fMRI Study. Cognitive Neuroscience Society, Boston, USA. Yeshurun, Y., Rashal, E., 2010. Precueing attention to the target location diminishes crowding and reduces the critical distance. J. vis. 10 (10), 16. http://dx.doi.org/10. 1167/10.10.1620884481. Yourganov, G., Schmah, T., Small, S.L., Rasmussen, P.M., Strother, S.C., 2010. Functional connectivity metrics during stroke recovery. Arch. Ital. Biol. 148 (3), 259–27021175012. Zorzi, M., Barbiero, C., Facoetti, A., Lonciari, I., Carrozzi, M., Montico, M., Bravar, L., George, F., Pech-Georgel, C., Ziegler, J.C., 2012. Extra-large letter spacing improves reading in dyslexia. Proc. Natl. Acad. Sci. U. S. A. 109 (28), 11455–11459. http://dx.doi.org/10. 1073/pnas.120556610922665803.
E
T
Gooch, D., Snowling, M., Hulme, C., 2011. Time perception, phonological skills and executive function in children with dyslexia and/or ADHD symptoms. J. Child Psychol. Psychiatry Allied Discip. 52 (2), 195–203. http://dx.doi.org/10.1111/j.1469-7610.2010. 02312.x20860755. Greene, D.J., Laumann, T.O., Dubis, J.W., Ihnen, S.K., Neta, M., Power, J.D., Pruett Jr., J.R., Black, K.J., Schlaggar, B.L., 2014. Developmental changes in the organization of functional connections between the basal ganglia and cerebral cortex. J. neurosci. off. j. Soc. Neurosci. 34 (17), 5842–5854. http://dx.doi.org/10.1523/JNEUROSCI.3069-13. 201424760844. Hari, R., Renvall, H., 2001. Impaired processing of rapid stimulus sequences in dyslexia. Trends Cogn. Sci. (Regul. Ed.) 5 (12), 525–532. http://dx.doi.org/10.1016/S13646613(00)01801-511728910. Heim, S., Wehnelt, A., Grande, M., Huber, W., Amunts, K., 2013. Effects of lexicality and word frequency on brain activation in dyslexic readers. Brain Lang. 125 (2), 194–202. http://dx.doi.org/10.1016/j.bandl.2011.12.00522230039. Helland, T., Asbjørnsen, A., 2000. Executive functions in dyslexia. Child Neuropsychol. J. Norm. Abnorm. Dev. Child. Adolesc. 6 (1), 37–48. http://dx.doi.org/10.1076/09297049(200003)6:1;1-B;FT03710980667. Horowitz-Kraus, T., 2014. Pinpointing the deficit in executive functions in adolescents with dyslexia performing the Wisconsin card sorting test: an ERP study. J. Learn. Disabil. 47 (3), 208–223. http://dx.doi.org/10.1177/002221941245308422907884. Horowitz-Kraus, T., Breznitz, Z., 2008. An error-detection mechanism in reading among dyslexic and regular readers — an ERP study. Clin. Neurophysiol. Off. J. Int. Fed. Clin. Neurophysiol. 119 (10), 2238–2246. http://dx.doi.org/10.1016/j.clinph.2008.06. 00918760961. Horowitz-Kraus, T., Breznitz, Z., 2013. Compensated dyslexics have a more efficient error detection system than noncompensated dyslexics. J. Child Neurol. 28 (10), 1266–1276. http://dx.doi.org/10.1177/088307381246091723112239. Horowitz-Kraus, T., Breznitz, Z., 2014. Can reading rate acceleration improve error monitoring and cognitive abilities underlying reading in adolescents with reading difficulties and in typical readers? Brain Res. 1544, 1–14. http://dx.doi.org/10.1016/j. brainres.2013.11.02724316242. Horowitz-Kraus, T., Cicchino, N., Amiel, M., Holland, S.K., Breznitz, Z., 2014a. Reading improvement in English- and Hebrew-speaking children with reading difficulties after reading acceleration training. Ann. Dyslexia 64 (3), 183–201. http://dx.doi.org/10. 1007/s11881-014-0093-424919641. Horowitz-Kraus, T., Vannest, J.J., Gozdas, E., Holland, S.K., 2014c. Greater utilization of neural-circuits related to executive functions is associated with better reading: a longitudinal fMRI study using the verb generation task. Front. Hum. Neurosci. 8, 447. http://dx.doi.org/10.3389/fnhum.2014.0044724999322. Horowitz-Kraus, T., Vannest, J.J., Kadis, D., Cicchino, N., Wang, Y.Y., Holland, S.K., 2014b. Reading acceleration training changes brain circuitry in children with reading difficulties. Brain Behav. 4 (6), 886–902. http://dx.doi.org/10.1002/brb3.28125365797. Houdé, O., Rossi, S., Lubin, A., Joliot, M., 2010. Mapping numerical processing, reading, and executive functions in the developing brain: an fMRI meta-analysis of 52 studies including 842 children. Dev. Sci. 13 (6), 876–885. http://dx.doi.org/10.1111/j.14677687.2009.00938.x20977558. Hyvärinen, A., Oja, E., 2000. Independent component analysis: algorithms and applications. Neural Netw. Off. J. Int. Neural Netw. Soc. 13 (4–5), 411–430. http://dx.doi. org/10.1016/S0893-6080(00)00026-510946390. Ihnen, S.K., Petersen, S.E., Schlaggar, B.L., 2015. Separable roles for attentional control subsystems in reading tasks: a combined behavioral and fMRI study. Cereb. Cortex 25 (5), 1198–1218. http://dx.doi.org/10.1093/cercor/bht31324275830. Karunanayaka, P., Kim, K.K., Holland, S.K., Szaflarski, J.P., 2011. The effects of left or right hemispheric epilepsy on language networks investigated with semantic decision fMRI task and independent component analysis. Epilepsy Behav. E B 20 (4), 623–632. http://dx.doi.org/10.1016/j.yebeh.2010.12.02921273134. Karunanayaka, P.R., Holland, S.K., Yuan, W., Altaye, M., Jones, B.V., Michaud, L.J., Walz, N.C., Wade, S.L., 2007. Neural substrate differences in language networks and associated language-related behavioral impairments in children with TBI: a preliminary fMRI investigation. NeuroRehabilitation 22 (5), 355–36918162699. Kim, K.K., Karunanayaka, P., Privitera, M.D., Holland, S.K., Szaflarski, J.P., 2011. Semantic association investigated with functional MRI and independent component analysis. Epilepsy Behav. E B 20 (4), 613–622. http://dx.doi.org/10.1016/j.yebeh.2010.11. 01021296027. Kiviniemi, V., Kantola, J.H., Jauhiainen, J., Hyvärinen, A., Tervonen, O., 2003. Independent component analysis of nondeterministic fMRI signal sources. NeuroImage 19 (2 Pt 1), 253–260. http://dx.doi.org/10.1016/S1053-8119(03)00097-112814576. Koyama, M.S., Di Martino, A., Kelly, C., Jutagir, D.R., Sunshine, J., Schwartz, S.J., Castellanos, F.X., Milham, M.P., 2013. Cortical signatures of dyslexia and remediation: an intrinsic functional connectivity approach. PLOS One 8 (2), e55454. http://dx.doi.org/10.1371/ journal.pone.005545423408984. Lassus-Sangosse, D., N3Guyen-Morel, M.A., Valdois, S., 2008. Sequential or simultaneous visual processing deficit in developmental dyslexia? Vision Res. 48 (8), 979–988. http://dx.doi.org/10.1016/j.visres.2008.01.02518331749. Masur, D., Shinnar, S., Cnaan, A., Shinnar, R.C., Clark, P., Wang, J., Weiss, E.F., Hirtz, D.G., Glauser, T.A., Childhood Absence Epilepsy Study, 2013. Pretreatment cognitive
U
846 847 848 849 850 851 852 853 854 855 856 857 858 859 860 861 862 863 864 865 866 867 868 869 870 871 872 873 874 875 876 877 878 879 880 881 882 883 884 885 886 887 888 889 890 891 892 893 894 895 896 897 898 899 900 901 902 903 904 905 906 907 908 909 910 911 912 913 914 915 916 917 918 919 920 921 922
11
Please cite this article as: Horowitz-Kraus, T., et al., Increased resting-state functional connectivity of visual- and cognitive-control brain networks after training in children with re..., NeuroImage: Clinical (2015), http://dx.doi.org/10.1016/j.nicl.2015.06.010
923 924 925 926 927 928 929 930 931 932 933 934 935 936 937 938 939 940 941 942 943 944 945 946 947 948 949 950 951 952 953 954 955 956 957 958 959 960 961 962 963 964 965 966 967 968 969 970 971 972 973 974 975 976 977 978 979 980 981 982 983 984 985 986 987 988 989 990 991 992 993 994 995 996 997 998