Available Online
J. Sci. Res. 5 (2), 235-244 (2013)
Publications
JOURNAL OF SCIENTIFIC RESEARCH www.banglajol.info/index.php/JSR
Indexing the Diffraction Patterns and Investigating the Crystal Structure of Pb-doped Strontium Ferrites Z. Ullah, S. Atiq *, and S. Naseem Centre of Excellence in Solid State Physics, University of the Punjab, Lahore-54590, Pakistan Received 7 August 2012, accepted in final revised form 22 February 2013 Abstract Strontium hexaferrites were prepared in powder form by sol-gel auto-ignition technique and Pb was doped in different concentrations to attain the various compositions Sr1-xPbxFe12O19 (x = 0.00, 0.05, 0.10, 0.15, 0.20). Sintering treatment of the samples was made at 800 oC for the development of stable hexagonal phase. X-ray diffraction analysis of the samples was carried out for the confirmation and determination of crystal structure of the material. Data obtained from X-ray diffraction analysis helped in determining various parameters of the samples like lattice parameters, volume of the unit cell, crystallite size, bulk density of the samples, X-ray density and porosity of the samples. Keywords:Ferrites; Sol-gel method; X-Ray diffraction; Crystal structure. © 2013 JSR Publications. ISSN: 2070-0237 (Print); 2070-0245 (Online). All rights reserved. doi: http://dx.doi.org/10.3329/jsr.v5i2.11578 J. Sci. Res. 5 (2), 235-244 (2013)
1.
Introduction
Strontium hexaferrites are the prominent magnetic materials due to their supreme applications in diversity of fields. Their latest use in recording media and microwave devices provided them distinctive ranking in the list of magnetic materials. Owing to their excellent chemical stability and easy and low cost manufacturing, these are being synthesized by variety of methods [1]. Besides co-precipitation, microemulsion [2] and conventional ceramic methods [3], these ferrites are also being synthesized by sol-gel technique [4]. The spectacular properties of these ferrites can be tuned according to the requirement, with the assistance of fundamental doping process. Doping of some appropriate element in a particular proportion can play a vital role in altering the astonishing properties of the materials. For example, doping of Pb in SrFe12O19 lowers its coercivity and remanence due to which general behavior of these ferrites is changed [1, 5]. This is also true for many other soft ferrites [6, 7]. *
Corresponding author:
[email protected]
236
Indexing the Diffraction Patterns
Crystal structure of the material controls its various properties [8]. Ferrites are classified with respect to their properties as well as crystal structure. Different types of ferrites like spinel, garnet and hexaferrites have different structures, varying from very easy to most complex [9]. Many scientists preceded their research work on investigation of crystal structure of SrFe12O19 and reported their detailed results. For instance, Fang et al. [10] determined the crystal structure of SrFe12O19 using density functional theory. The crystallographers have determined that the crystal structure of SrFe12O19 is hexagonal. Iqbal et al. [11] synthesized Zr-Zn doped SrFe12O19 and determined its lattice parameters, unit cell volume, crystallite size, bulk density, X-ray density and porosity by analyzing diffraction patterns. To investigate the material properties, it is necessary to know about its structure. Without attaining the knowledge of crystal structure of the materials, it becomes very hard to investigate its properties [8]. In the present paper, X-ray diffraction analysis of the compositions Sr1-xPbxFe12O19 (x = 0, 0.05, 0.1, 0.15, 0.2) has been discussed in details. A complete procedure of indexing and calculating various parameters related to this technique are explained in a simple way. This knowledge will provide a way to make a precise analysis of diffraction patterns of the other materials. 2. Experimental Procedure Sol-gel auto-combustion technique was used for the preparation of various compositions of Pb-doped SrFe12O19. For the preparation of compositions Sr1-xPbxFe12O19 (x = 0, 0.05, 0.1, 0.15, 0.2), required proportion of the metal nitrates and citric acid were measured with the help of a precise digital balance. All the materials were in powder form. Strontium nitrate (99%), iron (III) nitrate (98%), lead (II) nitrate (99%) and citric acid (99.5%) were dissolved in de-ionized water separately, and then mixed to make a total volume of 50 ml. pH-meter measured the pH of the solution as 2.5. The magnetic capsule (stirrer) was put in the solution and beaker was placed on a hotplate. The setup was housed in an ESCO fume hood. Stirring of solution was started and temperature of the hotplate was increased gradually up to 150 oC. The solution was heated and stirred for about 45 minutes, till the gel was formed. As the gel was formed, the temperature of the sample was further increased up to 250oC. The gel was heated at this temperature for about 30 minutes when its combustion was started. It was allowed to combust normally. The sample took about 30 minutes for its complete combustion. During this interval, various gases were evolved from the beaker. The end product was a homogenous dry powder. After complete combustion of the sample, the temperature of the hotplate was decreased gradually. Within 10 minutes, the hotplate was switched off and the sample was cooled down in air at room temperature. Although, the material was already in powder form but it became very fine after grinding, using an Agate mortar and pestle. Fine powder was put in the sample bottle. All the compositions were prepared in the same way. The samples were sintered at 800 oC for two hours in a muffle furnace. The prepared
Z. Ullah et al. J. Sci. Res. 5 (2), 235-244 (2013)
237
samples were analyzed for the crystal structure, using the diffraction pattern, obtained from X-ray diffraction (XRD). 3. Results and Discussion
Intensity (arb. units)
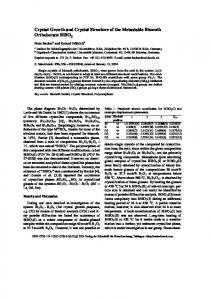
Data obtained from XRD for the first sample (x = 0) has been plotted in Fig. 1. The first task is to determine the crystal structure of the sample using this data. It is very tough job to determine the crystal structure of some unknown material, than that of a known one. In a diffraction pattern, the pattern of diffracted lines tells about the crystal structure, the positions of lines have information about the unit cell and the positions of the atoms can be judged by the intensities of the lines [8].
20
30
40
50
60
70
2θ (degree) Fig. 1. Plot of data received from X-ray diffractometer.
From the XRD pattern shown in Fig. 1, it is expected that it is the diffraction pattern of hexagonal SrFe12O19. The first step is to index this pattern that will tell about the crystal system, to which the material is belonged. For this, the values of sin2θ are calculated for all major diffraction lines, as tabulated in Table 1. These values provide a base to solve the pattern. If there are some diffraction lines due to impurities in material or due to other reasons, then it creates problems and needs extra skills to tackle them. A relation is developed by combing plane-spacing equation and Bragg’s law equation, which determines the Miller indices of some specific crystal system. Suppose, for a cubic system, this expression can be written as [8]:
(
)
=
=
(1)
238 Here
Indexing the Diffraction Patterns is a constant and s = h2 + k2 + l2, which is determined by sin2θ values.
For an unknown material, it has to be found that the values of sin2θ are integral multiple of which hkl values? First, we check the hkl values of a cubic system. If these do not satisfy, then we try for the other systems like tetragonal, hexagonal, etc. one by one. As the pattern under present study is expected to be of hexagonal crystal structure, hence it should obey the modified form of Eq. (1), given as [8]: sin2θ = A(h2 + hk + k2) + Cl2 Here, A =
and C =
(2)
. The value of ‘A’ can be obtained at hk0 (l = 0). Hence, the
2
permissible values of (h + hk + k2) are 1, 3, 4, 7, 9, etc. Therefore, the values of sin2θ in Table 1, were divided by 1, 3, 4, 7, etc. to get hkl values for hexagonal system, as shown in Table 2. Lattice parameter ‘a’ is calculated for all values of sin2θ. There is some order in particular values of ‘a’, being integral multiple of each other. Least value from them is the value of ‘a’ for 100 plane. Value a/2 is value of ‘a’ for 200 plane, and a/3 for 300 plane and so on. Table 1. Diffraction lines and their corresponding angles taken from diffraction plot. Line
2θ
θ
Sinθ
sin2θ
1 2 3 4 5 6 7 8 9 10 11 12 13 14 15 16 17 18 19 20
23.10 25.5 29.00 30.30 30.90 32.33 34.15 35.20 35.41 36.50 37.10 40.40 42.55 46.85 50.30 53.95 55.20 56.80 63.15 67.59
11.55 12.75 14.50 15.15 15.45 16.165 17.075 17.60 17.705 18.25 18.55 20.20 21.275 23.425 25.15 26.975 27.60 28.40 31.575 33.795
0.2002 0.2207 0.2504 0.2613 0.2664 0.2784 0.2936 0.3024 0.3041 0.3132 0.3181 0.3453 0.3628 0.3975 0.4250 0.4536 0.4633 0.4756 0.5236 0.5562
0.0401 0.0487 0.0627 0.0683 0.0710 0.0775 0.0862 0.0914 0.0925 0.0981 0.1012 0.1192 0.1317 0.1580 0.1806 0.2058 0.2146 0.2262 0.2742 0.3094
Z. Ullah et al. J. Sci. Res. 5 (2), 235-244 (2013)
239
Generally, smallest repeating value in all columns is found and is considered to be ‘A’. Lattice parameter is calculated for this value and crystal structure is determined. But sometimes, ‘A’ cannot be found for 100 plane, hence lattice parameter ‘a’ is calculated at hk0 for all sin2θ values, as was proceeded in the recent case. It is found that the diffraction line having sin2θ value of 0.0914, gave the most nearest value of ‘a’ for 200 plane. This repeating value was also found in the next column of Table 2, hence it was considered as ‘A’. ‘C’ was determined by the following relation [8]: sin2θ - A(h2 + hk + k2) = Cl2
(3)
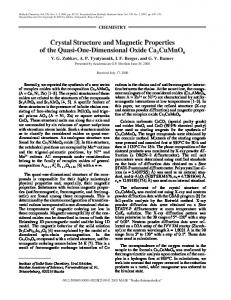
The values of A, 3A, 4A, etc. were subtracted from corresponding sin2θ values to find the remainders 1, 4, 9, 16, etc., as shown in Table 3. The value of ‘C’ was found to be 0.0011. The corresponding value of sin2θ is combination of 2A and C, hence hkl assigned to this value are 201. Such combinations (A+C, 2A+2C, 3A+C, 3A+2C, etc.) of sin2θ values were found to assign hkl values to various diffraction lines. These hkl values are listed in the most right column of Table 3 and are shown in Fig. 2. These hkl values confirm that the diffraction pattern belongs to a hexagonal crystal structure. The lattice parameter ‘c’ was calculated with the help of Eq. (4) [8]: Table 2. Values of sin2θ and its multiples (by , , ) to find out hkl. Line
sin2θ
1 2 3 4 5 6 7 8 9 10 11 12 13 14 15 16 17 18 19 20
0.0401 0.0487 0.0627 0.0683 0.0710 0.0775 0.0862 0.0914 0.0925 0.0981 0.1012 0.1192 0.1317 0.1580 0.1806 0.2058 0.2146 0.2262 0.2742 0.3094
sin 3 0.0134 0.0162 0.0209 0.0228 0.0237 0.0258 0.0287 0.0305 0.0308 0.0327 0.0337 0.0397 0.0439 0.0527 0.0602 0.0686 0.0715 0.0754 0.0914 0.1031
sin 4 0.0100 0.0122 0.0157 0.0171 0.0177 0.0194 0.0216 0.0229 0.0231 0.0245 0.0253 0.0298 0.0329 0.0395 0.0452 0.0514 0.0537 0.0566 0.0685 0.0773
sin 7 0.0057 0.0070 0.0090 0.0098 0.0101 0.0111 0.0123 0.0131 0.0132 0.0140 0.0145 0.0170 0.0188 0.0226 0.0258 0.0294 0.0307 0.0323 0.0392 0.0442
hkl
200
Indexing the Diffraction Patterns (4)
30
40
2014
300
1011
206
217
205
2011
220
114
106
110
20
200 201 108 203
107
#
006 105
"=
Intensity (arb. units)
240
50
60
70
2θ (degree) Fig. 2. Indexing of X-ray diffraction pattern.
Table 3. Values of sin2θ and subtracted ones to find out value of C. Line
sin2θ
1 2 3 4 5 6 7 8 9 10 11 12 13 14 15 16 17 18 19 20
0.0401 0.0487 0.0627 0.0683 0.0710 0.0775 0.0862 0.0914 0.0925 0.0981 0.1012 0.1192 0.1317 0.1580 0.1806 0.2058 0.2146 0.2262 0.2742 0.3094
sin2θ-A
0.0000 0.0011 0.0067 0.0098 0.0278 0.0403 0.0666 0.0892 0.1144 0.1232 0.1348 0.1828 0.2180
sin2θ-3A
hkl
0.0000 0.0352
006 105 106 110 008 107 114 200 201 202 203 205 206 1 0 11 209 300 217 2 0 11 220 2 0 14
Z. Ullah et al. J. Sci. Res. 5 (2), 235-244 (2013)
241
220 2014
217 2011
1011
209 300
200 201 108 203 205 206
006 105 106
110
Intensity (arb. units)
107 114
The same procedure was repeated for indexing the patterns of all the compositions as shown in Fig. 3 and their lattice parameters were determined in the same way. These values are listed in Table 4. The results show that the lattice parameters ‘a’ and ‘c’ are increased with increase in Pb concentration, as shown in Fig. 4. These changes may be due to larger ionic radius of Pb2+ (12.0 nm) than that of Sr2+ (11.3 nm) [9]. The c/a ratio was also calculated for all the samples.
X = 0.20 X = 0.15 X = 0.10 X = 0.05 X = 0.00
20
30
40
50
60
70
80
2θ (degree) Fig. 3. X-ray diffraction patterns of all the samples
The volume of the unit cell was calculated by the relation as in ref. [13]: $ = √3 × ' × = 0.866 ' "
(5)
Unit cell volumes of all the samples are also given in Table 4. Due to increasing trend of lattice parameters ‘a’ and ‘c’, the volume of the unit cell is also increased with increasing Pb contents, as reported previously [12]. The crystallite size was measured for peak (114) using Scherrer’s formula, given as [8]: D=
, - ./0
(6)
Here, ‘D’ is crystallite size, ‘λ’ is wavelength of incident X-ray, ‘β’ represents full width half maximum (FWHM) in radians, and ‘θ’ is Bragg angle. ‘k’ is a shape factor, having value of 0.94 in the recent case. Crystallite size calculated for various
242
Indexing the Diffraction Patterns
compositions is given in Table 4. It is clear that crystallite size is increased with increase in doping ratio, which might be due to larger ionic size of Pb2+ [12]. Although, there was no distinct peak of Pb in diffraction patterns of Pb-doped compositions, but the increase in lattice parameters, volume and crystallite size proves the presence of Pb. The bulk density of the material was calculated as in ref. [13]: 12 =
3
(7)
45 6
In this relation, ‘m’ is mass, ‘r’ is radius of the pellet in disk form and ‘h’ is height or thickness of the sample. Bulk density for all the materials has been calculated and it is observed that its value is increased with increase of Pb concentration which is according to the previous results [12]. The X-ray density was determined with the help of following expression [13]: 17 =
8
(8)
9: ;
where ‘M’ is molecular weight of the material and it is multiplied by ‘2’ because one unit cell contains two molecules of the material. ‘NA’ is Avogadro’s number and ‘V’ is volume of the unit cell, determined by Eq. (50.
5.890
23.24 Lattice Parameter a Lattice Parameter c
Å 23.23
5.888 23.22
5.886 5.884
23.21
5.882 23.20
5.880 0.00
0.05
0.10
0.15
Lattice Parameter c ( )
Å
Lattice Parameter a ( )
5.892
0.20
Pb Concentration Fig. 4. Effect of Pb doping on lattice parameters.
The calculated values of X-ray density are tabulated in Table 4. Now, porosity of the material can easily be determined by Eq. (8) [13]:
Z. Ullah et al. J. Sci. Res. 5 (2), 235-244 (2013)