H.W.G. Meesters, R. ter Hofstede, C.M. Deerenberg, J.A.M. Craeijmeersch, I.G. de Mesel, S.M.J.M. Brasseur, P.J.H. Reijnders & R. Witbaard
WOt
Wettelijke Onderzoekstaken Natuur & Milieu
Wettelijke Onderzoekstaken Natuur & Milieu
II. Ecoprofiles of indicator species for Wadden Sea, North Sea and Delta Area
WOt
Indicator system for biodiversity in Dutch marine waters
rapporten
82
Indicator system for biodiversity in Dutch marine waters
This report was produced in accordance with the Quality Manual of the Statutory Research Tasks Unit for Nature & the Environment.
The ‘WOt Reports’ series presents the findings of research projects implemented for the Statutory Research Tasks Unit for Nature & the Environment by various centres of expertise. WOt Report 82 presents the findings of a research project commissioned by the Netherlands Environmental Assessment Agency (PBL) and funded by the Dutch Ministry of Agriculture, Nature and Food Quality (LNV). This document contributes to the body of knowledge which will be incorporated in more policy-oriented publications such as the Nature Balance and Environmental Balance reports, and Thematic Assessments.
Indicator system for biodiversity in Dutch marine waters II. Ecoprofiles of indicator species for Wadden Sea, North Sea and Delta Area
H.W.G. Meesters R. ter Hofstede C.M. Deerenberg J.A.M. Craeijmeersch I.G. de Mesel S.M.J.M. Brasseur P.J.H. Reijnders R. Witbaard
Rapport 82 Wettelijke Onderzoekstaken Natuur & Milieu Wageningen, oktober 2008
Abstract Meesters, H.W.G., R. ter Hofstede, C.M. Deerenberg, J.A.M. Craeijmeersch, I.G. de Mesel, S.M.J.M. Brasseur, P.J.H. Reijnders & R. Witbaard with contributions by SOVON, 2008. Indicator system for biodiversity in Dutch marine waters; II. Ecoprofiles of indicator species for Wadden Sea, North Sea and Delta Area. Wageningen, Statutory Research Tasks Unit for Nature and the Environment. WOt-report 82. 164 p; 4 Tab.; 17 Ref. 1 Annex.
The report presents a large number of brief ecological descriptions, so-called ecoprofiles, of important indicator species for the Dutch marine waters. The species include birds, fish, sea mammals and invertebrates. Each ecoprofile offers information on important characteristics of the species, such as morphometric data, life history information, diet and dispersal information. It also provides information on the species’ sensitivity to environmental pressures and on the current monitoring programme and the data set available. Where available, mean numbers for each indicator are presented for the Wadden Sea, North Sea and Delta Area (in the south-western part of the Netherlands) over the 20012004 and 1999-2002 periods. Most ecoprofiles include natural reference values that are subsequently used to calculate Nature Quality. Results show that nature quality can differ substantially between indicators, periods and regions. The report argues for careful evaluation of the choice of indicators used to assess marine biodiversity.
Keywords: marine indicators, North Sea, Wadden Sea, Delta Area, biodiversity, ecoprofiles, nature quality, natural capital index.
Referaat Meesters, H.W.G., R. ter Hofstede, C.M. Deerenberg, J.A.M. Craeijmeersch, I.G. de Mesel, S.M.J.M. Brasseur, P.J.H. Reijnders & R. Witbaard, met bijdragen van SOVON, 2008 Indicatorsysteem voor biodiversiteit in Nederlandse mariene wateren, II Ecoprofielen van indicatorsoorten voor de Waddenzee, Noordzee en Delta. Wageningen, Wettelijke Onderzoekstaken Natuur & Milieu, WOt-rapport 82. 164 blz.; 4 tab.; 17 ref. 1 Bijlage.
In het rapport wordt een groot aantal korte ecologische beschrijvingen, zogenaamde ecoprofielen, gepresenteerd voor belangrijke indicatorsoorten voor de Nederlandse mariene wateren. Het gaat hierbij om vogels, vissen, zeezoogdieren en invertebraten. Elk ecoprofiel biedt informatie over belangrijke kenmerken van de soort, zoals morfometrische gegevens en informatie over leefwijze, voedingsgewoonten en verspreidingsmechanismen. Voorts bevat het profiel informatie over de gevoeligheid van de soort voor milieudruk en over bestaande monitoringsprogramma’s en beschikbare gegevensverzamelingen. Voor elke indicatorsoort worden (voor zover beschikbaar) de gemiddelde aantallen gegeven voor de Waddenzee, Noordzee en het Deltagebied, over de periode 2001-2004 en 1999-2002. In de meeste ecoprofielen zijn ook natuurlijke referentiewaarden opgenomen, die worden gebruikt om de natuurkwaliteit te berekenen. Uit de resultaten blijkt dat de natuurkwaliteit sterk kan verschillen tussen de diverse indicatorsoorten, perioden en locaties. Gepleit wordt voor een zorgvuldige evaluatie van de keuze van indicatorsoorten voor de bepaling van de mariene biodiversiteit.
Trefwoorden: mariene indicatorsoorten, Noordzee, Waddenzee, Deltagebied, biodiversiteit, ecoprofielen, natuurkwaliteit, Natural Capital Index
ISSN 1871-028X
©2008 IMARES Postbus 167, 1790 AD Den Burg Tel: (0317) 48 09 00; fax: (0317) 48 73 26; e-mail:
[email protected] The WOt Reports series is published by the Statutory Research Tasks Unit for Nature and the Environment, which is part of Wageningen University & Research Centre. This report can also be obtained from the Unit’s secretarial office. The report can also be downloaded from www.wotnatuurenmilieu.wur.nl.
Statutory Research Tasks Unit for Nature & the Environment, P.O. Box 47, NL-6700 AA Wageningen, The Netherlands Phone: +31 317 47 54 71; Fax: +31 317 41 90 00; e-mail:
[email protected]; Internet: www.wotnatuurenmilieu.wur.nl All rights reserved. No part of this publication may be reproduced and/or republished by printing, photocopying, microfilm or any other means without the publisher’s prior permission in writing. The publisher accepts no responsibility for any damage ensuing from the use of the results of this study or from the implementation of the recommendations contained in this report. 4
F-0010 vs. 1.5 [2008]
WOt-rapport 82 test Project WOT-04-002 – 231721-07 [Rapport 82 − oktober 2008]
Preface
This report is one of the results of a long-term programme commissioned by the Netherlands Environmental Assessment Agency (PBL) and carried out as statutary research task by IMARES. The programme aims to develop an indicator system for the marine environment that can be used to evaluate the status and biodiversity of the marine environment and the effectiveness of nature policy. The programme started in 2003 with a general overview of marine indicators and relevant international agreements, and resulteding in a list of potential indicators. The present report is a follow-up to that overview; it evaluates current knowledge about a large number of these indicators and presents a preliminary calculation of nature quality. The project was carried out in cooperation with SOVON, the Dutch Centre for Field Ornithology.
Erik Meesters, Project manager
Inhoud
Preface
5
Summary
9
Samenvatting
11
1
Introduction
13
2
Birds
15
2.1 2.2 2.3 2.4 2.5 2.6 2.7 2.8 2.9
15 16 19 22 25 28 31 34
2.10 2.11 2.12 2.13 2.14 2.15 2.16 2.17 2.18
Introduction Calidris alba (Sanderling / Drieteenstrandloper) Calidris canutus canutus/islandica (Great Knot / Kanoet) Recurvirostra avosetta (Pied Avocet / Kluut) Sterna albifrons albifrons (Little Tern / Dwergstern) Charadrius alexandrinus alexandrinus (Kentish Plover / Strandplevier) Pluvialis squaterola (Grey Plover / Zilverplevier) Phalacrocorax carbo sinensis (Great Cormorant / Aalscholver) Haematopus ostralegus ostralegus (Eurasian Oystercatcher / Scholekster) Nonbreeding Haematopus ostralegus ostralegus (Eurasian Oystercatcher / Scholekster) Breeding Sterna hirundo hirundo (Common Tern / Visdief) Somateria mollisima mollisima (Common Eider / Eidereend) non-breeding Somateria mollisima mollisima (Common Eider / Eidereend) breeding Limosa lapponica/taymirensis (Bar-tailed Godwit / Rosse Grutto) non-breeding Sterna sandvicensis sandvicensis (Sandwich Tern / Grote stern) Calidris alpina spec. (mainly alpina; Dunlin / Bonte strandloper) Branta bernicla bernicla (Dark-bellied Brent Goose / Zwartbuikrotgans) Relevant publications or expert group meetings
3
Fish
65
3.1 3.2 3.3 3.4 3.5 3.6 3.7 3.8 3.9 3.10 3.11 3.12 3.13
Introduction Surveys Merlangius merlangus (Whiting / Wijting ) Gadus Morhua (Cod / Kabeljauw) Zoarces viviparus (Eelpout / Puitaal) Melanogrammus aeglefinus (Haddock / Schelvis) Clupea harengus (Herring / Haring) Trisopterus esmarki (Norway pout / Kever) Pleuronectes platessa (Plaice / Schol) Osmerus eperlanus (Smelt / Spiering) Solea solea (Sole / Tong) Sprattus sprattus (Sprat / Sprot) Relevant publications or expert group meetings
65 65 73 75 77 79 81 83 85 87 89 91 93
37 40 43 46 49 52 55 58 61 64
4
Sea mammals
95
4.1 4.2 4.3 4.4 4.5
Introduction Phoca vitulina (Harbour Seal / Gewone zeehond) Halichoerus grypus (Grey Seal / Grijze zeehond) Phocoena phocoena (Harbour porpoise / Bruinvis) Relevant publications or expert group meetings
95 96 98 100 102
5
Invertebrates
103
5.1 5.2 5.3 5.4 5.5 5.6 5.7
Introduction Cerastoderma edule (Cockle beds / Kokkelbank) Spisula subtruncata (Spisula bed / Spisulabank) Mytilus edulis (Mussel bed / Mosselbank) Crassostrea gigas (Pacific oyster / Japanse Oester) Arctica islandica (Ocean Quahog / Noordkromp) Relevant publications or expert group meetings
103 104 108 111 115 118 121
6
Nature quality
125
6.1 6.2
Introduction Calculation of nature quality
125 125
7
Discussion and conclusions
131
8
General references
133
Appendix 1 Rationale behind estimates of the Nature Capital Index for birds in Delta area, Wadden Area and North Sea Coastal Zone (in Dutch) by SOVON
8
135
WOt-rapport 82 test
Summary
One of the most important issues in efforts to assist policy makers is the development of biodiversity indicators that accurately reflect the state of the environment. The Netherlands Environmental Assessment Agency (PBL) has developed a system of indicators to assess current biodiversity. Nature quality in terms of biodiversity is expressed as a percentage of the biodiversity that would exist in a natural situation, without human disturbance. Previous studies by IMARES have provided information on relevant biodiversity indicators for the marine environment based on international treaties, research and data availability. This report presents a number of brief ecological profiles, so-called ecoprofiles, for important species of the Dutch marine waters. The species include birds, fish, sea mammals and invertebrates. Each ecoprofile offers information on important state variables such as morphometric data, life history, diet and dispersal. It also provides information on species’ sensitivity to environmental pressures and on the monitoring programme and data set available. Where available, mean numbers for each indicator are presented for the Wadden Sea, North Sea and Delta Area for the 2001-2004 and 1999-2002 periods. Where possible, natural reference values are given. Finally, nature quality is calculated for each area in each period. Results show that nature quality can differ substantially between indicators, periods and regions.
Indicator system for biodiversity in Dutch marine waters
9
Samenvatting
Een van de belangrijkste aspecten om beleidsmakers te ondersteunen, is de ontwikkeling van biodiversiteitsindicatoren die de toestand van de omgeving adequaat weergeven. Het Planbureau voor de Leefomgeving (PBL) heeft een systeem van indicatoren ontwikkeld om de huidige biodiversiteit te bepalen. De natuurkwaliteit voor de biodiversiteit wordt hierbij uitgedrukt als percentage van de biodiversiteit die zou bestaan in een natuurlijke situatie, zonder menselijke verstoring. Eerdere onderzoeken van IMARES hebben informatie opgeleverd over relevante biodiversiteitsindicatoren voor de mariene omgeving, gebaseerd op internationale verdragen, onderzoek en beschikbare gegevens. In dit rapport wordt een aantal korte ecologische profielen (zogenaamde ‘ecoprofielen’) gepresenteerd van voor de Nederlandse mariene wateren belangrijke soorten. Het gaat hierbij om vogels, vissen, zeezoogdieren en invertebraten. Elk ecoprofiel biedt informatie over belangrijke kenmerken van de soort, zoals morfometrische gegevens, informatie over de leefwijze, voedingsgewoonten en verspreidingsmechanismen. Voorts bevat het profiel informatie over de gevoeligheid van de soort voor milieudruk en over bestaande monitoringsprogramma’s en beschikbare gegevensverzamelingen. Voor elke indicatorsoort worden (voor zover beschikbaar) de gemiddelde aantallen gegeven voor de Waddenzee, Noordzee en Deltagebied, over de periode 2001-2004 en 1999-2002. Waar mogelijk worden natuurlijke referentiewaarden gegeven. Ten slotte wordt voor elk gebied en voor elke periode de natuurkwaliteit berekend. Uit de resultaten blijkt dat de natuurkwaliteit sterk kan verschillen tussen de diverse indicatorsoorten, perioden en locaties.
Indicator system for biodiversity in Dutch marine waters
11
1
Introduction
The Netherlands Environmental Assessment Agency (PBL, formerly MNP) assists national and international policy makers by analysing the environmental impact of policies and of trends in society. PBL provides independent integrated assessments on topics such as sustainable development, energy, air quality, transport, land use, climate change and biodiversity. One of the most important issues in the efforts to assist policy makers is the development of biodiversity indicators that adequately express the state of the environment (UNEP 1997; Van Breukelen & Ten Brink 2000; Ten Brink et al. 2000; Ten Brink et al. 2002; Ten Brink & Tekelenburg 2002; Meesters et al. 2008). Such indicators are also needed to implement the goals of the Convention on Biological Diversity (CBD). At a 2002 conference in The Hague, the member states agreed to significantly reduce the rate of loss of biodiversity by 2010 at the global, regional and national levels. Shortly afterwards, the European Union and all other European nations agreed to halt the loss of biodiversity by 2010 ("Fifth Ministerial Conference Environment for Europe", Kiev, 2003). In 2004, a global agreement was reached on a small number of indicators for immediate testing in order to review the progress towards the 2010 target and guide policy makers in finding effective measures. Four global indicators of the state of biodiversity have been selected to evaluate the progress towards the 2010 target, for immediate testing: trends in the size of selected biomes, ecosystems and habitats; trends in the abundance and distribution of selected species; changes in the status of threatened species and trends in the genetic diversity of domesticated animals, cultivated plants and fish species of major socio-economic importance. In May 2004, the 'Message of Malahide' listed a preliminary set of European Biodiversity Headline indicators to evaluate the progress towards the 2010 target at the European level, similar to the above CBD indicators. The European Council urged the European Commission to develop, test and finalise this set by 2006. For reasons of efficiency and consistency, the CBD has recommended the use of similar indicators at the global, regional and national levels. Since 1997, the Dutch government has actively contributed to the consistent development of global and regional indicators in the CBD, OECD and European contexts. The 'Natural Capital Index' (NCI) is an indicator that approximates terrestrial and aquatic biodiversity of natural ecosystems and agricultural land. The NCI regards biodiversity as a stock entity containing all original species and their corresponding abundance values. The NCI is the average abundance of the original species compared to their abundance in the natural or virtually unaffected (preindustrial) state. NCI is calculated as the product of the size of the remaining ecosystem (quantity) and its quality. The quality is calculated from a representative cross-section of the original species, the so-called shopping bag approach. A crucial question is whether the current trends in species biodiversity loss are likely to continue in the future. The lack of a quantitative overview of global species trends makes it difficult to project development trends into the future. This report presents brief ecological descriptions, so-called ecoprofiles, for a subset of species that are relevant to the status of the ecosystem from which the organisms originate. The purpose of the ecoprofiles is to collect in one place information on life history variables that can subsequently be used to build models and to understand changes in the indicator. For many species, the most difficult part is to determine a reference value with which the current value can be compared to obtain a relative quality that can be used to calculate the NCI. An example calculation is given in chapter 6. Not all indicators listed in part I of this study
Indicator system for biodiversity in Dutch marine waters
13
(Meesters et al. 2008) are presented here, mainly due to the limited amount of resources available for the present study, but the set of indicators can be easily extended to include more birds and fish. The level of temporal (and spatial) variation in the data differs between and within species groups. Variations in bird numbers are generally smallest, while fish and invertebrates are more difficult to monitor because of the large temporal and spatial variations in the mortality rates, settlement and survival of many species.
14
WOt-rapport 82 test
2
Birds
2.1
Introduction
In this chapter we give an overview of the birds that, together with SOVON, were chosen to best represent the three marine ecosystems, North Sea, Wadden Sea and Delta Area. This is a minimum set of indicators due to the limited resources available within this study. Other birds can be added to make the whole set larger and increase the robustness of the nature quality. SOVON has indicated that the list can easily be extended to include many more species. For birds a distinction is made between breeding and non-breeding birds. For breeders the yearly number is given over the period 2000-2004. For non-breeders a 3-yearly moving average is given, based on the fact that numbers may vary considerably as a consequence of the winter situation. The recent period is given as a 3-yearly moving average of the counting seasons from 1999-2000 till 2001-2002. The present situation as a 3-yearly moving average of the counting seasons from 2001-2002 till 2003-2004. Units: Especially for non-breeders the collection method may have a strong effect on the way that yearly indices are expressed. In some cases a monthly mean based on the values from July – June of the selected period. For other species the mid winter counts (January) are more appropriate. Table 1. Overview of the selected birds (English and Dutch names) and the area for which they will be used. Abbreviations: NB, non-breeders; B, breeders; MM, monthly mean; BP, number of breeding pairs per year; I, index; MW, mid-winter counts. Species Pied Avocet - Kluut (B) Little Tern - Dwergstern (B) Kentish Plover - Strandplevier (B) Common Tern - Visdief (B) Common Eider breeding - Eidereend (B) Sandwich Tern - Grote stern (B) Eurasian Oystercatcher - Scholekster (B) Great Cormorant - Aalscholver (NB) Sanderling- Drieteenstrandloper (NB) Great Knot – Kanoet (NB) Grey Plover - Zilverplevier (NB) Eurasian Oystercatcher - Scholekster (NB) Bar-tailed Godwit - Rosse Grutto (NB) Dunlin - Bonte strandloper (NB) Dark-bellied Brent Goose - Zwartbuikrotgans (NB) Common Eider, non breeding - Eidereend (NB)
North Sea x x x x
x
Wadden Sea x x x x x x x x x x x x x x x
Delta Area x x x x x x x x x x x x x
Type BP BP BP BP BP BP I MM MM MM MM MM MM MM MM MW
An extensive explanation of the chosen birds, units and reference values is given in Appendix 1.
Indicator system for biodiversity in Dutch marine waters
15
2.2
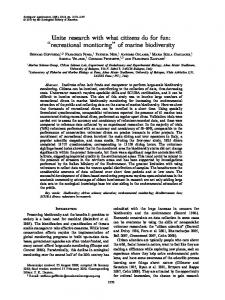
Calidris alba (Sanderling / Drieteenstrandloper) Sanderling
Species common name Scientific name Dutch name
Calidris alba Drieteenstrandloper
Ecological data Guild O herbivore O piscivore O omnivore ● scavenger O detritivore O planktivore ● molluscivore ● other: mainly feeds
on small molluscs, crustaceans and polychaete worms Geografical Distribution ● Coastal ● Wadden Sea ● Delta Zeeland (saline)
Migratory behavior O sedentary ● migratory O variable/dependent on geographical location
Max. Body weight (adults) male: 0.058 kg (average) female: 0.060 kg (average) Max. Length: between 20 and 21 cm (average) Maturity age: between 1 and 2 years/months (average) Reproduction: irrelevant Age: 13 years (maximum) Density/biomass (in optimal habitat): irrelevant Home range: irrelevant Dispersal distance: irrelevant For populations: estimate of minimal viable population size per area:
irrelevant Habitat Position in the water column o pelagic; average depth between…and…m o demersal o planktonic; average depth between…and…m o benthic ● irrelevant Seabed/bottom preferences ● sand O gravel O mud O rock
Fysical/chemical Nutrient conc. o oligotrophic o mesotrophic ● eutrophic
Intertidal O preferred height (relative to MHT) ● other preferences: sandy beaches and
emersed sandbanks, in forages along water line
particular
Light conditions O tolerant for turbidity O intolerant for turbidity ● irrelevant Salinity ● saline O brackish O freshwater
General description non-breeding habitat Foraging habitat: prefers open beaches and edges of sand banks for foraging, avoids sediments with high lutum content; forages in small groups along waterline. Roosts: near foraging areas, in same habitat and also other coastal locations with stony or muddy substrate, usually occurs less often in mixed species high tide roosts than other stilts.
16
WOt-rapport 82 test
Pressures Causes of change in population size and/or distribution (more options possible; specify if possible) O Habitat degradation O Invasive species O Habitat destruction O Disease O Overfishing/overharvesting O Poisoning O Bycatch O Sea surface temp. ● Human disturbance, incr. however seems less shy to O Sea level change humans than other stints O Oil/gass extraction O Natural disturbance O Ship traffic O Other….. O Pollution O Eutrophication O Wind farms
Use of indicator possible) O Food O Medicine O Recreation
(more options O O O
Building material Energy Other:….
Data set information Waterfowl non-breeding Name of data set or monitoring programme
Waterbird census scheme in The Netherlands (part of NEM (Network Ecological Monitoring)) Measurement unit
Number of individuals Brief description of contents data set and/or monitoring programme or hyperlink
The waterbird scheme aims to assess (1) national and regional (site-based) trends, and (2) national wintering or migratory populations during international counts in September (Greylag Goose), November (Anser geese), January (all waterbird species), March (Barnacle Goose) and May (Dark-bellied Brent Goose). These international surveys are co-ordinated by Wetlands International. Monitoring in the Wadden Sea is part of a trilateral cooperation between The Netherlands, Germany and Denmark (Trilateral Monitoring and Assessment Program, TMAP). The waterbird scheme is based on monthly counts of monitoring areas and goose/swan staging sites, that are carried out on high tide). Census effort focuses on September-April, when highest numbers are present in most species. In January many additional sites are counted whereas in national freshwater bodies, Delta Area and Wadden Sea counts are also covered in (part of) the period May-August. Due to its size, the Wadden Sea can not be covered monthly. Here, counts refer to a combination of 4 complete counts and bi-weekly or monthly counts at 10 sample sites, together allowing a reliable trend assessment for the entire season. Brief description/reference/hyperlink of sampling method
Complete counts of all present individuals in a census area Begin date of data set
1975/1976 Are other data sets available (give dates)
See Appendix 1 by SOVON.
Indicator system for biodiversity in Dutch marine waters
17
Numbers and distribution Distribution is concentrated in coastal zone of North Sea, and sand banks in Westerschelde and Oosterschelde. Numbers have increased since early nineties. Mean values Sanderling - Drieteenstrandloper
North Sea
Wadden Sea
Present (01/02-03/04) Recent (99/00-01/02) Reference value
2383 1804 1700
6946 4952 1300
Delta Area 1526 1094 600
Measurement Unit: 3 yearly moving average of monthly mean (Juli-June) of each year. Reference values: No numbers are available of the wintering populations from the first half of the previous century. Reliable numbers are only available from the mid seventies for the Wadden Sea and from the end of the eighties for the Delta Area. Reference values are based on a detailed study by Van Turnhout & Van Roomen (2005).
Distribution data if available (preferably send digital maps otherwise description) See Appendix 1 by SOVON. Updates of its distribution are published in the annual SOVONwaterbird census reports (e.g. Van Roomen et al. 2004). The monthly distribution 1979-1985 has been published in SOVON (1987). Additional historical information on distribution and numbers is summarized in Bijlsma et al. (2001).
Monitoring network information Name of monitoring network
NEM Brief description of network/hyperlink
http://www.siliconmeadow.nl/~nemweb/index.html Other variables measured in network
Trends and distributions of populations of other taxonomic groups Contact for network
http://www.siliconmeadow.nl/~nemweb/index.html Starting date network
1995 Guaranteed continuation of network till what date/year
Formally till 2006/2007 (agreements for a year), however long term continuation is probable Name/map of area covered by network
The Netherlands Reference of last network progress report
Van Strien A. 2005. Landelijke natuurmeetnetten van het NEM in 2004. Kwaliteitsrapportage NEM. Kengetal J-67, Centraal Bureau voor de Statistiek, Voorburg, The Netherlands. Restrictions on availability of data
Availability original census data not (always) free of charge
18
WOt-rapport 82 test
2.3
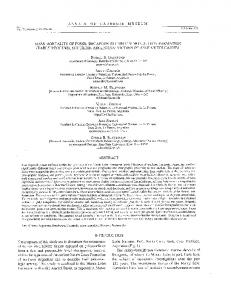
Calidris canutus canutus/islandica (Great Knot / Kanoet)
Species common name Scientific name Dutch name
Great Knot Calidris canutus canutus/islandica Kanoet
Ecological data non-breeding Guild O herbivore O piscivore O omnivore O scavenger O detritivore O planktivore ● molluscivore O other: ….
Geografical Distribution ● Wadden Sea ● Delta Zeeland (saline)
Migratory behavior O sedentary ● migratory O variable/dependent on geographical location
Max. Body weight (adults) male: 0.176 kg (average) female: 0.176 kg (average) Max. Length: between 23 and 25 cm (average) Maturity age: between 2 and 3 years (average) Reproduction: irrelevant Age: 16 years (maximum) Density/biomass (in optimal habitat): irrelevant Home range: irrelevant Dispersal distance: irrelevant For populations: estimate of minimal viable population size per area: irrelevant Habitat Position in the water column o pelagic; average depth between…and…m o demersal o planktonic; average depth between…and…m o benthic ● irrelevant Seabed/bottom preferences O sand O gravel ● mud O rock Intertidal O preferred height (relative to MHT) ● other preferences: foraging habitat: tidal flats.
Fysical/chemical Nutrient conc. o oligotrophic o mesotrophic ● eutrophic
Light conditions O tolerant for turbidity O intolerant for turbidity ● irrelevant Salinity ● saline O brackish O freshwater
General description non-breeding habitat Foraging habitat: tidal areas with sandy or muddy sediment; forages in large compact group over large areas. They can use 800 km2 tidal area during one tidal-cycle. Roosts: Collective high tide roosts are located on bare, undisturbed sand banks
Indicator system for biodiversity in Dutch marine waters
19
Pressures Causes of change in population size and/or distribution (more options possible; specify if possible) ● Habitat degradation, O Invasive species dredging could result in O Disease geomorphological changes O Poisoning of tidal areas and thus the O Sea surface temp. incr. Sea level change could quality of tidal flats ● ● Habitat destruction: root up result in
●
of sediment by mechanical cockle fishery leads to changes in composition of prey species and leads to decrease of numbers Human disturbance, species aggregates in few large flocks, thus is sensitive to recreation and disturbance by air traffic
Use of indicator (more options possible) O Food O Building O Medicine material O Recreation O Energy O Other:….
geomorphological changes of tidal areas and thus the quality of tidal flats O O
Oil/gass extraction Ship traffic
Data set information Waterfowl non-breeding Name of data set or monitoring programme
Waterbird census scheme in The Netherlands (part of NEM (Network Ecological Monitoring)) Measurement unit
Number of individuals Brief description of contents data set and/or monitoring programme or hyperlink
The waterbird scheme aims to assess (1) national and regional (site-based) trends, and (2) national wintering or migratory populations during international counts in September (Greylag Goose), November (Anser geese), January (all waterbird species), March (Barnacle Goose) and May (Dark-bellied Brent Goose). These international surveys are co-ordinated by Wetlands International. Monitoring in the Wadden Sea is part of a trilateral cooperation between The Netherlands, Germany and Denmark (Trilateral Monitoring and Assessment Program, TMAP). The waterbird scheme is based on monthly counts of monitoring areas and goose/swan staging sites, that are carried out on high tide). Census effort focuses on September-April, when highest numbers are present in most species. In January many additional sites are counted whereas in national freshwater bodies, Delta Area and Wadden Sea counts are also covered in (part of) the period May-August. Due to its size, the Wadden Sea can not be covered monthly. Here, counts refer to a combination of 4 complete counts and bi-weekly or monthly counts at 10 sample sites, together allowing a reliable trend assessment for the entire season. Brief description/reference/hyperlink of sampling method
Complete counts of all present individuals in a census area Begin date of data set
1975/1976 Are other data sets available (give dates)
See appendices SOVON Frequency of monitoring and next monitoring date
Census effort monthly at least September-April, many additional sites once a year in January
20
WOt-rapport 82 test
Numbers and distribution Distribution is limited to extensive tidal areas in Wadden Sea, Oosterschelde and Westerschelde. Numbers in the Wadden Sea increased between 1975 and 1993, but have decreased since 1993. However numbers in the Delta Area have increased since 1988. Mean values Great Knot - Kanoet Present (01/02-03/04) Recent (99/00-01/02) Reference value
North Sea -
Wadden Sea 36555 48568 40000
Delta Area 8884 8842 6000
Measurement Unit: 3 yearly moving average of monthly mean (July-June) of each year. Reference values: No numbers are available of the wintering populations from the first half of the previous century. Trustworthy numbers are only available from the mid seventies for the Wadden Sea and from the end of the eighties for the Delta Area. For the Wadden Sea 19751990 has been chosen as a reference period because of the large availability of wild mussel beds for the birds in that period. The disappearance of these mussel banks in later years was followed by large changes in the numbers of birds (Van Roomen et al. 2005). For the Delta Area such impacts are absent and the average of the first 10 years of 1987-2004 has been chosen.
Distribution data if available (preferably send digital maps otherwise description) See Appendix 1. Updates of its distribution are published in the annual SOVON- waterbird census reports (e.g. Van Roomen et al. 2004). The monthly distribution 1979-1985 has been published in SOVON (1987). Additional historical information on distribution and numbers is summarized in Bijlsma et al. (2001).
Monitoring network information Name of monitoring network
NEM Brief description of network/hyperlink
http://www.siliconmeadow.nl/~nemweb/index.html Other variables measured in network
Trends and distributions of populations of other taxonomic groups Contact for network
http://www.siliconmeadow.nl/~nemweb/index.html Starting date network
1995 Guaranteed continuation of network till what date/year
Formally till 2006/2007 (agreements for a year), however long term continuation is probable Name/map of area covered by network
The Netherlands Reference of last network progress report
Van Strien A. 2005. Landelijke natuurmeetnetten van het NEM in 2004. Kwaliteitsrapportage NEM. Kengetal J-67, Centraal Bureau voor de Statistiek, Voorburg, The Netherlands. Restrictions on availability of data
Availability original census data not (always) free of charge
Indicator system for biodiversity in Dutch marine waters
21
2.4
Recurvirostra avosetta (Pied Avocet / Kluut) Pied Avocet
Species common name Scientific name Dutch name
Recurvirostra avosetta Kluut
Ecological data Guild O herbivore O piscivore O omnivore O scavenger O detritivore O planktivore O molluscivore ● other: feeds on
waterinsects, crustaceans and polychaete worms
Max. Body weight (adults) male: 0.327 kg (average) female: 0.308 kg (average) Max. Length: between 42 and 45 cm (average) Maturity age: between 2 and 3 years (average) Reproduction: between :0.1and 1.4 young per female (fledge) (several areas in The Netherlands; Arts & Meininger 1997) Age: 24 years (maximum) Density/biomass (in optimal habitat): Between 8.3 and 42 breeding pairs/100 ha (large areas), 2-25 nests/ 100 m2 (colony) (Arts & Meininger 1997) Home range: between 2 and 5 ha (average) Dispersal distance: irrelevant For populations: estimate of minimal viable population size per area: Minimum viable Metapopulation: 120 pairs (with key-population of at least40 pairs) and 200 pairs (without key-population) (Verboom et al. 2001)
Geografical Distribution ● Wadden Sea ● Delta Zeeland (saline,
Habitat Position in the water column ● prefers shallow water 15 cm .
General description breeding habitat The breeding biotope consists of open landscape with sparsely grown or almost barren soils (pioneer situation) close to open water. The nest is mostly made on bare ground or on spots with little vegetation. The nearness of vegetation, shoulders, edges, etc. are important as shelter for the young. Breeding season: April – end of July
Pressures
22
WOt-rapport 82 test
Causes of change in population size and/or distribution (more options possible; specify if possible) ● Habitat degradation O Invasive species O Disease ecological succession of O Poisoning nesting habitat, at present O Sea surface temp. lack of coastal dynamic incr. situations; species is O Sea level change increasingly dependent on O Oil/gass extraction man-made nesting sites O Ship traffic O Habitat destruction O Other….. O Overfishing/overharvesting O Bycatch O Human disturbance ● Natural disturbance,
Use of indicator possible) O Food O Medicine O Recreation
(more options O Building material O Energy O Other:….
predation by Red fox O O O
Pollution Eutrophication Wind farms
Data set information Name of data set or monitoring programme
National census of rare and colonial breeding birds Measurement unit
Number of breeding pairs Brief description of contents data set and/or monitoring programme or hyperlink
Yearly nationwide censuses of all breeding colonies; http://www.sovon.nl Brief description/reference/hyperlink of sampling method
Census of breeding colonies: number of pairs, nests: http://www.sovon.nl/pdf/HandleidingLSB.pdf Begin date of data set
1992 (start of current monitoring program, older data available) Are other data sets available (give dates)
1950-1992, data series may be incomplete Frequency of monitoring and next monitoring date
Once a year, 2006 Range/variation of available data in space and time Estimate of percentage inaccuracy of measurements
Numbers and distribution Present distribution in the Netherlands: Central distibution areas are within the Wadden Sea (mostly outside of the dikes of northern Friesland, the north coast of Groningen, and the Dollard), the top of the province of North-Holland (Balgzand) and the Delta Area (biggest colonies at lake Volkerak and Haringvliet). In other areas the species is spread over smaller settlements in the area of Lake IJsel, the inland area of North and South Holland and along the larger rivers. The natural distribution is restricted to the coastal areas (Wadden Sea, western coast, and Delta Area). In other areas the distribution is almost completely related to human created pioneer situations. Outside of the breeding time the distribution is mainly restricted to the saline waters of Wadden and Delta Area. Trends in the Netherlands: the breeding population has increased strongly within the 20th century: 1940-65 3500, 1975-77 4600, 1982-83 8000, 1992 9000-9200 breeding pairs. After 1992 the population has decreased to about 7100-7600 pairs in the mid nineties; the decrease was mainly due to birds from the coast of Friesland and Groningen. In the Delta Area Indicator system for biodiversity in Dutch marine waters
23
numbers were more stable. From 1990-2002 the trend is decreasing (< 25%, but significant). Recent numbers vary from 9000 pairs (1999-2000) to 7900 (2002). The season high, which is reached in the late summer, is approximately 10.000 individuals. The number of overwintering birds (mainly Delta area) is mostly not more than 1000 animals. The number of staging birds have been slightly declining significantly since 1987/88. From 1993 to 1997 the breeding population included on average 7200 pairs, of which 83% within areas that had been assigned through the European Habitats and Birds directive. The largest part of the staging birds (estimate >90%) are also concentrated in these areas. Mean values Pied Avocet /Kluut n. breeding pairs Wadden Sea n. breeding pairs Delta area n. breeding pairs North Sea coast
2000 4367 2088 0
2001 3197 1874 0
2002 3854 1833 0
2003 2977 2145 0
2004 2438 1775 0
Reference value 5300 960
Measurement Unit: the number of breeding pairs of each year. Reference values: Breeding numbers from the beginning of the previous century are low (Arts & Meininger (1997) as a consequence of the higher protection of the species nowadays. Therefore, these estimates are not usable as a reference value for today. The reference values used here are based on breeding numbers of the start of the nineteen nineties.
Distribution data if available (preferably send digital maps otherwise description) See Appendix 1. Updates on distribution and numbers are published in the annual SOVON breeding bird reports (e.g. Van Dijk et al. 2004). Besides complete distribution maps have been published in the national Breeding bird atlases, covering the periods 1998-2000 (SOVON Vogelonderzoek Nederland 2002) and 1973-1977 (Texeira 1979). Additional historical information on distribution and numbers is summarized in Bijlsma et al. (2001).
Monitoring network information Name of monitoring network
NEM (Network Ecological Monitoring) Brief description of network/hyperlink
http://www.siliconmeadow.nl/~nemweb/index.html Other variables measured in network
Trends and distributions of populations of other taxonomic groups Contact for network
http://www.siliconmeadow.nl/~nemweb/index.html Starting date network
1995 Guaranteed continuation of network till what date/year
Formally till 2006/2007 (agreements for a year), however long term continuation is probable Name/map of area covered by network
The Netherlands Reference of last network progress report
Van Strien A. 2005. Landelijke natuurmeetnetten van het NEM in 2004. Kwaliteitsrapportage NEM. Kengetal J-67, Centraal Bureau voor de Statistiek, Voorburg, The Netherlands. Restrictions on availability of data
Availability original census data not (always) free of charge
24
WOt-rapport 82 test
2.5
Sterna albifrons albifrons (Little Tern / Dwergstern) Little Tern
Species common name Scientific name Dutch name
Sterna albifrons albifrons Dwergstern
Ecological data Breeding Guild O Herbivore ● piscivore O omnivore O scavenger O detritivore O planktivore O molluscivore ● other: also forages on
crustaceans
Max. Body weight (adults) male: 0.051 kg (average) female: 0.045 kg (average) Max. Length: between 22 and 28 cm (average) Maturity age: between 2 and 3 years/months (average) Reproduction: between 1,4 and 1,6 young per female (fledge) (England, fledging success fluctuates strongly) Age: 21 years (maximum) Density/biomass (in optimal habitat): Breeds in small to medium sized colonies (