382
Genome Informatics 13: 382–383 (2002)
Inference of Genetic Network Using the Expression Profile Time Course Data of Mouse P19 Cells Yukihiro Maki1
Takanori Ueda1
[email protected]
[email protected]
Naoya
Uematsu2
[email protected]
1
2
3
Kentaro
Inamura2
[email protected]
Masahiro Okamoto1
[email protected]
Kazuhiko Uchida2
[email protected]
Yoriko Takahashi3
Yukihiro Eguchi3
[email protected]
[email protected]
Laboratory for Applied Biological Regulation Technology, Graduate School of Bioresource and Bioenvironmental Sciences, Kyusyu University, 6-10-1 Hakozaki, Higashiku, Fukuoka 812-8581, Japan Institute of Basic Medical Sciences, University of Tsukuba, 1-1-1 Tennodai, Tsukuba, Ibaraki 305-8575, Japan Bioscience Division, Mitsui Knowledge Industry Co., Ltd, Harmony tower 21th Floor, 1-32-2 Honcho, Nakano-ku, Tokyo 164-8721, Japan
Keywords: genetic network, S-system, microarray
1
Introduction
Powerful new technologies, such as DNA microarrays, provide simple and economical ways to explore gene expression patterns on a genomic scale. Using observed gene expression data, recent advances of technology in bioinformatics have made gene expression comprehensive and several approaches have been proposed to infer the genetic networks. We previously introduced some top-down approaches for the inference of interrelated mechanism among genes in genetic network that is based on the steady state and temporal analyses of gene expression patterns against some kinds of gene perturbations such as disruption or over expression [1, 2]. One of them is by a dynamic network model such as S-system [3] that can infer the interrelated mechanism in genetic network including even loop structure (interdependent structure) among genes. We have already introduced the revised strategy into which a static Boolean network model based on multi-level digraph approach and a dynamic model based on S-system are integrated, and demonstrated that this strategy is useful and powerful to infer a large-scale genetic network. In this study, we obtained gene expression profiles during neural differentiation of P19 EC cells using mouse cDNA microarray containing of 15,000 genes, and we applied S-system model for inference of genetic network from extracted experimental time-series data. We shall demonstrate that this strategy is useful and powerful to infer the genetic network during neural differentiation.
2 2.1
Materials and Methods Profile Data
P19 EC cells differentiate into neurons that have the capability of forming synapsis and neuronal polarity by stimulation with retinoic acid (RA). Gene expression profiles during neural differentiation of P19 cells were obtained by using mouse cDNA microarray containing of 15,000 genes (NIA mouse 15K clone set [4]). We obtained the 7 expression profiles(0, 1, 2, 3, 4, 5, 6 day) both RA treatment and Mock one. The number of first-screened target genes for analysis is 40; 20 genes are down-regulated by
Inference of Genetic Network Using the Expression Profile Time Course Data
383
Mock treatment, up-regulated by RA treatment, other 20 genes are up-regulated by Mock treatment, down-regulated by RA treatment. Finally we selected 11 named genes among them.
2.2
Strategy for Inference of Genetic Network with S-system Model
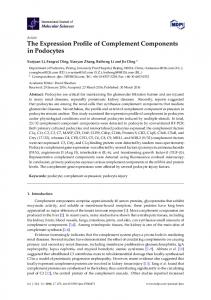
S-system cannot analyze large scale genetic network because the number of estimated parameters increases with O(n2 ). In order to mortify this problem, we introduce the revised strategy, which is Step-by-step strategy for the inference of a large-scale genetic network. This strategy is summarized as follows; 1) Focused on one temporal profile of gene expression (i), and it is supposed that other temporal profiles are treated as known and fixed data. 2) Estimate the parameter values in row i, in matrix shown in Fig. 1, which realizes the temporal profile of gene expression (i). 3) Repeat above procedures (n-1) times.
1
2
3 i
…
n
α
β
g
ij
i
α
i
i
g
ij
β
i
h
ij
h
ij
Figure 1: Step-by-step strategy. (1)Focused on one temporal profile of gene expression (i). (2)Supposing that other temporal profiles are known and fixed data, estimate the parameter values in row i, which realizes the temporal profile of gene expression (i). (3)Repeat above procedures (n-1) times.
3
Discussion
To infer the interactions among genes in a large-scale network, an efficient Step-by-step estimation strategy of S-system was proposed. Using gene expression profiles during neural differentiation of P19 EC cells using mouse cDNA microarray containing of 15,000 genes, and we applied S-system model for inference of genetic network from extracted experimental time-courses data. We could obtain the candidates of genetic network for neural differentiation of P19 EC cells, followed by the verification of these candidates with detailed consideration of related references.
References [1] Arikawa, Y., Watanabe, S., Maki, Y., Tominaga, D., and Okamoto, M., AIGNET: Improvement of a system and application to the experimentally observed expression data, Genome Informatics, 11:291–292, 2000. [2] Maki, Y., Tominaga, D., Okamoto, M., Watanabe, S., and Eguchi, Y., Development of a system for the inference of large scale genetic networks, Proc. Pacific Symposium on Biocomputing, 446– 458, 2001. [3] Savageau, M.A., Biochemical Systems Analysis: A Study of Function and Design in Molecular Biology, Addison-Wesley, Reading, Massachusetts, 1976. [4] http://www.lgsun.grc.nia.nih.gov/