{svs,drozda}@sim.uni-hannover.de. AbstractâWe investigate the influence of the network traffic payload, using 50 concurrent connections, with a Poisson dis-.
Influence of Network Payload and Traffic Models on the Detection Performance of AIS Sven Schaust and Martin Drozda Institute of Systems Engineering G. W. Leibniz University of Hannover Welfengarten 1, 30167 Hannover, Germany {svs,drozda}@sim.uni-hannover.de
Abstract— We investigate the influence of the network traffic payload, using 50 concurrent connections, with a Poisson distributed packet injection model, on the detection performance of our Artificial Immune System (AIS). We compare the detection performance to priorly gained results which were based on a smaller scenario. We conclude that the Poisson traffic model had again no negative impact on the detection performance. We also conclude that a higher network payload has no negative impact on the detection performance. Additionally a statistically significant difference in the detection performance between CBR and Poisson could be observed for a high network payload. Index Terms—Artificial Immune Systems, Detection Performance, Wireless Sensor Networks
I. I NTRODUCTION The objective of wireless sensor networks (WSN) is to transfer sensor readings to one or more base stations (depending on the current task and application scenario), in order to be stored and processed. WSN typically consist of energy constrained devices which normally have limited computational capabilities and memory constraints. It is crucial that the application is aware of these limitations since each node has to fulfill several tasks during its operation. The additional usage of strong software-based cryptography is therefore not feasible. New generations of sensor node hardware however are equipped with IEEE 802.15.4 communication radios which support hardware based AES-128 cryptography. This link based encryption offers protection from alien nodes trying to gain access to a deployed network. The usage of link based cryptography alone without any additional security mechanisms however is not enough to prevent attacks on sensor networks. Unfortunately current sensors are not tamper proof (though in many cases they are weather resistant). An attacker is therefore still able to compromise a sensor node, being able to capture the current encryption keys. With knowledge of the encryption keys an intruder may participate in the network and start attacks to the network without ever being detected. Misbehavior in wireless ad hoc and sensor networks can take upon different forms: packet dropping, modification of data structures important for routing, modification of packets, skewing of the network’s topology or creating fictitious nodes; see [5] for a more complete list. The reason for nodes (possibly fully controlled by an attacker) to execute any form of misbehavior can range from the desire to save
battery power to making a given wireless sensor network non-functional. Malfunction can also be considered a type of unwanted behavior. Two kinds of misbehaving nodes participating in an ad hoc network are distinguishable from each other, namely selfish and malicious nodes. The latter nodes attack the network in some way in order to disturb its normal operation; such ways of attacking may include network flooding, manipulation of forwarded packets or simply the denial of packet forwarding. Selfish nodes are different in that they always act just for their convenience while not interested in harming the network. While selfish nodes may decide not to forward packets just like malicious nodes do, they just do so in order to save energy for their own communications (as opposed to malicious nodes). Of course, the effect of denial of packet forwarding is the same in both cases, namely, the QoS parameters of the ad hoc network are likely to deteriorate. However, selfish nodes will experience this effect having an impact on their own performance; consequently, they will try to avoid it since they act for their very own convenience. In other words, while there is not any chance to turn malicious nodes into non-malicious nodes, selfish nodes are willing to act "fairly" in terms of the network if this is in their own interest. In our previous paper [3] we investigated the impact of Poisson and constant bit rate (CBR) traffic models using a small scenario with 10 randomly chosen connections. We believe that the Poisson distribution is a suitable distribution to model the occurrence of sensor events as many tasks for WSN assume monitoring functions, hence to observe such events as the arrival of animals on a clearance or the number of raindrops on a vineyard. Additionally AIS should be capable of fulfilling its classification task independent from the current traffic model. The impact of different traffic models on the detection performance should therefore be considered and examined. In our previous paper we concluded that the detection performance, in terms of detection rate, was not significantly different between Poisson and CBR. We, however, noticed significant differences in the rate of false positives. Therefore, our goal was to investigate whether the scenario was possibly too small and whether this effect extends to a bigger scenario. We repeated the experiments using 50 randomly chosen connections. We discuss the results of these
experiments in the following sections. This document is organized as follows. First, we give a short introduction to artificial immune systems. Second, we describe our experimental setup. Third, the results are presented and, finally, we summarize our conclusions and point out possible directions of future research. II. A RTIFICIAL I MMUNE S YSTEMS An Artificial Immune System (AIS) is a bio-inspired classification system which is derived from the Human Immune System (HIS). As several methods, terms and descriptions have been adopted from it, we first want to define the most relevant ones: A gene is defined by a characteristic based on data or control traffic forwarded by a node or in the node’s neighborhood. For example, the number of attempts to acquire the wireless medium through contention resolution or the number of data packets forwarded can be considered a gene. An antigen is an observation within a time window for a set of genes which can either be interpreted as self-antigen or non-self-antigen. While the first interpretation describes observations which belong to the normal operation (hence belonging to the ”self set”) of the network, the latter one describes unknown or malicious behavior of the network. A detector is produced by a learning algorithm and only matches against non-self antigens. A commonly used method to match antigens with detectors, when the bit-string representation is assumed, is the r-contiguous bits matching rule. Definition: Given two bit-strings a and b with |a| = l, r ≤ |b| ≤ l, a r-contiguous bits matching is true if a position i exists after which the substrings ai , . . . , ar and bi , . . . , br are identical. AIS are one of the most recent approaches in computational intelligence. They provide efficient and robust information processing capabilities. They can learn, adapt previously learned information and perform pattern recognition in a distributed way. An important design issue of AIS is the implementation and translation of the HIS functionality. In the context of wireless networks, the very basic question is whether the HIS should be mapped to a single wireless device or to the whole network. This means that either each wireless device has to mimic the specific mechanisms of the HIS or these tasks get distributed over the whole network. Phases of a simple Artificial Immune System can be divided into: a learning phase and a detection phase. During the learning phase detectors are produced (by a negative selection process). These detectors will be used later in the detection phase to discover misbehavior indicators. The goal of negative selection is in the case of AIS to produce only detectors that are able to identify behavior that is unusual or directly damaging to the network. For this purpose it is necessary to observe the network for some period of time and decide what constitutes the “normal” (usual) behavior. This normal behavior then gets represented as bit-strings; usually there is
one bit-string computed per window, where a window is a shorter period of time in which it is expected that some or many features of the underlying network become observable. A set of bit-strings that encode normal behavior is called the set of self strings. Then, a random bit-string gets generated and is compared against the set of self strings. If the randomly generated bit-string matches anything in the set of self strings, it is deleted. Otherwise, the random bit-string becomes a detector. Testing a network on unusual behavior is similar. In each window, a bit-string, that encodes observable behavior of the network, gets created. This bit-string is matched against the set of detectors. If a match exists, then a node (or a group of nodes) has been tested positive on previously unseen behavior. It is up to the designer of the AIS to decide, whether after a match an action should be taken, or whether some statistical analysis on positive tests will be undertaken. There are several enhancements which allow adaptive learning, thus avoiding the necessity of an intensive learning phase. See [9], [1], [2], [3] for more information on the different mechanisms of AIS and their applicability to intrusion and misbehavior detection. III. E XPERIMENTAL S ETUP We used the same bit string representation as in [1], [2], [3] for self, non-self and detectors and also used the rcontiguous bits matching rule. Detectors were produced by using the negative-selection approach. We used two scenarios with 50 randomly chosen connections. The first scenario used the CBR, the second scenario the Poisson injection model. In each scenario we ensured that the average hop count distance between two nodes was about 7 hops. This number of intermediate nodes was chosen as a tradeoff between a fast simulation and a reasonable number of participating nodes in the routing process. A. Scenario description For both scenarios the observed network traffic was evaluated according to the described AIS approach. We captured for every transmitted packet the IP header type (UDP or DSR), the MAC frame type (RTS, CTS, DATA or ACK), the current simulation time, the node address, the next hop address, the global packet source, the global packet destination and the packet size. The measured values were used to compute the necessary gene values and their representations as described below in section III-D Similar to our previous experiments, each scenario was simulated using Glomosim 2.03 [15] with 20 different seeds for the Glomosim random number generator. We distributed the simulation runs over 30 Linux based PCs. We used the same parameters and settings for our simulations as described in [1], [2], [3], except for the number of connections being increased from 10 to 50: • Negative selection algorithm: random generation and testing. Implemented in C++, compiled with GNU g++ v4.0 with -O3 option. • Input parameters:
3000
3000
3000
Sink Source
Routes Sink Source
2500
2500
2500
2000
2000
2000
1500
1500
1500
1000
1000
1000
500
500
500
0
0 0
500
1000
1500
(a)
2000
2500
3000
0
500
1000
1500
2000
2500
3000
0 0
500
1000
(b)
1500
2000
2500
3000
(c)
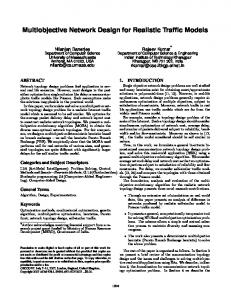
Fig. 1. (a) Topology of our 1,718-node network with 100m radio radius. (b) Measured forwarding path of the 10 connections, (c) Measured forwarding path of the 50 connections for a single simulation run without misbehavior; connections shown with all alternative forwarding routes, if they exist.
r-contiguous bits matching rule with r = 10. Encoding: 5 genes each 10 bits long = 50 bits. Number of detectors {500, 1000, 2000}. Exposed misbehavior levels {10%, 30%, 50%} Observation-Window size 500 seconds; 28 complete windows over 4-hours simulation time. CBR Injection rate: 1 packet/second. 14400 packets per connection were injected. Packet size was 512 bytes. Poisson Injection rate: λ = 1.0, meanArrivalExpectation = 1 packet/second. Packet size was 512 bytes. Performance measures: detection rate, false positives, data traffic rate at nodes; values were produced per simulation run and compared as arithmetic average. We computed the 95% confidence interval over all simulations for each misbehavior probability and false positives rate. MAC protocol: IEEE 802.11b DCF. Routing protocol: Dynamic Source Routing (DSR). Other parameters: (i) Propagation path-loss model: two ray (ii) Channel frequency: 2.4 GHz (iii) Topography: Line-of-sight (iv) Radio type: Accnoise (v) Network protocol: IPv4 (vi) Connection type: UDP. 1) 2) 3) 4) 5)
•
•
•
D. Artificial Immune System - Details In our experiments we use five different genes. They cover the two most important OSI-layers for data transmission in sensor networks, namely the link layer and the network layer. They cover a good range of traffic properties which allow the AIS to detect misbehavior. As sensor network applications in general have to deal with many hardware limitations and therefore only the most necessary OSI layers are implemented to ensure communication. Layers beyond the networking layer are therefore supposed to be rarely used.
C. Node Misbehavior
MAC Layer Genes: #1 Ratio of complete MAC layer handshakes between two communicating nodes si and si+1 and the RTS packets sent by si to si+1 . If there is no traffic between two nodes this ratio is set to ∞ (a large number). This ratio is averaged over a time period. A complete handshake is defined as a completed sequence of RTS, CTS, DATA, ACK packets between si and si+1 . #2 Ratio of data packets sent from si to si+1 and then subsequently forwarded to si+2 . If there is no traffic between two nodes this ratio is set to ∞ (a large number). This ratio is computed by si in promiscuous mode. This ratio is also averaged over a time period. This gene was adapted from the watchdog idea in [12]. #3 Time delay that a data packet spends at si+1 before being forwarded to si+2 . The time delay is observed by si in promiscuous mode. If there is no traffic between two nodes the time delay is set to zero. This measure is averaged over a time period. This gene is a quantitative extension of the previous gene.
As misbehavior we used a simple probabilistic packet dropping attack, as described in [1] with a 10, 30 and 50% dropping probability. We excluded sink and source nodes from misbehavior. 236 of our 1718 nodes were chosen (randomly, but equally distributed in scenario area) to be malicious.
Routing Layer Genes: #4 The same ratio as in #2 but computed separately for RERR routing packets. #5 The same delay as in #3 but computed separately for RERR routing packets.
• • •
B. Network Topology The network topology was the same as in [1], consisting of 1718 nodes placed in a 3000 m × 3000 m square plane. Each node was set to have a radio radius of 100m. We made no restrictions to the graph connectivity, thus allowing isolated subgraphs.
Each gene was encoded using an interval representation of size 10 which was adopted from [7]. The corresponding interval was marked by a single 1 within the 10 bit sequence (from the ten bits only one was set). Antigens were produced by the concatenation of all genes and checked against the detector set; the comparison was interrupted when the antigen matched a detector. IV. E XPERIMENT R ESULTS To detect misbehavior we need to compare all computed detectors with every observed non-self antigen. In our experiments a 500 second time window was used to sample node traffic and to generate one antigen. The resulting number of time windows for 4 hours of simulated time is therefore 28 windows per node. In order to avoid outliers in our analysis we defined a detection threshold: at least 14 antigens (produced in 14 different time windows) had to match a detector to mark a node as misbehaving. A packet threshold for each node was set as the detection requires that at least a certain number of packets has been forwarded by a node during normal and misbehavior operation. If a node lacks packets to forward in the learning phase, the AIS’s ability to learn is limited. Similarly, if a node lacks packets to forward during the detection phase and at the same time wants to execute misbehavior, the impact of misbehavior is weakened. As a consequence of these limitations we performed our evaluation using four different packet threshold values (500, 1000, 2000 and 4000) and considered only those nodes which were above the given thresholds. We used the arithmetic average over all simulation runs to calculate the detection and false positives rate. For each misbehavior level we computed for the detection and false positives rate the appropriate 95% confidence interval (ci95% ). Definition: The detection rate is defined as dr = nnmd , where nm = the number of misbehaving nodes to detect, and nd = the number of correctly detected nodes. The number of misbehaving nodes nm consists of all misbehavior nodes that were above the packet threshold limit during a simulation run. The number of correctly detected nodes consists of all misbehaving nodes that where correctly marked as misbehaving during a simulation run. Definition: The false positives rate is defined as f pr = where nf p = the number of incorrectly detected nodes, and nd = the number of correctly detected nodes. The number of incorrectly detected nodes consists of all normal operating nodes (no implemented misbehavior) which show a different behavior in contrast to its behavior during the learning phase. nf p nd +nf p ,
As observed in the experiments with 10 connections, we expected the detection rate to be similar for both models. The graphs in figure 2 show the average misbehavior detection results for 10 and 50 connections using 500 detectors. For each misbehavior we computed the 95% confidence interval
to ensure statistically significant conclusions. The graphs from the 10 connection scenario (a) and (b) show that both traffic models are within the confidence intervals of each other. The appropriate values over all packet thresholds are for fig. 2 (a) ci95%,mis10% = [6%; 11%], ci95%,mis30% = [13.8%; 23%], ci95%,mis50% = [14%; 24.5%], for fig. 2 (b) ci95%,mis10% = [8%; 21%], ci95%,mis30% = [13%; 18%], ci95%,mis50% = [11%; 15%]. For each traffic model the misbehavior confidence intervals overlap and hence no statistically significant differences can be shown. This is in contrast to the 50 connection scenario with 500 detectors (fig. 2 (c) and (d)). Note that the detection results for each packet dropping probability in both traffic scenarios were more stable with much smaller confidence intervals. There the values and confidence intervals do not overlap and we can show statistical significant differences between the two traffic models. This indicates that the traffic models have a significant impact on the detection rate. However, this only holds for high network payload and thresholds below 4000 packets; with higher thresholds the number of detectable nodes decreases and the AIS detects the remaining nodes with high accuracy. Hence the significant differences dissappear. Surprisingly the 10% misbehavior detection rates do not follow this principle. Here a significant difference can be observed for all packet thresholds. This behavior is a result of the reduced impact that the CBR traffic model causes on the antigen appearance in contrast to the Poisson traffic model, when having a small misbehavior rate. These results were all based on a detector set of 500 detectors. We also computed the detection performance for a set of 2000 detectors. Our goal was to examine whether the detector number has a significant impact on the performance. In fig. 3 (a) and (b) the results using 10 connections are shown. No significant differences between the two experiments can be observed, except for the packet threshold of 4000. This, however, is the result of our detection performance computation. If no misbehaving node in a simulation run is above the threshold the run is excluded from the computation and hence the impact of the remaining detection results is increased. For figures (a) and (c) the confidence intervals overlap for each misbehavior too. Note that this overlapping is caused by larger confidence intervals in the 10 connections example. Looking at the Poisson model experiments we can observe that an increase of detectors had also no significant positive impact on the detection performance. We therefore conclude that a higher detector number does not necessarily result in a better detection performance. The graphs in figure 3 (c) and (d) show the same tendencies as in figure 2 (c) and (d). Again the 10% misbehavior graph shows a significant difference between CBR and Poisson traffic, while the other misbehavior graphs show similar tendencies. We note that increasing the number of detectors in a scenario with packet dropping as misbehavior has a low impact on the detection performance of our AIS. This is
Detection rate for 500 detectors
100
100
80
80
Detection rate [%]
Detection rate [%]
Detection rate for 500 detectors
60 40 10% 20 30% 50% 0 500
1000 2000 Packet threshold
60 40 10% 20 30% 50% 0 500
4000
(a)
Detection rate for 500 detectors
Detection rate for 500 detectors 100
10% 80 30% 50%
Detection rate [%]
Detection rate [%]
4000
(b)
100
60 40 20 0 500
1000 2000 Packet threshold
1000 2000 Packet threshold
4000
(c)
80 60 40 10% 20 30% 50% 0 500
1000 2000 Packet threshold
4000
(d)
Fig. 2. Detection rate (10 connections) for CBR (a) and Poisson (b); Detection rate (50 connections) for CBR (c) and Poisson (d) The number of detectors was 500.
independent from the current network payload. As artificial immune systems should be used within memory constrained systems, having similar results with only a fraction of the number of detectors is a valuable observation. Figures 4 (a) - (d) showing the false positives rates for both connection scenarios indicate that with an increasing network payload the number of false positives is getting smaller. In order to verify whether the reduced rate was due to a lower number of detected false positives or due to a higher number of detectable misbehaving nodes, the mean number of detectable nodes for 10 and 50 connections, as well as the number of false positives were computed. We conclude that the false positives rate seems decreased for particular misbehavior scenarios, which is caused by an increase of detectable nodes. Thus a higher network payload with more nodes involved in network traffic has a positive impact on our performance measures, see fig. 4 (a) and (c), but does not significantly reduce the real number of false positives. Nonetheless some oddities could be observed in figure 4. First the confidence intervals for the false positives show
great differences. Values over all packet thresholds for figure 4 a) are ci95%,mis10% = [8%; 14%], ci95%,mis30% = [12.4%; 21%], ci95%,mis50% = [9%; 19%], for figure 4 b) ci95%,mis10% = [5%; 8%], ci95%,mis30% = [2.4%; 4%], ci95%,mis50% = [4.5%; 6.3%]. The huge gap between the false positives rates of the Poisson and CBR model is basically a result of the CBR antigen appearance. The Poisson model offers a higher variance of self-antigens and hence a better discrimination between self and non-self. Another oddity is shown in 4 (c). While the number of false positives for the 30% and 50% misbehavior are drastically reduced, the number for the 10% misbehavior is almost identical. At the same time the detection rate for the 10 connection scenario is higher than in the 50 connection scenario. We will study our AIS logfiles in order to find the reason for this unexpected effect. We however assume that again the antigen similarity of the CBR traffic could be responsible for this effect. V. AIS IN A D -H OC N ETWORKS - R ELATED W ORK In [7] and [8] Sarafijanovi´c and Le Boudec introduced an AIS based misbehavior detection system for ad hoc wireless networks. They used Glomosim for implementing basic
Detection rate for 2000 detectors
100
100
80
80
Detection rate [%]
Detection rate [%]
Detection rate for 2000 detectors
60 40 10% 20 30% 50% 0 500
1000 2000 Packet threshold
4000
60 40 10% 20 30% 50% 0 500
(a)
Detection rate for 2000 detectors
Detection rate for 2000 detectors 100
10% 80 30% 50%
Detection rate [%]
Detection rate [%]
4000
(b)
100
60 40 20 0 500
1000 2000 Packet threshold
1000 2000 Packet threshold
4000
(c)
80 60 40 10% 20 30% 50% 0 500
1000 2000 Packet threshold
4000
(d)
Fig. 3. Detection rate (10 connections) for CBR (a) and Poisson (b); Detection rate (50 connections) for CBR (c) and Poisson (d). The number of detectors was 2000.
features of AIS. In their experiments, bit-string representation was applied, negative selection was used as a basis for producing detectors. Additionally, a co-stimulation in the form of a danger signal was used in order to inform nodes on a forwarding path about misbehavior, thus propagating information about misbehaving nodes around the network. Their setup was an area of 800 × 600m with 40 mobile nodes (speed 1 m/s) of which 5-20 are misbehaving; the routing protocol was DSR. Four genes were used to capture local behavior at the network layer. Additionally, a co-stimulation in the form of a danger signal [9] was used in order to inform nodes on a forwarding path about misbehavior, thus propagating information about misbehaving nodes around the network. Their observed detection rate was about 55%.
nodes to judge the misbehavior information and presented work on adaptive learning mechanisms.
Aickelin et al. have been working on artificial immune systems since 2003 in an interdisciplinary project called danger theory. In [9] and [6] they presented links between intrusion detection systems and artificial immune systems, and a system based on the functionality of dendritic cells. They also introduced a danger signal approach allowing
In [14] the Hofmeyr and Forrest describe an AIS able to detect anomalies at the transport layer of the OSI protocol stack; only wired TCP/IP networks are considered. Their experiments were done on a pool of computers. Bit-string representation and the r-contiguous bits matching rule was used. Negative selection was used for producing
Kim and Bentley [11] discuss a network intrusion system that aims at detecting misbehavior by capturing TCP packet headers. They report that their AIS is unsuitable for detecting anomalies in communication networks. This result is questioned in [10] where it is stated that this is due to the choice of problem representation and due to the choice of matching threshold r for r-contiguous bits matching. Kim and Bentley also present in [4] a detection system based on the Dendritic Cell Algorithm [13], [6]. Although the TCP approach does not apply to wireless ad hoc (sensor) networks, the methods used to detect misbehavior can be adapted to be used in ad hoc sensor networks.
False positives rate for 2000 detectors
False positives rate for 2000 detectors 100
10% 80 30% 50%
False positives rate [%]
False positives rate [%]
100
60 40 20 0 500
1000 2000 Packet threshold
10% 80 30% 50% 60 40 20 0 500
4000
1000 2000 Packet threshold
(a)
(b)
False positives rate for 2000 detectors
False positives rate for 2000 detectors 100
10% 80 30% 50%
False positives rate [%]
False positives rate [%]
100
60 40 20 0 500
4000
1000 2000 Packet threshold
4000
(c)
10% 80 30% 50% 60 40 20 0 500
1000 2000 Packet threshold
4000
(d)
Fig. 4. False positives (10 connections) for CBR (a) and Poisson (b); False positives (50 connections) for (c) CBR and (d) Poisson. The number of detectors was 2000.
detectors. They also employed a flavor of positive selection in which useful detectors (that match a pathogen) are upgraded to memory detectors and unuseful ones get deleted; memory detectors have an increased lifetime compared to other detectors. Self is defined as normal pairwise TCP connections. Each detector is represented as a 49-bit string. The pattern matching is based on r-contiguous bits with a fixed r = 12. VI. C ONCLUSIONS
AND
F UTURE W ORK
In this document we investigated the influence of the network payload given by 50 concurrent connections and the impact of two packet injection models on our AIS. We observed that for each traffic model alone the network payload had no significant impact on the detection performance. In the 10 connection examples both models showed a similar detection performance, which is supported by the overlapping 95% confidence intervals. In the 50 connection experiments differences could be observed between the two models. This indicates that the traffic models have to some extend an impact on the detection rate. This impact is independent from
the number of detectors used by the AIS. We conclude that packet dropping when using CBR traffic does not cause the same impact on the antigen appearance as together with the Poisson traffic model. In contrast to our hypothesis from [3] that the impact of the two models should be similar on the detection performance, the Poisson model allows a better detection performance when combined with a high network payload. Finally we would like to mention that both models allow a decent detection rate of at least 60% and a false positives rate below 30% for misbehavior levels above 30%.
We only investigated traffic models with permanent data flow which cannot always be expected to occur in ad-hoc sensor networks. Our next task is therefore to investigate the influence of more irregular traffic behavior with random traffic bursts, created by random events throughout the network. This will give us an insight on the artificial immune systems capability to deal with irregular traffic patterns and the resulting detection performance. Also the influence of adaptive learning on the detection performance and the impact of different traffic models on the learning process have to be investigated.
ACKNOWLEDGMENTS This work was supported by the German Research Foundation (DFG) under the grant no. SZ 51/24-2 (Survivable Ad Hoc Networks – SANE). R EFERENCES [1] M. Drozda, S. Schaust, H. Szczerbicka. Is AIS Based Misbehavior Detection Suitable for Wireless Sensor Networks? Proc. IEEE Wireless Communications and Networking Conference (WCNC), pp. 3130–3135, Hong Kong, 2007. [2] M. Drozda, S. Schaust, H. Szczerbicka. AIS for Misbehavior Detection in Wireless Sensor Networks: Performance and Design Principles. Proc. IEEE Congress on Evolutionary Computation (CEC’07), special session on Recent developments in artificial immune systems, pp. 3719–3726, Singapore, 2007. [3] S. Schaust, M. Drozda, H. Szczerbicka. Impact of Packet Injection Models on Misbehaviour Detection Performance in Wireless Sensor Networks. Proc. 3rd IEEE International Workshop on Wireless and Sensor Networks Security (WSNS), Pisa, Italy, 2007. [4] J. Kim, P. Bentley, C. Wallenta, M. Ahmed, S. Hailes. Danger Is Ubiquitous: Detecting Malicious Activities in Sensor Networks Using the Dendritic Cell Algorithm. Proc. International Conference on Artificial Immune Systems (ICARIS), pp. 390–403, 2006. [5] M. Drozda, H. Szczerbicka. Artificial Immune Systems: Survey and Applications in Ad Hoc Wireless Networks. Proc. 2006 International Symposium on Performance Evaluation of Computer and Telecommunication Systems (SPECTS), pp. 485-492, Calgary, Canada, 2006. [6] J. Greensmith, U. Aickelin, S. Cayzer. Introducing Dendritic Cells as a Novel Immune-Inspired Algorithm for Anomaly Detection. Proc. International Conference on Artificial Immune Systems (ICARIS), pp. 153–167, 2005. [7] S. Sarafijanovi´c and J.-Y. Le Boudec. An Artificial Immune System for Misbehavior Detection in Mobile Ad-Hoc Networks with Virtual Thymus, Clustering, Danger Signal and Memory Detectors. Proc. ICARIS (Third international conference on artificial immune systems), 2004. [8] J.-Y. Le Boudec, S. Sarafijanovi´c. An Artificial Immune System Approach to Misbehavior Detection in Mobile Ad-Hoc Networks. Proc. Bio-ADIT, pp. 96–111, 2004. [9] U. Aickelin, J. Greensmith and J. Twycross. Immune System Approaches to Intrusion Detection - A Review. Proc. the 3rd International Conference on Artificial Immune Systems (ICARIS 2004), Catania, Italy, 2004. [10] J. Balthrop, S. Forrest and M. Glickman. Revisiting lisys: Parameters and normal behavior. In Proc. Congress on Evolutionary Computation, pp. 1045–1050,2002. [11] J. Kim, P.J. Bentley. Evaluating Negative Selection in an Artificial Immune System for Network Intrusion Detection, Proc. Genetic and Evolutionary Computation Conference (GECCO), 2001 [12] S. Marti, T. J. Giuli, K. Lai and M. Baker. Mitigating routing misbehavior in mobile ad hoc networks. Mobile Computing and Networking, pp. 255-265, 2000. [13] J. Banchereau, F. Briere, C. Caux, J. Davoust, S. Lebecque, Y.J. Liu, B. Pulendran, K. Palucka. Immunobiology of Dendritic Cells. Annual Review of Immunology, vol. 18, no. 1, pp. 767–811, 2000. [14] S. Hofmeyr and S. Forrest. Immunity by Design: An Artificial Immune System. Proc. the Genetic and Evolutionary Computation Conference (GECCO), Morgan-Kaufmann, San Francisco, CA, pp. 1289-1296, 1999. [15] L. Bajaj, M. Takai, R. Ahuja, K. Tang, R. Bagrodia, and M. Gerla. GloMoSim: A Scalable Network Simulation Environment. UCLA Computer Science Department Technical Report 990027, May 1999.