coatings Article
Influence of Power Pulse Parameters on the Microstructure and Properties of the AlCrN Coatings by a Modulated Pulsed Power Magnetron Sputtering Jun Zheng 1 , Hui Zhou 1, *, Binhua Gui 1 , Quanshun Luo 2 1 2 3
*
ID
, Haixu Li 3 and Qimin Wang 3, *
Science and Technology on Vacuum Technology and Physics Laboratory, Lanzhou Institute of Physics, Lanzhou 730000, China;
[email protected] (J.Z.);
[email protected] (B.G.) Materials and Engineering Research Institute, Sheffield Hallam University, Sheffield S1 1WB, UK;
[email protected] School of Electromechanical Engineering, Guangdong University of Technology, Guangzhou 510006, China;
[email protected] Correspondence:
[email protected] (H.Z.);
[email protected] (Q.W.); Tel.: +86-20-3932-2740 (Q.W.)
Academic Editor: Alessandro Lavacchi Received: 15 July 2017; Accepted: 27 November 2017; Published: 30 November 2017
Abstract: In this study, AlCrN coatings were deposited using modulated pulsed power magnetron sputtering (MPPMS) with different power pulse parameters by varying modulated pulsed power (MPP) charge voltages (350 to 550 V). The influence of power pulse parameters on the microstructure, mechanical properties and thermal stability of the coatings was investigated. The results indicated that all the AlCrN coatings exhibited a dense columnar microstructure. Higher charge voltage could facilitate a denser coating microstructure. As the charge voltage increased up to 450 V or higher, the microvoids along the column boundaries disappeared and the coatings became fully dense. The main phase in the AlCrN coatings was the c-(Al, Cr)N solid solution phase with NaCl-type phase structure. A diffraction peak of the h-AlN phase was detected at a 2θ of around 33◦ , when the charge voltage was higher than 500 V. The hardness of the AlCrN coatings varied as a function of charge voltage. The maximum value of the hardness (30.8 GPa) was obtained at 450 V. All the coatings showed good thermal stability and maintained their structure and mechanical properties unchanged up to 800 ◦ C during vacuum annealing. However, further increasing the annealing temperature to 1000 ◦ C resulted in apparent change in the microstructure and decrease in the hardness. The charge voltages also showed a significant influence on the high-temperature tribological behavior of the coatings. The coating deposited at the charge voltage of 550 V exhibited excellent tribological properties with a low friction coefficient. Keywords: modulated pulsed power magnetron sputtering; power pulse parameter; AlCrN coating; microstructure; tribological behavior
1. Introduction In the last few decades, both high-power impulse magnetron sputtering (HIPIMS) and high-power pulsed magnetron sputtering (HPPMS) technologies have attracted significant attention from researchers and industry [1]. The HIPIMS technique applies short power pulses, with power densities of up to several kilowatts per square centimeter, on to the cathode target, resulting in high ionization of the deposition species. This technique improves the coating structure, improves certain mechanical properties such as hardness and adhesion strength between the coating and the substrate, and can be used to obtain a uniform deposition on workpieces with a complex shape [2–4]. However, some drawbacks such as a low deposition rate and charge instability due to peak voltages that are too high limit the application of the HIPIMS [5]. Coatings 2017, 7, 216; doi:10.3390/coatings7120216
www.mdpi.com/journal/coatings
Coatings 2017, 7, 216
2 of 16
As an alternative to the HIPIMS technique, the modulated pulsed power magnetron sputtering (MPPMS) technique has relatively lower peak power compared to HIPIMS (several hundred W/cm2 as compared to several kW/cm2 in conventional HIPIMS) and longer pulse lengths (up to 3 ms as compared to 5–150 µs for conventional HIPIMS) [5]. In addition, MPPMS possesses two-stage pulses. In the first step, called the weak ionization stage, a low voltage is applied to ignite the plasma. Then the pulse is altered during the strongly ionized stage, to have high voltage, current and power. By using this kind of technique, the stability and control ability of high-power impulse magnetron sputtering are both further improved [5–14]. Using the MPPMS technique, Lin et al. [5–8], Li et al. [9], Papa et al. [10], Myers et al. [11–13], and Wang et al. [14] investigated the fabrication of metallic coatings (Cr, Ta), transition metal nitride coatings (CrN, Cr2 N, TiN), multilayer/super-lattice coatings (CrN/AlN), oxide coatings (TiO2 ), and so forth. By varying the shape, width, and frequency of the power pulses, strong ionization and good coating properties can be obtained with the MPPMS technique. However, it has been noticed that most of the publications related to MPPMS are laboratory experiments, whereas the employed cathodes were mostly pure metals. In particular, more attentions need to be paid to the MPPMS deposition of multi-component coatings by alloy targets as most industrial hard coatings are multi-component coatings. In this article, we will report the fabrication of AlCrN coatings using an industrial MPPMS coater. AlCrN and AlCrN-based coatings have been studied by researchers and industries due to their excellent tribological properties at elevated temperatures [15–17]. They have been extensively applied on to cutting tools, molds, and special components for antiwear applications [15,18]. Currently, most of the AlCrN coatings are deposited using arc ion plating or traditional DC/pulse magnetron sputtering (DCMS/PMS) techniques. However, the coatings that result from arc ion plating deposition present many macroparticles on the coating surface, resulting in high friction coefficient and wear rate [19,20]. The coatings deposited using magnetron sputtering usually exhibited a coarse columnar microstructure and low adhesion due to the low ionization rate of the magnetron sputtering [21]. Recently, the HIPIMS technique has been used to prepare AlCrN coatings. It was found that the AlCrN coating deposited by HIPIMS showed a very dense microstructure and a smooth surface, and thus had excellent mechanical properties [22,23]. Compared to HIPIMS, the MPPMS technique possesses the great advantages of better stability, control ability, and a higher deposition rate, all of which are beneficial for industrial production. However, AlCrN coatings synthesized using the MPPMS technique have rarely been reported. The influence of the pulse parameters of MPP, which are editable, on the microstructure and properties of AlCrN coatings is worth investigating. Thus, in this paper, we fabricated the AlCrN coatings using a MPPMS technique in an industrial physical vapor deposition (PVD) coater. To investigate the influence of MPPMS plasma on the growth and properties of the coatings, we varied the charge voltage to obtain different pulses with various peak voltages and peak currents. The microstructure, mechanical properties, thermal stability, and tribological properties of the coatings were investigated. 2. Materials and Methods An industrial scale coating unit, the Flexi coat 1000, with a chamber volume of 1 m3 manufactured by IHI Hauzer Techno Coating B.V. (Venlo, The Netherlands) was used for coating deposition. The coating unit was equipped with four sputtering cathodes, two of them with MPPMS power supply, and two with DC sputtering power. In this study, we used the two facing MPPMS sputtering cathodes with AlCr targets (99.99 at %, Al60 Cr40 , at %). The substrates in this study included polished WC-Co cemented carbide coupons (30 × 30 × 8 mm3 , Ra = 34.6 nm) and N-type (100)-orientated Si wafers (Ra = 5 nm). The substrates were ultrasonically cleaned in acetone and alcohol for 15 min each, then dried and fixed in the coating chamber before coating deposition. After the coating chamber was evacuated to a vacuum of less than 5.0 × 10⁻³ Pa, Ar gas at a flow rate of 130 sccm was introduced into the chamber. Presputtering of the target and plasma cleaning of the substrates with a plasma
Coatings 2017, 7, 216
3 of 16
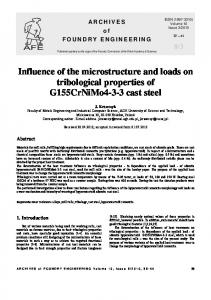
Coatings 2017, 7, 216 source were conducted; both procedures aimed to remove the impurities and absorb the gaseous species. Then coating deposition began with the two AlCr MPPMS targets sputtering in an Ar + N2 gas substrates with a plasma source were conducted; both procedures aimed to remove the impurities environment. The Ar and N2 gas flow rates were set at 200 and 300 sccm, respectively. The deposition and absorb the gaseous species. Then coating deposition began with the two AlCr MPPMS targets ◦ C. Figure 1 schematically shows the waveform and parameters of temperature was kept at 2450 sputtering in an Ar + N gas environment. The Ar and N 2 gas flow rates were set at 200 and 300 sccm, the MPP power pulses applied on to the sputtering ForFigure the MPP power pulses, a repeated respectively. The deposition temperature was kept targets. at 450 °C. 1 schematically shows the two-stage pulse (τon in Figure 1) was utilized. In the first stage, referred to as the weak ionization waveform and parameters of the MPP power pulses applied on to the sputtering targets. For the MPP in Figure 1) was utilized. In the first stage, referred to stagepower pulses, a repeated two‐stage pulse (τ (τw ), a low voltage is applied to igniteonthe plasma. Then the pulse proceeds to the strongly as the weak ionization stage (τ w ), a low voltage is applied to ignite plasma. Then pulse ionized stage which has a high voltage (τs ). Table 1 lists the MPP powerthe parameters usedthe in this study proceeds to the strongly ionized stage which has a high voltage (τ s). Table 1 lists the MPP power and the resulting coating characteristics. During coating deposition, MPP power pulses with a fixed parameters used in this study and the resulting coating characteristics. During coating deposition, average power Pa , constant pulse on time τon , and constant τw /τs ratio were utilized. By increasing MPP power pulses with a fixed average power Pa, constant pulse on time τon, and constant τw/τs ratio the charge voltage of the MPP power, the peak voltage, peak current, and peak power of the power were utilized. By increasing the charge voltage of the MPP power, the peak voltage, peak current, pulses increased (Table 1). To keep fixed the average power, the frequency of the power pulses changed and peak power of the power pulses increased (Table 1). To keep fixed the average power, the accordingly, as shown in Table 1. frequency of the power pulses changed accordingly, as shown in Table 1.
Figure 1. Typical waveform and parameters of the modulated pulsed power (MPP) power pulses. Figure 1. Typical waveform and parameters of the modulated pulsed power (MPP) power pulses. τ on: τon : the pulse‐on time; τ w: the weakly ionized pulse time; τ the pulse-on time; τw : the weakly ionized pulse time; τss: the strongly ionized pulse time; f: the pulse : the strongly ionized pulse time; f : the pulse frequency; P a: the average target power; P : the peak voltage of the frequency; Pa : the average target power; PP P: : the peak power of the pulses; V the peak power of the pulses;PV P : the peak voltage of the P: the peak current of the pulses. pulses; I pulses; IP : the peak current of the pulses. Table 1. Deposition parameters using different modulated pulsed power magnetron sputtering
Table 1. Deposition parameters using different modulated pulsed power magnetron sputtering (MPPMS) charge voltages in this study. (MPPMS) charge voltages in this study. MPP Pulse Parameters Charge voltage τon τw/τs MPP f Pulse Parameters Pa PP Charge V a [V] [μs] [μs] [Hz] [Kw] [kW] Voltage τon τw /τs Pa PP f [Hz]203 800/700 10.0 [kW]56 V a [V]350 [µs]1500 [µs] [Kw] 400 1500 800/700 120 10.0 95 350 1500 800/700 203 10.0 56 1500 800/700 800/700 120 87 10.010.0 95134 400 450 1500 1500 800/700 800/700 87 68 10.010.0 134158 450 500 1500 1500 800/700 800/700 68 45 10.010.0 158197 500 550 1500
Sample Sample C1 C2 C3 C4 C5
C1 C2 C3 C4 C5
550
1500
800/700
45
10.0
197
VP [V] V P433 [V] 492 433 552 492 622 552 691 622 691
Coating Coating Hardness Thickness IP Coating Coating [GPa] [A] Thickness Hardness [μm] IP [A]24.9 ± 7.3 130 3.3 [µm] [GPa] 192 26.6 ± 5.9 2.9 130 24.9 ± 7.3 3.3 243 192 30.8 ± 5.5 26.6 ± 5.9 3.0 2.9 253 243 26.5 ± 5.4 30.8 ± 5.5 3.5 3.0 287 253 20.6 ± 6.6 26.5 ± 5.4 3.9 3.5 287 20.6 ± 6.6 3.9
The phase structure of the as‐deposited coatings was characterized on an X‐ray diffraction (XRD, Philips, Almelo, The Netherlands) machine in the θ/2θ geometry using Cu Kα radiation (40 kV and The phase structure of the as-deposited coatings was characterized on an X-ray diffraction (XRD, 40 mA). The morphologies and chemical compositions of the coatings were examined using a Philips, Almelo, The Netherlands) machine in the θ/2θ geometry using Cu Kα radiation (40 kV and scanning electron microscope (SEM, JSM‐6701F, JEOL, Tokyo, Japan) equipped with an energy‐ 40 mA). The morphologies and chemical compositions of the coatings were examined using a scanning dispersive X‐ray spectrometer. The EDX measurements were performed on a flat film surface (no tilt) electron microscope (SEM, JSM-6701F, JEOL, Tokyo, Japan) equipped with an energy-dispersive with the following parameters: A 10 kV accelerating voltage and a fixed working distance of 4 mm. X-rayThe probe current was automatically set and was recorded as around 0.16 nA. The hardness (H) and spectrometer. The EDX measurements were performed on a flat film surface (no tilt) with the following parameters: A 10 kV accelerating voltage and a fixed working distance of 4 mm. The 2probe elastic modulus (E) were measured using a nanoindenter with a Berkovich diamond indenter (NHT , CSM, Peseux, Switzerland). current was automatically set and was recorded as around 0.16 nA. The hardness (H) and elastic
modulus (E) were measured using a nanoindenter with a Berkovich diamond indenter (NHT2 , CSM, Peseux, Switzerland).
Coatings 2017, 7, 216
4 of 16
To investigate the thermal stability and the structural changes of the coatings at an elevated temperature, annealing experiments were conducted at 600 ◦ C, 800 ◦ C, and 1000 ◦ C for 2 h in vacuum (≤ 1 × 10⁻² Pa). The heating rate was kept at 5 ◦ C/min. After thermal annealing, the vacuum chamber was air cooled to room temperature. The tribological properties were investigated using a high-temperature ball-on-disc tribometer (HT-1000, CSM, Peseux, Switzerland) at temperatures of 600 ◦ C and 800 ◦ C. Al2 O3 balls with a 6 mm diameter were used as the counterparts. A normal load of 5 N was applied on the ball. The average sliding speed was 0.03 m/s for a fixed period of 50,000 rotating cycles. To measure the wear loss, the two-dimensional (2D) cross-sectional profile of the wear tracks were obtained using a Taylor Hobson CCI optical profiler. The wear rates (W, ×10−7 mm3 /N·m) of the coatings were calculated with the following formula: W = W r /(L × Sd ) = S × 2πR/(L × 2Πr × n) = S/(L × n), where W r is the wear volumes of coating, L is the load, R is the radius of wear crack, n is the number of wear laps and S is the cross-sectional area of wear crack. The wear tracks were analyzed using the aforementioned SEM/EDX machine. X-ray photo electron spectroscopy (XPS, PHI-Quantum 2000, Eden Prairie, MN, USA) was performed to observe the bonding states of the tribo-oxides in the wear tracks. During XPS analysis, an Al Kα X-ray source (13 kV and 15 mA) was used. The XPS spectra were obtained after removing the surface layer of the sample by in situ sputtering with Ar+ ions (3 keV) for 40 s. The scanning range for the full spectrum and individual spectrum was 100 and 30 eV, respectively. The scanning step for the full spectrum and individual spectrum was set at 1 and 0.1 eV, respectively. The individual spectra were calibrated using a carbon peak C 1s at 284.5 eV. 3. Results and Discussion 3.1. Chemical Composition, Morphology, and Phase Structure of the Coatings Figure 2 shows the Cr, Al and N content (EDX results) in the AlCrN coatings as a function of the charge voltage of the AlCr targets. When the charge voltages were no higher than 450 V, the coatings were over-stoichiometric, with the N content being detected as almost constant: ~56 at %. The Al/Cr ratios were kept at around 1.3:1, which was lower than the ratio in the AlCr target (1.5:1). The decreased Al contents would be attributed to the lower sputtering rate of Al than Cr [24]. The N content decreased rapidly and stayed at ~52 at % when the charge voltage increased to 450 V or above. Accordingly, the Al content increased from ~25 at % to ~28 at % and the Cr content increased from ~19 at % to ~20 at %. As shown in Table 1, higher charge voltage of MPP power source corresponded to higher scales of peak voltage, peak current and increased peak power, which resulted in higher plasma density and stronger ionization of deposition species. The improved ionization would enhance the ion bombardment and resulted in more re-sputtering of nitrogen for its lower mass than the metal elements, which consequently led to lower N contents. Moreover, the formation of a non-conductive AlN film on the target surface has been reported to lead to target poisoning [25]. In the current work, the higher ionization of MPP deposition species at higher charge voltages is expected to reduce the target poisoning, resulting in higher sputtering rate of Al species from the target than that at lower charge voltages. Therefore, lower N content and higher Al content was observed when the charge voltage increased to higher than 450 V in Figure 2. Figure 3 shows the XRD patterns of the AlCrN coatings deposited at various MPP charge voltages. When the charge voltage was lower than 500 V, the AlCrN coatings showed a typical B1-NaCl FCC structure with identifiable (111) and (200) diffraction peaks of the c-(Al, Cr) N phases. The (220) diffraction peak at 63–65◦ is clearly positioned due to its overlapping with a diffraction peak of the substrate. No diffraction peak corresponding to hexagonal h-AlN phase was observed. When the charge voltage reached 500 V, an h-AlN (100) diffraction peak at 2θ ≈ 33◦ appeared. No diffraction peak corresponding to the hexagonal h-AlN phase was observed. When the charge voltage reached 500 V, an h-AlN (100) diffraction peak at 2θ ≈ 33◦ appeared. When the charge voltage was further increased to 550 V, the h-AlN (100) diffraction peak becomes stronger and the h-AlN (002) diffraction peak also appears in the pattern. The results suggest that high voltage charge favors the formation
Coatings 2017, 7, 216
5 of 16
of h-AlN phase. As discussed above, an increase in the charge voltage corresponds to an increase in the peak power (Table 1) and a higher metal ionization ratio. With the application of bias voltage Coatings 2017, 7, 216 to theCoatings 2017, 7, 216 substrates, which was −100 V in this study, more metallic ions were attracted to the substrate with accelerated speeds. At higher energy, the atoms/ions prefer to occupy positions with the lowest substrates, which was −100 V in this study, more metallic ions were attracted to the substrate with substrates, which was −100 V in this study, more metallic ions were attracted to the substrate with free energy. Some of the Al-N bonds could agglomerate in the (Al, Cr)N solid solution and form the accelerated speeds. At higher energy, the atoms/ions prefer to occupy positions with the lowest free accelerated speeds. At higher energy, the atoms/ions prefer to occupy positions with the lowest free energy. Some of the Al‐N bonds could agglomerate in the (Al, Cr)N solid solution and form the h‐ h-AlN phase. Therefore, the phase separation was more apparent in the coatings deposited at high energy. Some of the Al‐N bonds could agglomerate in the (Al, Cr)N solid solution and form the h‐ AlN phase. Therefore, the Similar phase separation was reported more apparent in the coatings deposited at high charge voltages (500–550 V). results were by Bagcivan et al. [26]. In their research, AlN phase. Therefore, the phase separation was more apparent in the coatings deposited at high charge voltages (500–550 V). Similar results were reported by Bagcivan et al. [26]. In their research, (Cr1−x Alx )N coatings were deposited by DCMS, MF-MS (Middle Frequency Magnetron Sputtering), charge voltages (500–550 V). Similar results were reported by Bagcivan et al. [26]. In their research, (Cr 1−xAlx)N coatings were deposited by DCMS, MF‐MS (Middle Frequency Magnetron Sputtering), and HPPMS techniques, in which the Al/Cr ratios for initial h-AlN formation were compared. It was (Cr 1−xAlx)N coatings were deposited by DCMS, MF‐MS (Middle Frequency Magnetron Sputtering), and HPPMS techniques, in which the Al/Cr ratios for initial h‐AlN formation were compared. It was foundand HPPMS techniques, in which the Al/Cr ratios for initial h‐AlN formation were compared. It was that the formation of h-AlN phase in the HPPMS coatings was much easier than in other found that the formation of h‐AlN phase in the HPPMS coatings was much easier than in other techniques. Thethe Al/Cr ratio was high than for HPPMS for thewas firstmuch appearance of h-AlN phase, found that formation of h‐AlN phase 50:50 in the HPPMS coatings easier than in other techniques. The Al/Cr ratio was high than 50:50 for HPPMS for the first appearance of h‐AlN phase, whiletechniques. The Al/Cr ratio was high than 50:50 for HPPMS for the first appearance of h‐AlN phase, much higher Al/Cr ratio (77:23) was needed in the DCMS and MF-MS CrAlN coatings [26]. while much higher Al/Cr ratio (77:23) was needed in the DCMS and MF‐MS CrAlN coatings [26]. while much higher Al/Cr ratio (77:23) was needed in the DCMS and MF‐MS CrAlN coatings [26].
Figure 2. Chemical composition of AlCrN coatings as a function of charge voltage. Figure 2. Chemical composition of AlCrN coatings as a function of charge voltage. Figure 2. Chemical composition of AlCrN coatings as a function of charge voltage.
Figure 3. X‐ray diffraction (XRD) patterns of AlCrN coatings deposited at various charge voltages. Figure 3. X‐ray diffraction (XRD) patterns of AlCrN coatings deposited at various charge voltages.
Figure 3. X-ray diffraction (XRD) patterns of AlCrN coatings deposited at various charge voltages. As the charge voltage was increased from 350 to 450 V, it was found that the preferred As the charge voltage was increased from 350 to 450 V, it was found that the preferred orientation changed from (111) to (200). As reported by Paulitsch et al. [27] and Petrov et al. [28], the As the charge voltage was increased from 350 to 450 V, it was found that the preferred orientation orientation changed from (111) to (200). As reported by Paulitsch et al. [27] and Petrov et al. [28], the (200) orientation can be stabilized by a high ion to neutral ratio. A similar transition of the preferred changed from (111) to from (200).(111) As reported by to Paulitsch et ion al. [27] and Petrov et also al. [28], the (200) orientation can be stabilized by a high ion to neutral ratio. A similar transition of the preferred growth orientation to (200) due increased bombardment was found in (200) growth orientation from (111) to (200) due to increased ion bombardment was also found in orientation can sputtered be stabilized by a high ion to neutral ratio. A similar transitionoccur of the preferred magnetron TiAlN/VN and CrN/NbN coatings [29,30]. The transitions through magnetron sputtered TiAlN/VN and CrN/NbN coatings [29,30]. The transitions occur through growth orientation from (111) to (200) due to increased ion bombardment was also found in magnetron competitive grain growth. The increased ion bombardment favors renucleation and growth of (200) competitive grain growth. The increased ion bombardment favors renucleation and growth of (200) grains. In this study, high charge voltage [29,30]. meant high a higher ion competitive to atom ratio grain sputtered TiAlN/VN anda CrN/NbN coatings The ionization transitionsand occur through grains. In this study, a high charge voltage meant high ionization and a higher ion to atom ratio during the deposition process, which explains the preferred orientation evolution. It was also found growth. The increased ion bombardment favors renucleation and growth of (200) grains. In this study, during the deposition process, which explains the preferred orientation evolution. It was also found that the diffraction peaks were broadened, which indicates decreased grain size. Further increases to a high charge voltage meant high ionization and a higher ion to atom ratio during the deposition that the diffraction peaks were broadened, which indicates decreased grain size. Further increases to the charge explains voltages induced much lower diffraction peaks, indicating decreased crystallinity. To process, which preferred orientation evolution. It was also found that the diffraction peaks the charge voltages the induced much lower diffraction peaks, indicating decreased crystallinity. To clarify this point, we estimated the average grain sizes of the c‐(Al, Cr)N phases using a Williamson‐ were clarify this point, we estimated the average grain sizes of the c‐(Al, Cr)N phases using a Williamson‐ broadened, which indicates decreased grain size. Further increases to the charge voltages induced
Coatings 2017, 7, 216
6 of 16
muchCoatings 2017, 7, 216 lower diffraction peaks, indicating decreased crystallinity. To clarify this point, we estimated the average grain sizes of the c-(Al, Cr)N phases using a Williamson-Hall plot [31], as summarized in Hall plot [31], as summarized in Figure 4. It can be seen that the grain size of the c‐(Al, Cr)N phase Figure 4. It can be seen that the grain size of the c-(Al, Cr)N phase initially decreased from ~22.8 nm at Coatings 2017, 7, 216 initially decreased from ~22.8 nm at 350 V to ~8.0 nm at 450 V and then increased again to ~23.8 nm 350 V to ~8.0 nm at 450 V and then increased again to ~23.8 nm with a further increase in the charge with a further increase in the charge voltage. As discussed before, the increase in the charge voltage Hall plot [31], as summarized in Figure 4. It can be seen that the grain size of the c‐(Al, Cr)N phase voltage. As discussed increase in the (Table charge1) voltage corresponds to the increase in the corresponds to the before, increase the in the peak power and higher metal ionization ratio. The initially decreased from ~22.8 nm at 350 V to ~8.0 nm at 450 V and then increased again to ~23.8 nm peak increase in the impinging energy of the forming atoms/ions and enhanced ion bombardment favored power (Table 1) and higher metal ionization ratio. The increase in the impinging energy of the with a further increase in the charge voltage. As discussed before, the increase in the charge voltage forming atoms/ions and enhanced ion bombardment grain refinement a (200) preferred grain refinement and a (200) in preferred orientation at favored a charge of 450 ionization V. and When the charge corresponds to the increase the peak power (Table 1) and voltage higher metal ratio. The orientation atwas a charge voltage of 450 When effect the charge was further increased, the thermal voltages further increased, the V. thermal of the voltages ion bombardment induced a slight grain increase in the impinging energy of the forming atoms/ions and enhanced ion bombardment favored effectgrowth, again (Figure 4). of the ion bombardment induced a slight grain growth, again (Figure 4). grain refinement and a (200) preferred orientation at a charge voltage of 450 V. When the charge voltages was further increased, the thermal effect of the ion bombardment induced a slight grain growth, again (Figure 4).
Figure 4. Average grain size of AlCrN coatings as a function of the charge voltage. Figure 4. Average grain size of AlCrN coatings as a function of the charge voltage.
Figure 5 shows the surface and cross‐sectional SEM images of the AlCrN coatings deposited at
Figure 4. Average grain size of AlCrN coatings as a function of the charge voltage. Figure 5 shows the350 surface cross-sectional images the AlCrN coatings deposited the charge voltages V, 450 and V, 500 V and 550 V. SEM At 350 V, the of coating exhibited an apparent at thecolumnar microstructure with columns that are ~0.2–0.3 μm in diameter. The columns are not closely charge voltages 350 V, 450 V, 500 V and 550 V. At 350 V, the coating exhibited an apparent Figure 5 shows the surface and cross‐sectional SEM images of the AlCrN coatings deposited at columnar microstructure with columns that are ~0.2–0.3 µm in diameter. The columns are not closely packed together. Some penetrating voids can be detected between the columns (Figure 5a). When the the charge voltages 350 V, 450 V, 500 V and 550 V. At 350 V, the coating exhibited an apparent charge voltage increased to 450 V, the voids along the column boundaries disappeared and the film packed together. Some penetrating voids can be detected between the columns (Figure 5a). When the columnar microstructure with columns that are ~0.2–0.3 μm in diameter. The columns are not closely became fully dense. When the charge voltage was further increased to 500 V and 550 V, coatings with charge voltage increased to 450 V, the voids along the column boundaries disappeared and the film packed together. Some penetrating voids can be detected between the columns (Figure 5a). When the featureless and glass‐like microstructures were observed. As discussed above, an increased charge became fully dense. When the charge voltage was further increased to 500 V and 550 V, coatings with charge voltage increased to 450 V, the voids along the column boundaries disappeared and the film voltage corresponded a higher ionization which As would enhance ion bombardment became fully dense. When the charge voltage was further increased to 500 V and 550 V, coatings with featureless and glass-like to microstructures wereratio, observed. discussed above, an increasedand charge disrupt the local epitaxial growth of individual columns, resulting in renucleation of the grains and featureless and glass‐like microstructures were observed. As discussed above, an increased charge voltage corresponded to a higher ionization ratio, which would enhance ion bombardment and disrupt micro columns [32]. This can explain both the grain refinement and coating densification at higher voltage corresponded higher ionization ratio, which would enhance ion and the local epitaxial growthto ofa individual columns, resulting in renucleation ofbombardment the grains and micro charge voltages. The results are consistent with the observations of microstructure evolution reported disrupt the local epitaxial growth of individual columns, resulting in renucleation of the grains and columns [32]. This can explain both the grain refinement and coating densification at higher charge in previous work [28,29]. micro columns [32]. This can explain both the grain refinement and coating densification at higher voltages. The results are consistent with the observations of microstructure evolution reported in charge voltages. The results are consistent with the observations of microstructure evolution reported previous work [28,29]. in previous work [28,29].
(a)
(b) Figure 5. Cont.
(a)
(b) Figure 5. Cont.
Figure 5. Cont.
Coatings 2017, 7, 216 Coatings 2017, 7, 216
7 of 16
Coatings 2017, 7, 216
(c)
(c)
(d)
(d)
Figure 5. The surface (insets) and cross‐sectional scanning electron microscopy (SEM) micrographs of Figure 5. The surface (insets) and cross‐sectional scanning electron microscopy (SEM) micrographs of Figure 5. The surface (insets) and cross-sectional scanning electron microscopy (SEM) micrographs of AlCrN coatings deposited at different charge voltages: (a) 350 V; (b) 450 V; (c) 500 V; (d) 550 V. AlCrN coatings deposited at different charge voltages: (a) 350 V; (b) 450 V; (c) 500 V; (d) 550 V. AlCrN coatings deposited at different charge voltages: (a) 350 V; (b) 450 V; (c) 500 V; (d) 550 V.
3.2. Mechanical Properties of the Coatings 3.2. Mechanical Properties of the Coatings 3.2. Mechanical Properties of the Coatings Figure 6 shows the hardness and elastic modulus values of the AlCrN coatings as a function of Figure 6 shows the hardness and elastic modulus values of the AlCrN coatings as a function of charge voltage. The values of coating hardness and elastic modulus in this study are comparable to Figure 6 shows the hardness and elastic modulus values of the AlCrN coatings as a function of charge voltage. The values of coating hardness and elastic modulus in this study are comparable to the values found in other studies [22,26]. As the charge voltage increased, the hardness and elastic charge voltage. The values of coating hardness and elastic modulus in this study are comparable to the the values found in other studies [22,26]. As the charge voltage increased, the hardness and elastic modulus of the AlCrN coatings initially increased from 24.4 GPa and 401.6 GPa at 350 V to maximum values found in other studies [22,26]. As the charge voltage increased, the hardness and elastic modulus modulus of the AlCrN coatings initially increased from 24.4 GPa and 401.6 GPa at 350 V to maximum values of approximately 28.6 GPa and 439.5 GPa at a charge voltage of 450 V, respectively. As of the AlCrN coatings initially 24.4 GPa 401.6 GPa at 350 to maximum values As of values of approximately 28.6 increased GPa and from 439.5 GPa at and a charge voltage of V450 V, respectively. discussed above, the increase in the impinging energy of the forming atoms/ions and enhanced ion approximately 28.6 GPa and 439.5 GPa at a charge voltage of 450 V, respectively. As discussed above, discussed above, the increase in the impinging energy of the forming atoms/ions and enhanced ion bombardment favored grain refinement and a (200) preferred orientation at a charge voltage of 450 V the increase in the impinging energy of the forming atoms/ions and enhanced ion bombardment bombardment favored grain refinement and a (200) preferred orientation at a charge voltage of 450 V (Figures 3 and 4), as well as the microstructure densification (Figure 5). The enhanced hardness at a favored grain refinement and a (200) preferred orientation at amicrostructure charge voltagedensification of 450 V (Figures 3 and 4), (Figures 3 and 4), as well as the microstructure densification (Figure 5). The enhanced hardness at a charge voltage of 450 V is believed to originate from the and grain as well as the microstructure densification (Figure 5). The enhanced hardness at a charge voltage of refinement. A further increase in the charge voltage to 500 V and 550 V resulted in a decrease in the charge voltage of 450 V is believed to originate from the microstructure densification and grain 450 Vhardness and elastic modulus (Figure 6). The rebounding mechanical properties should be related to is believed to originate from the microstructure densification and grain refinement. A further refinement. A further increase in the charge voltage to 500 V and 550 V resulted in a decrease in the the grain growth and the formation of the softer h‐AlN phase in the coatings (Figures 3 and 4). Similar increase in the charge voltage to 500 V and 550 V resulted in a decrease in the hardness and elastic hardness and elastic modulus (Figure 6). The rebounding mechanical properties should be related to tendencies found in similar coatings accompanying increases in ionization ratio and ion and modulus (Figurewere 6). The rebounding mechanical properties the should be related to the grain growth the grain growth and the formation of the softer h‐AlN phase in the coatings (Figures 3 and 4). Similar bombardment [22]. the formation of the softer h-AlN phase in the coatings (Figures 3 and 4). tendencies were tendencies were found in similar coatings accompanying the increases in Similar ionization ratio and ion found in similar coatings accompanying the increases in ionization ratio and ion bombardment [22]. bombardment [22].
Figure 6. The hardness and elastic modulus of AlCrN coatings deposited at different charge voltages.
3.3. Thermal Stability of the Coatings
Figure 6. The hardness and elastic modulus of AlCrN coatings deposited at different charge voltages. Figure 7a–c show the XRD patterns of the AlCrN coatings after vacuum annealing at 600 °C, 800 °C Figure 6. The hardness and elastic modulus of AlCrN coatings deposited at different charge voltages. and 1000 °C, respectively. To clarify that the XRD peaks were changed by thermal annealing, we 3.3. Thermal Stability of the Coatings added the labeling of the unaltered XRD peaks as “+” in Figure 7. After being annealed at 600 °C 3.3. Thermal Stability of the Coatings (Figure 7a), all the AlCrN coatings exhibited similar diffraction patterns to those of the as‐deposited Figure 7a–c show the XRD patterns of the AlCrN coatings after vacuum annealing at 600 °C, 800 °C Figure 7a–c show the XRD patterns of the AlCrN coatings after vacuum annealing at 600 ◦ C, coatings (Figure 3). In the XRD patterns from coatings annealed at 800 °C (Figure 7b), it is evident and 1000 °C, respectively. To clarify that similar the peaks were changed by thermal we ◦ that most of ◦the diffraction curves are to those of the as‐deposited and °C annealing, annealed 800 C and 1000 C, respectively. To clarify thatXRD the XRD peaks were changed by600 thermal annealing,
added the labeling of the unaltered XRD peaks as “+” in Figure 7. After being annealed at 600 °C we added the labeling of the unaltered XRD peaks as “+” in Figure 7. After being annealed at 600 ◦ C (Figure 7a), all the AlCrN coatings exhibited similar diffraction patterns to those of the as‐deposited (Figure 7a), all the AlCrN coatings exhibited similar diffraction patterns to those of the as-deposited coatings (Figure 3). In the XRD patterns from coatings annealed at 800 °C (Figure 7b), it is evident coatings (Figure 3). In the XRD patterns from coatings annealed at 800 ◦ C (Figure 7b), it is evident that that most of the diffraction curves are similar to those of the as‐deposited and 600 °C annealed
Coatings 2017, 7, 216
8 of 16
Coatings 2017, 7, 216
most of the diffraction curves are similar to those of the as-deposited and 600 ◦ C annealed coatings, except that some weak peaks were identified as hexagonal h-AlN and h-Cr2 N phases within the coating coatings, except that some weak peaks were identified as hexagonal h‐AlN and h‐Cr 2N phases within deposited at adeposited 550 V charge This suggests that most of the AlCrN coatings maintained thermal the coating at a voltage. 550 V charge voltage. This suggests that most of the AlCrN coatings ◦ C. By further increasing the annealing temperature to 1000 ◦ C stability at temperatures belowat 800 maintained thermal stability temperatures below 800 °C. By further increasing the annealing (Figure 7c), diffraction peaks of the hexagonal h-AlN and h-Cr2 N phase were observed in2most coatings. temperature to 1000 °C (Figure 7c), diffraction peaks of the hexagonal h‐AlN and h‐Cr N phase were Because the coatings deposited by PVD process are thermodynamically meta-stable, the c-(Al, Cr)N observed in most coatings. Because the coatings deposited by PVD process are thermodynamically solid solution phase containing high Al content is expected to undergo partial decomposition at high meta‐stable, the c‐(Al, Cr)N solid solution phase containing high Al content is expected to undergo temperature to form thermodynamically stable phases of h-AlN and Cr2 N. It should be pointed out partial decomposition at high temperature to form thermodynamically stable phases of h‐AlN and that even at 1000 ◦ C, the fraction of decomposed c-(Al, Cr)N phase was very limited (Figure 7c). Cr2N. It should be pointed out that even at 1000 °C, the fraction of decomposed c‐(Al, Cr)N phase An advantage of the ternary Al-Cr-N system was reported to be the thermal stability of the cubic AlN was very limited (Figure 7c). An advantage of the ternary Al‐Cr‐N system was reported to be the phase even at veryof high Forat example. AlAl‐concentrations concentrations of 60–75 at % have been thermal stability the Al-concentrations cubic AlN phase [2]. even very high [2]. For example. Al reported in the stabilized cubic AlCrN phases [3,26]. concentrations of 60–75 at % have been reported in the stabilized cubic AlCrN phases [3,26].
(a)
(b)
(c) Figure 7. XRD patterns of AlCrN coatings deposited at different charge voltages after vacuum Figure 7. XRD patterns of AlCrN coatings deposited at different charge voltages after vacuum annealing for 2 h at (a) 600 °C, (b) 800 °C, and (c) 1000 °C. “+” denotes the XRD peaks unaltered by annealing for 2 h at (a) 600 ◦ C, (b) 800 ◦ C, and (c) 1000 ◦ C. “+” denotes the XRD peaks unaltered by the the thermal annealing. thermal annealing.
Figure 8 shows the cross‐sectional SEM micrographs of typical AlCrN coatings (deposited at 450 V Figure 8 shows the cross-sectional SEM micrographs of typical AlCrN coatings (deposited at 450 V and 500 V) after vacuum annealing. Corresponding to the XRD results in Figure 7a,b, no apparent and 500 V) after vacuum annealing. Corresponding to the XRD results in Figure 7a,b, no apparent microstructure change was observed in the coatings after vacuum annealing at 800 °C (comparing microstructure change was inafter the coatings vacuum 800 ◦ C grains (comparing Figure 8a,c and Figure 5). observed However, vacuum after annealing at annealing 1000 °C, at granular were ◦ Figure 8a,c and Figure 5). However, after vacuum annealing at 1000 C, granular grains were observed observed in the coatings deposited at both 450 V and at 500 V (Figure 8b,d), implying grain coarsening in deposited at both 450 V andfrom a very fine at 500 V (Figure 8b,d), implying grain coarsening in the in the the coatings coatings. The coatings transformed columnar microstructure to a granular coatings. The coatings transformed from a very fine columnar microstructure to a granular crystal crystal microstructure. These results are consistent with the XRD results in Figure 7c. Apparently microstructure. These results are consistent with the XRD results in Figure 7c. Apparently narrower narrower diffraction peaks of the c‐(Al, Cr)N phase indicate improved crystallization. Both h‐AlN diffraction peaks were of thealso c-(Al, Cr)N phase indicate improved crystallization. Both h-AlN 2N and Cr2N peaks observed. As discussed before, the coatings deposited using and the Cr PVD peaks were also observed. As discussed before, the coatings deposited using the PVD process are far process are far from thermodynamic equilibrium. The coatings will try to approach thermodynamic from thermodynamic equilibrium. The coatings will try to approach thermodynamic equilibrium at a equilibrium at a high temperature. A decrease in defect density and grain growth during the thermal annealing process will be expected. Higher annealing temperatures favor restoration and grain coarsening process. Therefore, we observed different coating microstructures in Figure 8.
Coatings 2017, 7, 216
9 of 16
high temperature. A decrease in defect density and grain growth during the thermal annealing process will be expected. Higher annealing temperatures favor restoration and grain coarsening process. Therefore, we observed different coating microstructures in Figure 8. Coatings 2017, 7, 216
(a)
(b)
(c)
(d)
Figure 8. The cross‐sectional SEM micrographs of the vacuum annealed AlCrN coatings deposited at Figure 8. The cross-sectional SEM micrographs of the vacuum annealed AlCrN coatings deposited the AlCr target charge voltage of (a,b) 450 V and (c,d) 500 V after vacuum annealing for 2 h at (a,c) at the AlCr target charge voltage of (a,b) 450 V and (c,d) 500 V after vacuum annealing for 2 h at 800 °C and (b,d) 1000 °C. (a,c) 800 ◦ C and (b,d) 1000 ◦ C.
As shown in Figure 9, when the vacuum annealing temperature was below 800 °C, the hardness As shown in Figure 9, when the vacuum annealing temperature was below 800 ◦ C, the hardness values were almost the same as those of the as‐deposited coatings. This suggests that the AlCrN values were almost the same as those of the as-deposited coatings. This suggests that the AlCrN coatings maintained thermal stability at temperatures below 800 °C, which is consistent with both the coatings maintained thermal stability at temperatures below 800 ◦ C, which is consistent with both the XRD results (Figure 7) and the SEM results (Figure 8). Similar results were reported by Feng et al. [33] XRD results (Figure 7) and the SEM results (Figure 8). Similar results were reported by Feng et al. [33] and Lin et al. [34]: Hardness of the AlCrN coatings drops substantially at temperatures higher than and Lin et al. [34]: Hardness of the AlCrN coatings drops substantially at temperatures higher than 700 °C. The formation of softer hcp‐AlN and other new phases are the reason behind the sharp drop 700 ◦ C. The formation of softer hcp-AlN and other new phases are the reason behind the sharp in hardness at high temperatures. After annealing at 1000 °C, significant drops in the hardness values drop in hardness at high temperatures. After annealing at 1000 ◦ C, significant drops in the hardness were found for all the coatings. The grain growth and decomposition of the c‐(Al, Cr)N solid solution values were found for all the coatings. The grain growth and decomposition of the c-(Al, Cr)N solid into h‐AlN and Cr2N phases should explain the softening of the coatings at high temperatures. solution into h-AlN and Cr2 N phases should explain the softening of the coatings at high temperatures. Therefore, the AlCrN coatings exhibited lower hardness after annealing at 1000 °C. Therefore, the AlCrN coatings exhibited lower hardness after annealing at 1000 ◦ C.
Figure 9. The evolution of the hardness values after vacuum annealing at 600, 800 and 1000 °C for 2 h
and Lin et al. [34]: Hardness of the AlCrN coatings drops substantially at temperatures higher than 700 °C. The formation of softer hcp‐AlN and other new phases are the reason behind the sharp drop in hardness at high temperatures. After annealing at 1000 °C, significant drops in the hardness values were found for all the coatings. The grain growth and decomposition of the c‐(Al, Cr)N solid solution into h‐AlN and Cr2N phases should explain the softening of the coatings at high temperatures. Coatings 2017, 7, 216 10 of 16 Therefore, the AlCrN coatings exhibited lower hardness after annealing at 1000 °C.
Figure 9. The evolution of the hardness values after vacuum annealing at 600, 800 and 1000 °C for 2 h Figure 9. The evolution of the hardness values after vacuum annealing at 600, 800 and 1000 ◦ C for 2 h for AlCrN coatings deposited at different charge voltages. for AlCrN coatings deposited at different charge voltages.
Coatings 2017, 7, 216
3.4. Tribological Properties of the Coatings 3.4. Tribological Properties of the Coatings ◦ The friction coefficient curves of the AlCrN coating sliding against 2aOAl 2 O3 ball at 600 C and The friction coefficient curves of the AlCrN coating sliding against a Al 3 ball at 600 °C and 800 °C 800 are presented in Figure 10. It was found that the friction coefficient curves can be divided are presented in Figure 10. It was found that the friction coefficient curves can be divided into two into two periods: the running-in period and the steady-state period. The friction coefficients of all periods: the running‐in period and the steady‐state period. The friction coefficients of all the coatings the coatings experienced a rapid increase in the initial running-in period, which was considered a experienced a rapid increase in the initial running‐in period, which was considered a result of the result of the transition in contact conditions from two-body abrasion to interfacial sliding. In a similar transition in contact conditions from two‐body abrasion to interfacial sliding. In a similar ball‐on‐disc ball-on-disc dry sliding wear of a sputtered nitride coating, the running-in friction was found to be dry sliding wear of a sputtered nitride coating, the running‐in friction was found to be associated associated with a progressive transition of the sliding contact two-body sliding to the formation with a progressive transition of the sliding contact from from two‐body sliding to the formation of ofa atribofilm [35]. A relatively steady state was reached after some rotating laps. The friction coefficient tribofilm [35]. A relatively steady state was reached after some rotating laps. The friction coefficient curves for all the coatings were stable at 600 ◦ C after around 500 laps except in the case of the coating curves for all the coatings were stable at 600 °C after around 500 laps except in the case of the coating deposited at a charge voltage of 550 V. At 800 ◦ C, the friction coefficient curves of all the coatings deposited at a charge voltage of 550 V. At 800 °C, the friction coefficient curves of all the coatings decreased as the number of rotating laps increased, indicating a gradual formation of oxides, which decreased as the number of rotating laps increased, indicating a gradual formation of oxides, which were able to play thethe rolerole of solid lubricants [36]. However, the curves the AlCrN coating deposited were able to play of solid lubricants [36]. However, the for curves for the AlCrN coating at a charge voltage of 550 V exhibited a much lower friction coefficient than the other coatings the deposited at a charge voltage of 550 V exhibited a much lower friction coefficient than the at other ◦ ◦ test temperature of both 600 C and 800 600 C. This may800 be attributable to be theattributable lower coating hardness coatings at the test temperature of both °C and °C. This may to the lower induced by the formation of the softer h-AlN phase in the coatings. There was also another possibility coating hardness induced by the formation of the softer h‐AlN phase in the coatings. There was also that a lubricated WO wasWO formed by the was trio-oxidation ofthe WC-Co substratesof after the 3 tribo-film another possibility that a lubricated 3 tribo‐film formed by trio‐oxidation WC‐Co coatings wore out. This possibility will be discussed later. substrates after the coatings wore out. This possibility will be discussed later. ◦C
(a)
(b)
Figure 10. Friction coefficient curves of AlCrN coatings deposited at different charge voltages under Figure 10. Friction coefficient curves of AlCrN coatings deposited at different charge voltages under (a) 600 °C and (b) 800 °C. (a) 600 ◦ C and (b) 800 ◦ C.
Figure 11 shows the 2D cross‐sectional profiles of the wear tracks of the AlCrN coatings. It is observed that there were grooves with different depths on the wear tracks of the AlCrN coatings after wear tests. The depths of the wear tracks were different depending on the coating parameters and test temperatures. To clarify this point, the wear rates (W, ×10−7 mm3/N∙m) of the coatings were calculated and are shown in Figure 12. It can be seen that the wear rates at 600 °C and 800 °C exhibited
Coatings 2017, 7, 216
11 of 16
Figure 11 shows the 2D cross-sectional profiles of the wear tracks of the AlCrN coatings. It is observed that there were grooves with different depths on the wear tracks of the AlCrN coatings after wear tests. The depths of the wear tracks were different depending on the coating parameters and test temperatures. To clarify this point, the wear rates (W, ×10−7 mm3 /N·m) of the coatings were calculated and are shown in Figure 12. It can be seen that the wear rates at 600 ◦ C and 800 ◦ C exhibited similar changes with the increase in charge voltage. The coatings experienced more severe wear at 800 ◦ C than that at 600 ◦ C. The wear rates are lower in the coatings that were deposited at 400 V and 450 V, compared to the other deposition parameters. The lowest wear rates of 7.7 × 10⁻⁶ mm3 /N·m and 11.2 × 10⁻⁶ mm3 /N·m were observed at 600 ◦ C and 800 ◦ C, respectively. The coatings deposited at charge voltages of 400 V and 450 V possessed higher hardness than the other coatings (Figure 6). This is likely to be the reason for their lower wear rates. At 800 ◦ C, the oxidation of the coatings and the softening of the substrates should occur to a greater degree compared to the coatings tested at Coatings 2017, 7, 216 600 ◦ C. Therefore, these coatings experienced more severe wear compared to those tested at 600 ◦ C. Coatings 2017, 7, 216
(a) (a)
(b) (b)
Figure 11. The 2D profile curves of the wear tracks for AlCrN coatings after wear tests under (a) 600 °C
Figure 11. The 2D profile curves of the wear tracks for AlCrN coatings after wear tests under (a) 600 ◦ C Figure 11. The 2D profile curves of the wear tracks for AlCrN coatings after wear tests under (a) 600 °C and (b) 800 °C. and (b) 800 ◦ C. and (b) 800 °C.
Figure 12. The wear rates of AlCrN coatings deposited at different charge voltages in the pin‐on‐disk wear tests at 600 °C and 800 °C.
Figure 12. The wear rates of AlCrN coatings deposited at different charge voltages in the pin‐on‐disk Figure 12. The wear rates of AlCrN coatings deposited at different charge voltages in the pin-on-disk To clarify the wear products on the AlCrN coatings, the wear tracks were analyzed using both wear tests at 600 °C and 800 °C. wear tests at 600 ◦ C and 800 ◦ C. SEM/EDX and XPS. Figure 13 shows the typical worn surface of the coating deposited at 450 V after wear tests at 800 °C. The wear tests of the other coatings deposited at 350–500 V are similar to this To clarify the wear products on the AlCrN coatings, the wear tracks were analyzed using both one. In Figure 13, it can be seen that the coating surface can be divided into an intact surface (A zone SEM/EDX and XPS. Figure 13 shows the typical worn surface of the coating deposited at 450 V after in Figure 13) and a worn surface (B zone in Figure 13). On both the intact coating surface and on the wear tests at 800 °C. The wear tests of the other coatings deposited at 350–500 V are similar to this wear track, there exhibits an AlCrN based EDX spectrum, which suggests only mild wear by partial one. In Figure 13, it can be seen that the coating surface can be divided into an intact surface (A zone tribo‐oxidation. To identify the oxide species on both the wear tracks, the specimens were analyzed in Figure 13) and a worn surface (B zone in Figure 13). On both the intact coating surface and on the further using XPS. wear track, there exhibits an AlCrN based EDX spectrum, which suggests only mild wear by partial The results of the detailed XPS analysis in the wear tracks are shown in Figure 14. The Cr 2p peaks tribo‐oxidation. To identify the oxide species on both the wear tracks, the specimens were analyzed acquired in the 600 °C wear track fit well with chromium nitrides (Cr2N 574.2 eV and CrN 575.3 eV),
Coatings 2017, 7, 216
12 of 16
To clarify the wear products on the AlCrN coatings, the wear tracks were analyzed using both SEM/EDX and XPS. Figure 13 shows the typical worn surface of the coating deposited at 450 V after wear tests at 800 ◦ C. The wear tests of the other coatings deposited at 350–500 V are similar to this one. In Figure 13, it can be seen that the coating surface can be divided into an intact surface (A zone in Figure 13) and a worn surface (B zone in Figure 13). On both the intact coating surface and on the wear track, there exhibits an AlCrN based EDX spectrum, which suggests only mild wear by partial tribo-oxidation. To identify the oxide species on both the wear tracks, the specimens were analyzed further using XPS. The results of the detailed XPS analysis in the wear tracks are shown in Figure 14. The Cr 2p peaks acquired in the 600 ◦ C wear track fit well with chromium nitrides (Cr2 N 574.2 eV and CrN 575.3 eV), whereas the peaks shift to chromium oxide (Cr2 O3 577.4 eV) in the 800 ◦ C specimen. A similar shift from AlN (73.5 eV) to Al2 O3 (75.2 eV) appeared in the Al 2p peak, as shown in Figure 14b. In Figure 14c,d, the O 1s peak is substantially higher and the N 1s peak has become marginal in the 800 ◦ C wear track as compared to that in the 600 ◦ C specimen. The XPS analyses confirmed that the coatings in the wear tracks after wear tests at 800 ◦ C were more oxidized by tribo-oxidation than those after wear tests at 600 ◦ C. More Al2 O3 and Cr2 O3 formed while less AlN and CrN species were left on the worn surface in 800 ◦ C test. No other species were found. Therefore, the AlCrN coatings were subjected to oxidization into Al2 O3 and Cr2 O3 during high-temperature wear tests. Tribo-oxidation occurred similarly for the coatings deposited at various charge voltages and exhibited similar friction coefficients, except for the coatings deposited at 550 V. The wear tracks on the AlCrN coatings deposited at 550 V are shown in Figure 15. Unlike the EDX analyses presented in Figure 13, these wear tracks show substantial amounts of W, Co and O, indicating the exposure of the WC based substrate and its tribo-oxidation. In addition, the depth of the wear tracks exceeds the thickness of the AlCrN coating (Figure 11), which indicates that the coating was totally worn out during the wear process. It has been reported that the tribo-oxidation of a WC substrate resulted in the formation of a lubricious Magnéli phase WO3 [37], which resulted in the low friction coefficients seen in Figure 10. Coatings 2017, 7, 216
(b)
(a)
(c)
Figure 13. SEM image of wear track (a) and the corresponding energy‐dispersive X‐ray spectrometer Figure 13. SEM image of wear track (a) and the corresponding energy-dispersive X-ray spectrometer (EDX) results of the intact surface in “A” (b) and the worn surface in “B” (c) on the AlCrN coatings (EDX) results of the intact surface in “A” (b) and the worn surface in “B” (c) on the AlCrN coatings deposited at 450 V charge voltage after the pin-on-disk wear tests at 800 ◦ C. deposited at 450 V charge voltage after the pin‐on‐disk wear tests at 800 °C.
(a)
(c)
Figure 13. SEM image of wear track (a) and the corresponding energy‐dispersive X‐ray spectrometer (EDX) results of the intact surface in “A” (b) and the worn surface in “B” (c) on the AlCrN coatings Coatings 2017, 7, 216 13 of 16 deposited at 450 V charge voltage after the pin‐on‐disk wear tests at 800 °C.
(a)
(b)
(c)
(d)
Figure 14. Detailed core level XPS spectra on the worn surface of the AlCrN coatings deposited at 450 V Figure 14. Detailed core level XPS spectra on the worn surface of the AlCrN coatings deposited at charge voltage after the pin‐on‐disk wear tests at 600 °C and 800 °C: (a) Cr 2p; (b) Al 2p; (c) O 1s; (d) N 1s. 450 V charge voltage after the pin-on-disk wear tests at 600 ◦ C and 800 ◦ C: (a) Cr 2p; (b) Al 2p; (c) O 1s; (d) N 1s.
Coatings 2017, 7, 216 The wear tracks on the AlCrN coatings deposited at 550 V are shown in Figure 15. Unlike the
EDX analyses presented in Figure 13, these wear tracks show substantial amounts of W, Co and O, indicating the exposure of the WC based substrate and its tribo‐oxidation. In addition, the depth of the wear tracks exceeds the thickness of the AlCrN coating (Figure 11), which indicates that the coating was totally worn out during the wear process. It has been reported that the tribo‐oxidation of a WC substrate resulted in the formation of a lubricious Magnéli phase WO3 [37], which resulted in the low friction coefficients seen in Figure 10.
(a)
(b)
(c)
(d)
Figure 15. SEM images of wear tracks on the AlCrN coatings deposited at 550 V charge voltage after Figure 15. SEM images of wear tracks on the AlCrN coatings deposited at 550 V charge voltage after the pin‐on‐disk wear tests at (a) 600 °C and (b) 800 °C, (c) and (d) show the EDX results on the wear the pin-on-disk wear tests at (a) 600 ◦ C and (b) 800 ◦ C, (c) and (d) show the EDX results on the wear tracks in (a) and (b), respectively. tracks in (a) and (b), respectively.
4. Conclusions Five AlCrN coatings were deposited using MPPMS with varying charge voltages applied to the AlCr targets. All the AlCrN coatings exhibited a dense columnar microstructure. The main phase in the AlCrN coatings was the c‐(Al, Cr)N solid solution phase with a NaCl‐type structure. A h‐AlN phase appeared in the coatings when the charge voltage was higher than 500 V. The hardness of the AlCrN coatings was also influenced by charge voltages. The hardness values increased from 24.9 GPa
Coatings 2017, 7, 216
14 of 16
4. Conclusions Five AlCrN coatings were deposited using MPPMS with varying charge voltages applied to the AlCr targets. All the AlCrN coatings exhibited a dense columnar microstructure. The main phase in the AlCrN coatings was the c-(Al, Cr)N solid solution phase with a NaCl-type structure. A h-AlN phase appeared in the coatings when the charge voltage was higher than 500 V. The hardness of the AlCrN coatings was also influenced by charge voltages. The hardness values increased from 24.9 GPa at charge voltage of 350 V to 30.8 GPa at 450 V, and then decreased to 20.6 GPa at 550 V. During vacuum annealing at temperatures below 800 ◦ C, no remarkable difference was observed in the coating structure or in the mechanical properties. When the annealing temperature increased to 1000 ◦ C, grain growth and the formation of h-AlN and Cr2 N phases occurred in the coatings. Correspondingly, the hardness visibly decreased for all the coatings. The friction coefficients and wear rates of the coatings against Al2 O3 balls exhibited a dependence on both the charge voltage during coating deposition and the temperature of the wear test. The reasons for this are related to the microstructure, phase structure and hardness of the coatings as functions of the charge voltage. Acknowledgments: The authors acknowledge the financial supports of the NSFC projects (51522502), CAST Foundation (X07-066), and Guangdong Natural Science Funds (2014A030311002, 2016A050502056). Author Contributions: Qimin Wang conceived and designed the experiments; Jun Zheng and Hui Zhou performed the experiments; Quanshun Luo and Binhua Gui analyzed the data; Jun Zheng contributed reagents/materials/analysis tools; Qimin Wang and Haixu Li wrote the paper. Conflicts of Interest: The authors declare no conflict of interest. The founding sponsors had no role in the design of the study; in the collection, analyses, or interpretation of data; in the writing of the manuscript, and in the decision to publish the results.
References 1. 2.
3.
4. 5. 6.
7. 8.
9. 10.
Sarakinos, K.; Alami, J.; Konstantinidis, S. High power pulsed magnetron sputtering: A review on scientific and engineering state of the art. Surf. Coat. Technol. 2010, 204, 1661–1684. [CrossRef] Ehiasarian, A.P.; Hovsepian, P.E.; Hultman, L.; Helmersson, U. Comparison of microstructure and mechanical properties of chromium nitride-based coatings deposited by high power impulse magnetron sputtering and by the combined steered cathodic arc/unbalanced magnetron technique. Thin Solid Films 2004, 457, 270–277. [CrossRef] Reinhard, C.; Ehiasarian, A.P.; Hovsepian, P.E. CrN/NbN superlattice structured coatings with enhanced corrosion resistance achieved by high power impulse magnetron sputtering interface pre-treatment. Thin Solid Films 2007, 515, 3685–3692. [CrossRef] Anders, A. Discharge physics of high power impulse magnetron sputtering. Surf. Coat. Technol. 2011, 205, S1–S9. [CrossRef] Lin, J.; Sproul, W.D.; Moore, J.J.; Wu, Z. Recent advances in modulated pulsed power magnetron sputtering for surface engineering. JOM J. Miner. Met. Mater. Soc. 2011, 63, 48–58. [CrossRef] Lin, J.; Zhang, N.; Sproul, W.D.; Moore, J.J. A comparison of the oxidation behavior of CrN films deposited using continuous dc, pulsed dc and modulated pulsed power magnetron sputtering. Surf. Coat. Technol. 2012, 206, 3283–3290. [CrossRef] Lin, J.; Moore, J.J.; Sproul, W.D.; Mishra, B.; Wu, Z. Modulated pulse power sputtered chromium coatings. Thin Solid Films 2009, 518, 1566–1570. [CrossRef] Lin, J.; Sproul, W.D.; Moore, J.J.; Chistyakov, R.; Avraham, B. Structurally laminated CrN films deposited by multi pulse modulated pulsed power magnetron sputtering. Surf. Coat. Technol. 2011, 207, 1780–1786. [CrossRef] Li, H.; Liu, Y.; Jiang, B.; Kan, J.; Liu, Z. The structure and toughness of TiN coatings prepared by modulated pulsed power magnetron sputtering. Vacuum 2016, 125, 165–169. [CrossRef] Papa, F.; Gerdes, H.; Bandorf, R.; Ehiasarian, A.P. Deposition rate characteristics for steady state high power impulse magnetron sputtering (HIPIMS) discharges generated with a modulated pulsed power (MPP) generator. Thin Solid Films 2011, 520, 1559–1563. [CrossRef]
Coatings 2017, 7, 216
11.
12. 13.
14. 15. 16.
17.
18.
19.
20. 21. 22.
23. 24. 25. 26.
27.
28.
29.
30.
15 of 16
Lin, J.; Zhang, Z.; Wu, Z.; Sproul, W.D.; Kaufman, M. Thick CrN/AlN superlattice coatings deposited by the hybrid modulated pulsed power and pulsed dc magnetron sputtering. Surf. Coat. Technol. 2013, 228, 601–606. [CrossRef] Myers, S.; Lin, J.; Souza, R.M.; Sproul, W.D.; Moore, J.J. The β to α phase transition of tantalum coatings deposited by modulated pulsed power magnetron sputtering. Surf. Coat. Technol. 2013, 214, 38–45. [CrossRef] Liebig, B.; Braithwaite, N.S.J.; Kelly, P.J.; Chistyakov, R.; Abraham, B.; Bradley, J.W. Time-resolved plasma characterization of modulated pulsed power magnetron sputtering of chromium. Surf. Coat. Technol. 2011, 205, S312–S316. [CrossRef] Wang, Q.M.; Kwon, S.H.; Hui, K.N.; Kim, D.I.; Hui, K.S. Synthesis and properties of crystalline TiO2 films deposited by a HIPIMS+ technique. Vacuum 2013, 89, 90–95. [CrossRef] Birol, Y.; Isler, D. Abrasive wear performance of AlCrN-coated hot work tool steel at elevated temperatures under three-body regime. Wear 2011, 270, 281–286. [CrossRef] Sánchez-López, J.C.; Contreras, A.; Domínguez-Meister, S.; García-Luis, A.; Brizuela, M. Tribological behavior at high temperature of hard CrAlN coatings doped with Y or Zr. Thin Solid Films 2014, 550, 413–420. [CrossRef] Walker, J.C.; Ross, I.M.; Reinhard, C.; Rainforth, W.M.; Hovsepian, P.E. High temperature tribological performance of CrAlYN/CrN nanoscale multilayer coatings deposited on γ-TiAl. Wear 2009, 267, 965–975. [CrossRef] Fox-Rabinovich, G.S.; Beake, B.D.; Endrino, J.L.; Veldhuis, S.C.; Parkinson, R. Effect of mechanical properties measured at room and elevated temperatures on the wear resistance of cutting tools with TiAlN and AlCrN coatings. Surf. Coat. Technol. 2006, 200, 5738–5742. [CrossRef] Magai, M.; Yukimura, K.; Kuze, E.; Maruyama, T.; Kohata, M. Macroparticles on titanium nitride thin film prepared by cathodic-arc plasma-based ion implantation and deposition. Surf. Coat. Technol. 2003, 169, 401–404. Kumar, C.S.; Patel, S.K. Hard machining performance of PVD AlCrN coated Al2 O3 /TiCN ceramic inserts as a function of thin film thickness. Ceram. Int. 2017, 43, 13314–13329. [CrossRef] Kim, G.S.; Lee, S.Y. Microstructure and mechanical properties of AlCrN films deposited by CFUBMS. Surf. Coat. Technol. 2006, 201, 4361–4366. [CrossRef] Hsiao, Y.C.; Lee, J.W.; Yang, Y.C.; Lou, B.S. Effects of duty cycle and pulse frequency on the fabrication of AlCrN thin films deposited by high power impulse magnetron sputtering. Thin Solid Films 2013, 549, 281–291. [CrossRef] Bzin, K.; Brögelmann, T.; Brugnara, R.H. Aluminum-rich HPPMS (Cr1−x Alx )N coatings deposited with different target compositions and at various pulse lengths. Vacuum 2015, 122, 201–207. [CrossRef] Christie, D.J. Target material pathways model for high power pulsed magnetron sputtering. J. Vac. Sci. Technol. A 2005, 23, 330–335. [CrossRef] Berg, S.; Nyberg, T. Fundamental understanding and modeling of reactive sputtering processes. Thin Solid Films 2005, 476, 215–230. [CrossRef] Bagcivan, N.; Bobzin, K.; Theiß, S. (Cr1−x Alx )N: A comparison of direct current, middle frequency pulsed and high power pulsed magnetron sputtering for injection molding components. Thin Solid Films 2013, 528, 180–186. [CrossRef] Paulitsch, J.; Mayrhofer, P.; Münz, W.D.; Schenkel, M. Structure and mechanical properties of CrN/TiN multilayer coatings prepared by a combined HIPIMS/UBMS deposition technique. Thin Solid Films 2008, 517, 1239–1244. [CrossRef] Petrov, I.; Hultman, L.; Sundgren, J.E.; Greene, J.E. Polycrystalline TiN films deposited by reactive bias magnetron sputtering: Effects of ion bombardment on resputtering rates, film composition, and microstructure. J. Vac. Sci. Technol. A 1992, 10, 265–272. [CrossRef] Luo, Q.; Lewis, D.B.; Hovsepian, P.E.; Münz, W.D. Transmission electron microscopy and X-ray diffraction investigation of the microstructure of nano-scale multilayers TiAlN/VN grown by unbalanced magnetron deposition. J. Mater. Res. 2004, 19, 1093–1104. [CrossRef] Lewis, D.B.; Luo, Q.; Zhou, Z.; Hovsepian, P.E.; Münz, W.D. Interrelationship between atomic species, bias voltage, texture and microstructure of nano-scale multilayers. Surf. Coat. Technol. 2004, 184, 225–232. [CrossRef]
Coatings 2017, 7, 216
31. 32. 33. 34. 35. 36. 37.
16 of 16
Williamson, G.K.; Hall, W.H. X-ray line broadening from filed aluminium and wolfram. Acta Metall. 1953, 1, 22–31. [CrossRef] Petrov, I.; Barna, P.B.; Hultman, L.; Greene, J.E. Microstructural evolution during film growth. J. Vac. Sci. Technol. A 2003, 21, 117–128. [CrossRef] Feng, Y.P.; Zhang, L.; Ke, R.X.; Wan, Q.L.; Wang, Z.; Lu, Z.H. Thermal stability and oxidation behavior of AlTiN, AlCrN and AlCrSiWN coatings. Int. J. Refract. Met. Hard Mater. 2014, 43, 241–249. [CrossRef] Lin, J.; Mishra, B.; Moore, J.J.; Sproul, W.D. A study of the oxidation behavior of CrN and CrAlN thin films in air using DSC and TGA analysis. Surf. Coat. Technol. 2008, 202, 3272–3283. [CrossRef] Luo, Q. Origin of friction in running-in sliding wear of nitride coatings. Tribol. Lett. 2010, 37, 529–539. [CrossRef] Kong, D.J.; Guo, H.Y. Friction-wear behaviors of cathodic arc ion plating AlTiN coatings at high temperatures. Tribol. Int. 2015, 88, 31–39. Gassner, G.; Mayrhofer, P.H.; Kutschej, K.; Mitterer, C.; Kathrein, M. Magnéli phase formation of PVD Mo-N and W-N coatings. Surf. Coat. Technol. 2006, 201, 3335–3341. [CrossRef] © 2017 by the authors. Licensee MDPI, Basel, Switzerland. This article is an open access article distributed under the terms and conditions of the Creative Commons Attribution (CC BY) license (http://creativecommons.org/licenses/by/4.0/).