the influence of Cr addition to a Fe-28%A1 alloy, and specifically examining the influence of this alloying addition on the state of order and microstructure.
Acta metall, mater. Wol. 41, No. 1, pp. 97-111, 1993
0956-7151/93 $5.00 + 0.00 Copyright © 1992 Pergamon Press Ltd
Printed in Great Britain. All rights reserved
THE I N F L U E N C E OF Cr A D D I T I O N ON THE O R D E R E D MICROSTRUCTURE A N D D E F O R M A T I O N A N D F R A C T U R E BEHAVIOUR OF A Fe-28%A1 INTERMETALLIC D. G. MORRIS, M. M. DADRAS and M. A. MORRIS Institute of Structural Metallurgy, University of Neuch~.tel, 2000 Neuchfitel, Switzerland (Received 27 April 1992; in revisedform 1 July 1992) Abstract--Samples of Fe-28%A1 and Fe-28%AI-4%Cr were recrystallized, and heat treated at 500°C to obtain B2 and DO 3 ordering. While the material containing Cr was well ordered, the other material showed a two-phase ordered plus disordered microstructure with the degree of ordering, the domain size and the fraction of disordered phase depending sensitively on the experimental conditions. The material containing Cr was relatively soft, showed low work hardening and was fairly ductile: these properties are obtained by the ready movement of superdislocations. The other material was stronger and generally less ductile: these properties depended on whether single dislocations were present leaving APB trails and leading to low work hardening rates, or whether loosely-coupled superdislocations moved through a two-phase microstructure at a lower stress and with higher work hardening rates. This study emphasizes the need for complete microstructural characterization in order to understand the mechanical behaviour of such materials. R6sum6---Des 6chantillons de Fe-28% A1 et de Fe-28% A1-4% Cr sont recristallis6s et chauff6s fi 500°C pour obtenir les ordres B2 et DO 3. Tandis que le mat6riau contenant du Crest bien ordonn6, l'autre montre une microstructure biphas~e ordonn6e et d6sordonn6e avec le degr6 d'ordre, la taille de domaines et la fraction de phase d6sordonn6e qui d6pendent fortement des conditions exp~rimentales. Le mat6riau contenant du Crest relativement doux, il montre une faible 6crouissage et est tr6s ductile: ce propri6t6s sont obtenues par le mouvement facile des superdislocations. L'autre mat~riau est plus r6sistant et g6n6ralement moins ductile: ces propri&6s s'expliquent soit par le fait que des dislocations simples sont pr6sentes, laissant un sillage de parois d'antiphase et conduisant fi de faibles taux d'6crouissage, soit que des superdislocations peu coupl6es se d6placent dans la microstructure biphas6e pour des contraintes plus basses et avec des taux d'6crouissage plus ~lev6s. Cette 6tude montre la n6cessit6 d'une caract6risation compl6te de la microstructure afin de comprendre le comportement m6canique de mat6riaux complexes comme ceux-ci. Zusammenfassung--Proben von F e ~ 8 % AI und Fe-28% AI-4% Cr werden bei 500°C rekristallisiert und w/irmebehandelt bei, um B2- und DO-Ordnung zu erzeugen. Das Cr-haltige Material ist gut geordnet, das andere Material zeigt eine zweiphasig geordnete und eine entordnete Mikrostruktur, wobei der Ordnungsgrad, die Dom/inengrrBe und der Anteil der entordneten Phase empfindlich yon den experimentellen Bedingungn abh/ingen. Des Cr-haltige Material ist vergleichsweise weich, zeigt gering Verfestigung und ist hinreichend duktil: diese Eigenschaften ergeben sich aus der leichten Beweglichkeit der Superversetzungen. Das andere Material ist fester und im allgemeinen weniger duktil: diese Eigenschaften h/ingen davon ab, ob einzelne Versetzungen vorhanden sind, Spuren aus Antiphasengrenzen hinterlassen and zu einer geringen Verfestigungsrate fiihren, oder ob schwach gekoppelte Superversetzungen sich bei niedregerer Spannung, aber hrherer Verfestigungsrate dutch eine zweiphasige Mikrostruktur bewegen. Die vorliegende Untersuchung best/irkt die Notwendigkeit, dab die Mikrostruktur vollstfindig charakterisiert werden muB, wenn das mechanische Verhalten solcher komplexer Naterialien verstanden werden soll.
INTRODUCTION
have reasonably good strengths at both r o o m temperature and at elevated temperatures, they are generally rather brittle at r o o m temperature, however, and have found limited usage to date. The phase diagram is fairly complex at the Fe end of the composition range, with disordered ~tFe found at high temperatures, transforming at temperatures of about 750-950°C to the B2 structure for alloys containing about 25-30%A1 (throughout this paper the compositions are given in at.%), and ordering again to the D03 structure at about 550°C [3-8]. The phase diagram is made even more complex in the
Intermetallic materials at the Fe-rich side of the Fe-A1 phase diagram are known to have good oxidation and corrosion resistance and are being examined for engineering applications as replacements for stainless steels for use ~t r o o m temperature and elevated temperatures. The properties of materials based on the B2 ordered structure FeAI and on the D03 ordered structure Fe3A1, as well as advances made in the fabrication of these materials, have recently been reviewed [1, 2]. While these materials 97
98
MORRIS et al.: Cr ADDITION TO A Fe-AI INTERMETALLIC
composition range about 23-30%A1 by the interaction of the Curie temperature line with the B2-D03 ordering change. There has been considerable discrepancy between the reports of the various investigators, including differences due to real equilibrium or to metastability due to difficulties of nucleation of various phases, and other differences that suggest that phase changes may be sensitive to impurities or chemical inhomogeneities. Of particular relevance to the present study, we may note [5-8] and the ordering change ~Fe-B2 is generally a second order phase change, ordering taking place continuously with no two-phase region separating the ~ Fe field and the B2 field; the B2-D03 change is also a second order phase change with no two-phase region separating the two fields; the B2 ordered material containing about 23-27%A1 (namely the B2 phase which becomes ferromagnetic during cooling) will decompose into Fe and Al-richer B2 phase before this transforms to the D03 state. As shown by Allen and Cahn [7, 8], the changes occurring when an alloy of 23-27%A1 is cooled from the ctFe state or the single phase B2 state to temperatures of about 500°C, that is just below the B2-D03 phase line, will depend on the precise composition and temperature conditions and may involve spinodal decomposition, continuous ordering or discontinuous ordering by nucleation and growth. The mechanical properties of binary alloys of composition near FeaA1 were examined long ago (e.g. [9]). and the alloys shown to be fairly strong but somewhat brittle. The deformation behaviour was examined in detail on both single crystals and polycrystals for alloys having both the B2 and the D03 structures by Leamy et al. [10-12]. Stress-strain curves were often characterised by several linear work hardening stages which were interpreted in terms of dislocation loop nucleation and dislocation propagation for dislocations and superdislocations of various types. For a well-ordered D03 crystal the superdislocations are composed of four partial dislocations, each of Burgers vector 1(111) corresponding to a dislocation from the disordered ~tFe crystal, with two APB fault types corresponding to B2 and DO3 faulting linking the partial dislocations (in the present discussion the reference crystal is that of the D03 supercell). For a well-ordered B2 crystal the superdislocations are composed of two partial dislocations, each of Burgers vector ~(111) separated by a B2 APB fault [13]. Each of the linear work hardening stages found by Leamy et al. [10-12] was explained by the operation of a specific dislocation type, for example at low stresses by a perfect D03 superdislocation (4 partials), at higher stresses by a dissociated superdislocation (2 partials) trailing a D03 fault, and at even higher stresses by a dissociated superdislocation (1 partial) trailing a B2 fault. Similar results have been reported more recently by Mendiratta et al. [14] on two alloys with compositions on different sides of Fe3A1 stoichiometry.
Fracture of Fe3AI materials normally takes place by mixed intergranular and cleavage failure [14, 15]. Kerr [15] showed that improved ductility could be obtained by avoiding interstitial carbon, and that this also tended to avoid the intergranular failure mode. However, the materials remained relatively brittle in tension due to inherent easy cleavage failure behaviour of the ordered alloys. Two recent sets of experiments have suggested that improved ductility can be achieved and has led to a renewed interest in Fe3A1 based alloys as engineering materials. Firstly, as a result of a wide programme examining alloying additions to the Fe3A1 base [1, 16], it was discovered that additions of 2~5% Cr to a base alloy of composition Fe-28%AI led to significant improvements in tensile ductility. Other various experiments [17-20] have shown that environmental factors may embrittle these FexA1 intermetallics and avoiding such environmental attack can lead to improved ductility: this school of thought argues that water vapour in the atmosphere leads to oxidation of fresh metal surface at a crack tip leading to local hydrogen injection and embrittlement. The first results [16] were interpreted as an effect of the Cr solute which reduced the APB energy, increased the separation of the partial dislocations of the superdislocations, and allowed easier cross slip which made cleavage failure processes more difficult. At a later stage, these same results were reinterpreted [17] as an environmental effect with the Cr solute acting to inhibit chemical attack. A curious aspect of these later tests was that the material containing Cr was more ductile in the as-received state (following mild oxidation during fabrication and heat treatments) but could not retain its ductility when in a cleaned state
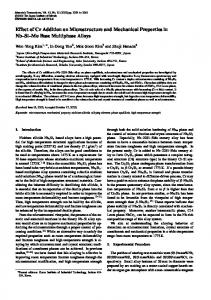
Fig. 1. Electron micrograph taken in dark field using the I 11 superlattice reflection showing DO3 domain boundaries in ordered Fe-AI-Cr.
MORRIS et al.: Cr ADDITION TO A Fe-AI INTERMETALLIC (electropolished to remove surface oxide). The present study began with the precise aim of re-examining the influence of Cr addition to a Fe-28%A1 alloy, and specifically examining the influence of this alloying addition on the state of order and microstructure following ordering treatments and the deformation behaviour of both alloys and dislocation mechanisms involved. EXPERIMENTAL The material used was kindly supplied by Oak Ridge National Laboratories,T in the form of sheet about 0.8 mm thick. Two materials were supplied, of compositions Fe-28% AI and Fe-28%A1--4%Cr. The binary alloy also contained 1% of TiB2, in the form of fine inclusions or dispersoid particles, which had been added as grain refiner. These materials were prepared by arc-melting and drop casting, followed by hot rolling between 1100 and 650°C, and were supplied in a slightly oxidised form covered with "bronze-coloured" oxide [16, 17]. Samples for recrystallization studies and for tensile testing were cut from these sheets by spark machining. The tensile samples had gauge dimensions of 3 mm width and 16 mm length, and were about 0.7 mm in thickness following mild abrasion to remove the oxide coating and electropolishing. Recrystallization studies were carried out on small pieces of sheet by heating under argon in muffle furnaces, for temperatures up to l l00°C, and in sealed quartz tubes under argon for higher temperature treatments. The progress of recrystallization was followed by optical metallography after etching the polished surfaces using a solution of 80% H20, 12% HC1, 6% HNO3 and 2% HF. Tensile samples were heat treated for recrystallization using the selected treatments, heat treated to achieve suitable ordering, and then electropolished using a 30% nitric acid-acetic acid mixture at about - 2 5 ° C and 5V. Ordering was carried out for both alloys by [16] annealing for 15 min at 850°C, cooling to room temperature, and reheating to 500°C for 1 week before finally air cooling. The treatment at 850°C is designed to create B2 order with a large domain size, and the treatment at 500°C to create D03 order [16]. Tensile testing was carried out at room temperature on a Schenck universal testing machine at a strain rate of l x 10-4/s. Most of the tests were carried out under ordinary atmosphere, and a few were also attempted at room temperature under flowing argon to test for the possible influence of chemical environment. Fracture surfaces were examined by scanning electron microscopy using a Cambridge Stereoscan 360 microscope. Thin foil samples were prepared from the heads of tensile samples to examine the state tKindly supplied by Dr C. T. Liu and Ms C. G. McKamey, ORNL.
99
of order and domain wall configurations in the annealed materials, and from the gauge lengths of deformed samples to examine dislocation configurations. These thin foil samples were prepared by electropolishing in a Tenupol twin jet system using a solution of one part HNO 3 and four parts methanol at about - 3 0 ° C and 8 V. Transmission electron microscope examinations were carried out using a Philips CM12 instrument operating at 120 kV. This instrument was equipped with an EDAX PV9800 system for local chemical analysis of thin foils. The average state of order of heat treated samples was examined by X-ray diffraction using a Philips MPD 1880 diffractometer with monochromatised CuK~ radiation. RESULTS Recrystallization study Recrystallization heat treatments were initially intended to achieve a wide variation of grain size and to examine the influence of this parameter on the subsequent mechanical behaviour. For the F e - A I - C r alloy, recrystallization took place quickly at rather low temperatures and it was not possible to find a set of time-temperature conditions that gave very small grain sizes. The shortest time used (10-15 min) was
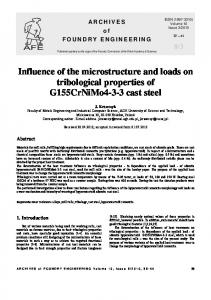
Fig. 2. Dark field electron micrographs taken using (a) 111 g vector, and (b) 200 g vector, showing domain boundaries in a Fe-A1 material.
100
MORRIS et al.: Cr ADDITION TO A Fe-AI INTERMETALLIC
determined by the heating time of the thin strip samples in the muffle furnace, and the lowest temperature used (750-850°C) was limited by the requirement for grain boundary stability during the subsequent ordering treatment at 850°C. For this alloy the grain sizes were varied in the range 90-230 #m. The behaviour of the Fe-AI alloy was very different because of the dispersed TiB 2 particles. Recrystallization did not occur in reasonable times at tempera-
tures below 1000°C, which would seem to imply a different driving force for recrystallization retained from the prior warm rolling. At temperatures of 1100-1300°C, recrystallization took place in times of the order of a few hours to give grain sizes in the range 45-100/~m. On annealing for longer times at the higher temperatures secondary recrystallization was seen, with occasional large grains covering the entire strip thickness or width. This observation implies that TiB2 particle dissolution
Fig. 3. Dark field micrographs (generally 111 g vector) showing domain boundaries and disordered walls
in Fe-Al. Materials are charaeterised by the conditions of recrystallization and the degree of order: (a) 2 h at 1100°C, 0.6; (b) 4 h at 1250°C, 0.6; (c) 7 h at 1200°C, 0.75; (d) 4 h at 1250°C, 0.75; (e) 2 h at 1100°C, 0.87; (f) 4h at 1250°C, 0.87.
MORRIS et al.: Cr ADDITION TO A Fe-AI INTERMETALLIC
i
101
AI sites of ordered Fe3AI were fully occupied by A! atoms with the excess (3%) A1 and Cr sitting randomly on the remaining Fe sites. In some cases, where a two-phase ordered-plus-disordered microstructure was observed by TEM, the superlattice intensity was considered to arise only from the ordered volume fraction and the order parameter was calculated accordingly. Figure 1 illustrates the domain structure of the ordered Fe-Al~Er alloy when imaged using a superlattice reflection of the D03 lattice. In this image the curved domain boundaries are the grown-in faults of the D03 lattice [13] and the straight line faults are those produced by the motion of accidental dislocations. Imaging using a superlattice reflection of the B2 lattice led to invisibility of all the faults shown, confirming that the size of the B2 domains was very large ( > 5-10/~m), possibly as large as the grain size. For all the Fe-A1-Cr materials, irrespective of the grain size, the same DO3 domain size (about l # m ) and very large B2 domain size was found. The degree of order of this alloy was determined as 0.95, again irrespective of the grain size.
Fig. 4. Diffraction patterns illustrating the state of order of domain interiors. For each material the {001} and {i10} zone axis patterns are shown: (a) recrystallized at 1250°C, order 0.6; (b) recrystallized at 1200°C, order 0.75; (c) recrystallized at 1250°C, order 0,87. is probably occurring at these high temperatures, liberating some of the grain boundaries for such local excessive growth. It should be noted for future reference that the grain sizes used for the study of this material, namely 45, 65, > 80 ~tm, were achieved by the use of temperatures of 1100, 1200, 1250°C, which probably correspond to progressively more and more dissolution of some of the TiB 2 dispersed phase. Ordered microstructures
The state of order of both alloys has been examined by X-ray diffraction to quantify the degree of order, TEM to determine the number and types of antiphase boundaries, selected area and converging beam electron diffraction to estimate the degree of order of specific domain interiors and domain walls, and EDS to seek composition differences between domain interiors and walls. The degree of order was estimated using standard X-ray diffraction techniques [21] by the comparison of integrated peak intensities of superlattice and fundamental peaks from parallel planes to avoid texture effects--for example by a comparison of the 200 and 400 peaks the degree of B2 order can be determined [13]: the determination of the degree of D03 ordering requires the comparison of the 111 peak with the fundamental 444 peak, which was not attainable on the instrument available for studies. In these calculations it was assumed that the
Fig. 5. Converging beam electron diffraction patterns showing {002} diffraction pattern of (a) domain interior; (b) domain wall.
MORRIS et al.: Cr ADDITION TO A Fe-AI INTERMETALLIC
102
7OO 600
" J L " ~ ' ~ mm
i "-
•
Fe-AI
•
re-Al-Cr
500 400
" "
l
'~"
l
i
.--...
300 2O0
Am
lO0 0
i
s
I
$0
0
m
I
I
100 IS0 Grain size ( It m)
200
250
Fig. 8. Yield stress of Fe-AI and F e - A l ~ r samples as a function of the grain size. Fig. 6. High resolution electron micrograph showing ordered atomic planes (200) which remain continuous up to the domain boundary. Sample (a) of Fig. 3. Figure 2 shows the domain structure of one of the highly ordered Fe-A1 materials when imaged using a 111 and a 200 superlattice beam. Imaging using the 111 beam makes both B2 and D03 domain boundaries visible, indicating a domain size of about ½#m, whilst imaging using the 200 beam leaves only the B2 domain boundaries visible, indicating a domain size of about ½/~m. The ordered microstructure of the Fe-AI materials was found to vary from case to case, however, as illustrated in Fig. 3, but was the same irrespective of whether a 111 or a 200 beam was used for contrast. In Fig. 3, the micrographs on the left correspond to materials with small grain sizes (4070 #m) and the micrographs on the right to materials with larger grain sizes (80-100/~m): there is a fairly continuous decrease in the domain size and appearance of thicker domain walls with increase in the recrystallization temperature: this is also illustrated later in Fig. 7 which shows the domain sizes and wall thicknesses in terms of the grain size. The domain wall thickness was measured on areas near the edge of the foil where increases in apparent wall thickness due to domain curvature are minimised. The micrographs at the top and middle of Fig. 3 were obtained
on materials ordered by annealing at 850 and 500°C, as outlined before, and any variations detected, apart from those due to the influences of recrystallization conditions must be explained by minor fluctuations of alloy composition or furnace conditions. The micrographs at the bottom of Fig. 3 were obtained on materials ordered by annealing at 800 and 500°C. The major difference found between materials at the top, middle and bottom of Fig. 3 is the degree of order of the domain interiors, illustrated in Fig. 4 and confirmed by X-ray diffraction. Figure 4 shows examples of diffraction patterns taken from domain interiors of the "top", "middle" and "bottom" materials, which confirmed that these materials were characterised by different order parameters, irrespective of the grain or domain size. The diffraction patterns of Fig. 4 show, incidentally, that B2 and D03 order always go hand in hand, namely that a low degree of B2 order (visible as weak 200 spots in the {001} diffraction pattern) is associated with a low degree of D03 order (visible as weak 111 spots in the { 110} diffraction pattern) as illustrated by the top and by the bottom photographs in Figs 3 and 4. X-ray diffraction on these materials deduced a B2 order parameter of about 0.6 for the poorly ordered materials and about 0.87 for the highly ordered materials; the intermediate materials were deduced to have an order parameter of about 0.75.
700 700
125/40
300/0
i l / n . - - -
160140
160/30 150/25
5OO
~• 5o0 160140
145/25 125130
'
....
I
3000
e...,.o~
25
I
12512515012S I
SO 75 Grain size jam
300 t
100
ZZ;z::
° ~
~400
>'400 2S0/IS
- - ' - n ~ u
6OO
~.....~.÷
•
/
~"
,
125
Fig. 7. Summary of domain sizes (ordered to D03) and thickness of disordered wall (nm/nm) for the Fe-A1 materials examined. These values are plotted against the grain sizes and the yield stresses measured during evaluation of the mechanical properties.
200
0.0
•
i
0.1
.
,
0.2
.
i
.
n
0.3 0.4 Strain (%)
.
t
0.s
.
Io.6,'7o)
•
(o.~6a)
•
(0.TSI~)
4.
(0.87412) , .
0.6
0.7
Fig. 9. Typical stress-strain curves of several Fe-AI samples with different degrees of order and domain structures. Samples are identified (in brackets) by their degree of order and grain size (mm).
MORRIS et al.: Cr ADDITION TO A Fe-AI INTERMETALLIC
.
•
Fe-AI 0 . 1 ~
•
F t ~ d 0.2%
•
Fe-AI 1%
O
F~ A I - C r 0.2%
A
Ft,-Al-~ 1 ~
~z
0
100
"
' 200
"
' 300
"
' 400
"
' 500
"
' 600
" 700
Yield stress (MPa)
Fig. 10. Work hardening rate of Fe-AI and Fe-AI~Cr samples measured at several strains. The domain boundaries shown in Fig. 3 differ from those of Figs 1 and 2 in that there is a well-defined thickness of disordered phase. The disorder was confirmed in several ways, for example by converging beam electron diffraction (Fig. 5) on domain interiors and domain boundaries with an electron beam of about 30 nm size the absence of order in the domain walls was clearly shown. The X-ray spectra of the two phase ordered and disordered materials showed wide fundamental reflection peaks corresponding to two materials of slightly different lattice parameter. For example the 400 fundamental peak showed a broad shoulder corresponding to a second (disordered) phase with lattice parameter about 0.4% larger than that of the ordered D03 phase. Particular attention has been given to the examination of the domain boundaries of the sample at the top left in Fig. 3 to determine whether there exists a disordered phase at the boundaries. Electron diffraction and imaging is not able to provide proof of a disordered layer which, if present, is too thin to be clearly defined. Boundaries in this sample alone can be made invisible by the use of B2 superlattice vectors for contrast, as illustrated already in Fig. 2, suggesting that these boundaries can be described as created by a shear displacement vector with no disordered film present. Figure 6 shows a high resolution electron micrograph of a grown-in domain boundary in the same sample. The fringes seen correspond to the 200 plane in the Fe3A1 crystal. These fringes are seen to be continuous up to and across the domain boundary, confirming that there is no detectable disordered region at the boundary. Across this boundary there is a shear displacement projected onto the {100} plane as ~(100), exactly as would be expected from a B2 type domain fault (shear vector ¼(111)). Analysis of the chemical composition of thin foils from the different materials, and comparison of domain interiors with domain walls, was carried out by EDS examinations. Within the precision of this technique (of the order of 1-2%) there was no difference in composition between different samples, including those with ordered, shear domain walls and those with disordered domain walls, with the AM 41/l--H
103
measured composition Fe-28%A1 corresponding precisely with specifications. A more precise comparison of composition of domain wall and domain interior in the case of samples showing disorder at the domain walls, made using exactly the same electron beam/crystal/detector conditions, also confirmed that there was no chemical difference between domain walls and interiors. Figure 7 summarizes the observations of domain size and wall thickness for all the Fe-AI materials. The data is plotted here as a function of the grain size and the yield stress measured on these materials, and this plot will be useful for later interpretation of the mechanical behaviour. It should be noted that the grain size roughly correlates with the recrystallization temperature used, and the stress axis roughly correlates with the degree of order of the domain interiors, namely 0.87 for the low stresses, 0.75 for the intermediate data, and 0.6 for the highest stress data. M e c h a n i c a l testing
A large number of samples of the Fe-AI and Fe-A1-Cr materials were tested to failure in tension to obtain a good idea of the mechanical behaviour of each alloy in terms of variations in microstructure and grain size. In addition many samples were tested to strains of 1-2% for subsequent analysis of dislocation structures. The Fe-A1 samples were typically rather strong, showing limited tensile ductility before failure. These materials were particularly characterized by large variability of the yield stress, work hardening behaviour and ductility. The Fe-A1-Cr samples were typically softer, showing good tensile ductility before failure. These materials gave reproducible results showing a clear dependence on the grain size. Figure 8 shows the yield stress of the tested materials as related to the grain size. The yield stress of the Fe-A1-Cr samples varies steadily with the grain size, and can be described by the Hall-Petch relationship (with Hall-Petch slope of 325 MPa(#m) 1/2 and intercept corresponding to a single crystal stress of about 50 MPa). For the Fe-AI samples the data
~4 3 2 [-.
I •
o
o
25
• ~
50
75
100 125 ( p. m )
•
Fe-AI
•
Fe-AI-Cr
150
175
Grain size
Fig. l 1. Ductility (total elongation at failure) of Fe--AI and Fe-Al~2r alloys as a function of grain size.
104
MORRIS et al.: Cr ADDITION TO A Fe-A1 INTERMETALLIC varying only slightly with grain size or yield stress. For the Fe-A1 samples, the variation of work hardening rate depends on the strain where comparison is made. At low strains (0.1-0.2%), as yielding occurs and steady deformation begins, there is virtually no variation of work hardening rate with ordered state, grain size or yield stress. At higher strains (0.5-1%), however, the work hardening rate varies significantly with the ordered state or yield stress considered. For materials with high order (low yield stress) the work hardening rate remains high--linear stress-strain curve; for materials with low order (high yield stress) the work hardening rate falls to very low values since the stress-strain curve is "parabolic" in nature. Tensile ductility at failure is shown in Fig. 11. For the Fe-AI-Cr alloy the ductility is high, of the order 4-5%, and may show a slight variation with grain size. The data is too limited and scattered to be certain about the influence of grain size for this material. For the Fe-A1 alloy there was a great scatter in the data, but nevertheless the ductilities obtained can be related to the microstructure and the yield stress or work hardening behaviour. Thus, samples showing very low ductility (less than 1%) were those of low order and parabolic work hardening behaviour where the yield stress was very high. Samples
Fig. 12. Superdislocations seen in Fe AI~Cr alloy deformed to 1% strain: (a) bright field image, zone axis near (112), 2~0 g vector, and (b) weak beam image, zone axis near (112), 2'~0g vector, g: 4-5 g imaging condition.
can be roughly separated into three categories, corresponding to the three levels of order discussed earlier, with essentially no influence of grain size within each category, at least over the small grain size range available for experiments. The work hardening behaviour varied from case to case. For the Fe-AI-Cr samples, as well as for some of the Fe-A1 samples (essentially those of low yield stress), the stress-strain curve was linear from yield essentially up to failure. For most of the Fe-AI samples the stress-strain curve was continuously downwards curved, showing minor differences from sample to sample. Typical stress-strain curves for Fe-A1 samples are shown in Fig. 9, which illustrates the mechanical behaviour of several materials with different order parameters (0.6-0.87) and similar grain sizes (63-82 nm). The work hardening rates measured at specific values of strain are shown in Fig. 10 for both alloys and in all ordered states. The Fe-AI~Cr samples are characterized by near constant work hardening rate, independent of the strain, and
Fig. 13. Grown-in and shear-produced APB faults in Fe-AI-Cr deformed to 1% strain: (a) dark field image, zone axis near (I 12), I 1l"g vector; (b) bright fieldimage, zone axis near (I 12), both 1IT and 2]0 g vectors partially excited.
MORRIS et al.: Cr ADDITION TO A Fe-A1 INTERMETALLIC
105
ductility is not clear, and while lack of specimens prohibited further study, a clear slight effect of testing environment has been distinguished. No tests under controlled environment were performed for the Fe-A! alloy in view of the limited number of specimens available and the large variability already noted for this alloy which makes distinguishing other influences more difficult. Microstructural observations on deformed materials
Fig. 14. Dislocations and shear-produced APB faults in Fe-AI-Cr alloy deformed to 4% strain: (a) dark field image, zone axis near (I 10), II1 g vector; (b) weak beam image, zone axis near (001), 220g vector, g: 4-5g imaging condition.
with a middle level of ductility (in the range 1.5-2.5%) were those of medium to high order, showing medium to low yield stresses and high, near-linear work hardening behaviour. Samples showing highest ductility for the Fe-A1 alloy (about 3.5%) were those of low order and medium-high yield stress with a parabolic work hardening behaviour. Of interest for later discussion, the nominal fracture stress was virtually constant for all the Fe-A1 samples (about 600-650 MPa), and varied continuously with the grain size for the F e - A I - C r samples from about 450 MPa at small grain size to about 350 MPa at large grain size. In considering these fracture stresses it should be noted that slight localised necking will increase the true fracture stress value by an amount approximately related to the ductility--hence a fracture stress of about 650 MPa describes the FeA1 alloy here and a stress considerably above 400 MPa describes the Fe-A1-Cr alloy. Finally, a few comments may be made on tests conducted under argon atmosphere. These tests were carried out on the Fe-A1-Cr alloy with samples of grain size 100-200#m, and gave rise to ductilities of about 3% instead of the 4-5% measured when testing in air. The reason for this fall in apparent
Dislocation structures were typically examined on materials deformed about 1%, and occasionally after higher levels of deformation. Figures 12-14 illustrate dislocations found in F e - A I - C r samples after slight deformation (1%, Figs 12 and 13) and after heavier deformation (4%, Fig. 14). After slight deformation, most of the dislocations are present as coupled D03 superdislocations, that is composed of four partials separated by the two types of ABP fault. From the spacings of these partials it is possible to deduce the APB energies. Already after 1% strain some of the dislocations are separated into two partials (that is to the superdislocation configuration of the B2 structure) trailing an APB fault of the D03 lattice. Figure 12 shows an example of such a dissociated dislocation, and Fig. 13 shows a superdislocation in the process of dissociation, leaving a D03 APB fault behind each dislocation. After heavier strain (4%, Fig. 14) essentially all the dislocations are dissociated into the two-partial configuration and the crystals are laced with a high density of D03 APB faults. The 2-partial dislocations are clearly mobile on their slip planes with frequent changes of line direction and partial spacing. For the Fe-AI samples almost all the dislocations found were single dislocations with little if any sign of coupling as 2-partial or 4-partial superdislocations. Figure 15 illustrates the typical configuration of dislocations in the sample of low order (0.6) with shear type domain boundaries [shown in Fig. 3(a)].
Fig. 15. Planar arrays of loosely coupled single dislocations in slightly deformed Fe-AI sample of low order (0.6) with shear-type grown-in domain wall. Zone axis near (001), g vector 220.
106
MORRIS
et al.:
Cr ADDITION TO A Fe-AI INTERMETALLIC For Fe-A1 samples with an intermediate degree of order (0.75) similar dislocation configurations were seen, Fig. 18, namely single dislocations lying in the domain walls and moving with the creation of APB faults. For the Fe-A1 samples of high order (0.87), the dislocations seen were also single dislocations, but seemed to be loosely coupled as illustrated in Fig. 19. In this case it appears that the dislocations may be moving as loosely coupled 2-partial superdislocations interacting strongly with grown-in domain walls. Fracture surfaces of broken samples showed generally mixed intergranular and transgranular cleavage failure, Fig. 20. For the F e - A I - C r samples failure was almost completely transgranular cleavage, with little influence of grain size or testing environment. For the Fe-A1 alloy the more brittle samples
Fig. 16. First dislocations in slip band in slightly deformed FeA1 sample of low order (0.6) with shear-type domains: (a) bright field image showing dislocations and APB faults; :zone axis near (112), g vector 2~0 and 11i; (b) weak beam image showing coupling of first dislocations; zone axis near (112), g vector 2~0, imaging condition g: 4-5 g. Planar arrays of single dislocations are seen, with the APB faults of different energies between these dislocations leading to some grouping of different neighbouring dislocations. Such arrays are typical of materials with a low degree of order where disordering produced by slip tends to concentrate deformation in intense slip bands. Figure 16 shows the first dislocations in a slip band of lightly deformed material ( < 1%) where two dislocations coupled in a 2-partial configuration, trailing a D03 type APB and followed by completely dissociated single dislocations, can be seen. Figure 17 shows dislocations and shear-produced faults through the grown-in faults in a ductile poorly ordered material (0.6). This material has been deformed to about 3% strain, which has been produced by the motion of single dislocations trailing B2 type APB faults. Figure 17(a) shows one thickness fringe attached to each end of each dislocation [22] which, for the 220 g vector used to give contrast confirms the Burgers vector to be of magnitude 1(111). The APB faults shown in Fig. 17(b) are visible when using superlattiee g vectors of both the B2 lattice and the D03 lattice, hence confirming that these are B2 type APB faults characterised by a shear vector of
¼(111>.
Fig. 17. Dislocations and APB faults in Fe-A1 sample of low order (0.6) deformed to 3% strain: (a) weak beam image showing one thickness fringe attached to each dislocation end; g vector 220; g: 4-5 g imaging condition; (b) dark field image showing grown-in and shear-produced APB faults; g vector 222.
MORRIS et al.: Cr ADDITION TO A Fe-AI INTERMETALLIC
107
showed about equal amounts of cleavage and intergranular failure, while the more ductile samples failed mostly by cleavage. As reported earlier for similar alloys [15, 17], improved ductility may in part be due to a suppression of intergranular failure, but the correlation between cleavage failure and better ductility is by no means obvious. DISCUSSION Ordered microstructures
One important aspect of the present study has been the discovery of unexpected microstructures and variations between samples according to chemistry and treatment. This emphasizes the need for a complete microstructural description of a new material in order to understand its mechanical response. The ordering behaviour of the F e - A I - C r material has been exactly that expected for a binary alloy containing 28%A1, namely good B2 ordering and domain growth during the heat treatment at 850°C followed by good D03 ordering with domain growth according to diffusivity and annealing time on annealing at 500°C. No test has been made here of the atomic site locations of the Cr atoms, but it has been shown that the AI sites in Fe3A1 are probably all occupied by AI atoms. For the binary Fe-A1 alloy the ordering behaviour seen is not that expected for a Fe-28%AI alloy. Much of the behaviour seen is in fact that expected for an alloy containing 26-27%A1. On annealing at 800-850°C this material was confirmed by TEM studies to be completely ordered (B2 order) with a domain size of the order 3-5 ' 1 #m. It is clear that the degree of order achieved at 800-850°C may not be perfect, as expected for a second order phase change where the equilibrium degree of order may slowly decrease as the critical disordering temperature is approached, but nevertheless the material remains, as expected, a single phase, uniform material. This information implies that the two-phase ordered plus disordered material seen after annealing at 500°C is produced during this second stage of annealing by a B2 to ct + D03 decomposition as discussed by Allen and Cahn [8]. The reason for obtaining such decomposition in a material of nominal composition Fe-28%AI is not clear, since the phase diagram shows such decomposition only for AI contents below 26-27% [5, 6]. A possible explanation is that the real alloy composition was lower than specification--EDS analysis was not sufficiently precise to give a clear answer to this. A second possibility is that some impurity (e.g. oxygen?) may modify the phase diagram. A third possibility is that Ti and B obtained by decomposition of the TiB 2 dispersed particles may lead to a modification of the effective alloy composition or the phase diagram. This third hypothesis seems reasonable in view of the clear effect of recrystallization temperature on the
Fig. 18. Dislocations in a sample of medium-ordered Fe-AI (0.75) after slight deformation. Single dislocations in (a) mostly lie in domain walls (b) and are clearly single dislocations (c). Zone axis near (I 10); (a) bright field image, 220 g vector; (b) dark field image 002 g vector; (c) weak beam image, 220 g vector, g: 4-5 g imaging condition.
108
MORRIS et al.: Cr ADDITION TO A Fe-AI INTERMETALLIC
Fig. 19. Dislocations in well-ordered (0.87) Fe-AI deformed about 1.5%, showing loosely-coupled dislocation pairs. Zone axis near (001), 400 g vector. domain size or volume fraction of disordered material. Thus it is proposed that high temperature annealing (I 100-1250°C) leads to a significant decomposition of TiB2 phase and the subsequent solution of Ti and B. The role of B on the phase diagram is unknown. The addition of Ti to Fe3AI alloys is known to displace phase lines and to expand the ct + D03 two-phase region [23]. An alternative possibility is that the Ti may form a complex FexAlxTi phase [24], thereby effectively modifying the Fe/AI ratio of the remaining matrix. The consequence of such effects is the stabilisation of a disordered phase, which forms on the pre-existing B2 domain walls and within the domain interiors forming new D03 domain wails. Domain growth is evidently slowed by the need to move solute as the domains grow, since the walls and interiors have slightly different compositions. Interestingly an estimate of diffusion distance in 1 week at 500°C of about 100 nm is very close to the D03 domain size for the two phase materials. It is also clear that the co-existence of two phases of slightly different lattice parameter can lead to an elastic strain gradient across the domain wall: this effect was seen by X-ray diffraction on such materials where fundamental peaks from disordered and ordered phases were broadened leading to partial ovedapping. Finally, the fact that initial ordering at 800 or at 850°C led to a different final degree of DO3 order suggests that differing chemical segregation and extent of ordering at these two temperatures influenced the subsequent ordering at 500°C.
ility of the Fe-A1-Cr alloy relative to the reference Fe--A1 alloy. However, in view of the variable behaviour of the binary Fe-A1 alloy it is hardly possible to make this comparison. Instead, the deformation behaviour of each alloy and ordered state will be discussed in turn. The F e - A I - C r alloy was characterised by a low yield stress, linear work hardening rate and good ductility. The low yield stress follows from the well ordered state and the small number of domain boundaries which lead to very low friction stresses acting on superdislocations, as confirmed by the low intercept (single crystal stress) of the Hall-Petch plot. The high degree of order means that superdislocations with 4 partials are nucleated readily and propagate readily during stressing. At low stresses these 4-partial superdislocations propagate, but at higher stresses dissociation into 2-partial superdislocations occurs [10-12]. During both these stages the work hardening is linear with strain by a mechanism such as dipole interaction (25) or APB tube formation (26). Failure occurs eventually, essentially when cleavage fracture is induced. It is not possible here to analyse this failure process in more detail. Analysis of the separations of the partials making up superdislocations has been possible for this alloy, based on micrographs such as those of Figs 12 and 14. For screw to edge superdislocations the separation of the closely spaced partials (R 1 according to the convention of Crawford and Ray [27]) is about 6-16 nm, and the total separation of the superdisloca-
Deformation behaviour
The initial purpose of the present study was the comparison of the deformation behaviour and duct-
Fig. 20. Fracture surfaces of (a) Fe-A1-Cr sample, and (b) Fe-AI sample showing less than 1% ductility.
MORRIS et al.: Cr ADDITION TO A Fe-A1 INTERMETALLIC tions (R according to the Crawford-Ray convention) about 28-34 nm for screw superdislocations. These separations lead to a determination of the B2 type APB energy (Yl) as 80-90 mJm 2 and of the D03 type APB energy (72) as about 60 mJm 2, using suitable elastic data [27]. These values are in fact very close to those determined by Crawford and Ray [27] on well ordered binary Fe-28%A1, and much higher than the low values determined by McKamey et al. [16]. The analysis of these energies is important because it establishes the Fe-A1-Cr alloy here as a well ordered equivalent of the binary Fe-AI alloy without endowing it with especially different dislocation structures and separations. More detailed analysis of the Fe-AI alloy is required in view of the wide variations of properties observed. The mechanical behaviour of this material will be discussed first with respect to the yield stress, secondly with respect to the work hardening behaviour, and finally with respect to the ductility observed. For the most part the dislocations seen for this material were single dislocations. It was only for the poorly ordered material (0.6 ordered) with sheartype domain walls that some coupled 2-partial superdislocations were found after mild deformation (about ½% strain), and the separation of these dislocations can be used to deduce a value for the B2 type APB energy (Y0- The separations of the few superdislocations found were in the range 10-23 nm for screw to edge superdislocation orientations. These spacings lead to the estimation of APB energy as about 43 mJ/m 2, very much lower than found by others [16-27] for well ordered Fe-28%AI. Relating this APB energy to that measured for fully ordered Fe-28%AI (about 78 mJ/m 2) a degree of order of the present material of about 0.74 is deduced, to be compared with a value of about 0.6 deduced from X-ray analyses. The yield stress of a given Fe-AI sample may be analysed by considering the stress necessary to nucleate a suitable dislocation loop or segment and that necessary to create the APB fault left behind an imperfect dislocation. Considering first the materials of low order (about 0.6), namely those which yield at stresses of about 550-650 MPa, we need to consider the nucleation of a single dislocation loop trailing a B2 type APB fault (dislocations seen in Fig. 17, for example). The nucleation stress for a single dislocation tr is that for bowing out a segment of length L, as analysed by Eymery et al. [28], essentially mct#b a, = ~ ln(L/2b)
(1)
where m is the Taylor factor, u a constant that considers whether the dislocation segment is edge or screw, /z is the shear modulus and b the Burgers vector of the individual dislocation. Taking an average shear modulus of 7 × 10 l° Pa for this highly anisotropic material [29], considering an edge dislocation source (~¢ = 1), and taking the segment length
109
L to be the domain size, values of a. can be deduced. At the same time the stress required to move the single dislocation leaving a B2 type APB fault can be written at' =
m~l $2 b
(2)
where Vl$2 is the APB energy for this material of order parameter S. Calculating values for a, and G the sum of these two stresses varies from 500 to 550 MPa with variation in grain size/domain size for the samples of high yield stress/low order. Bearing in mind that a grain size of 40-100 # m will be expected to produce additional strengthening, greater for the finer grain size, the comparison between experimental yield stress and calculated value is extremely good. Considering the yield stresses of the Fe-AI samples of high order (0.87), we can consider the same approach as above taking the nucleation stress for a 2 partial superdislocation trailing a D03 type APB fault. In this case, after Eymery et al. [28] we have met#b {ln(L/2b) + In(L/H) + %~or}
(3)
where H is the spacing between the two partial dislocations and ~o another geometric factor. Using this equation as well as equation (2) modified to consider V2 and replacing b by 2b, the stress required to generate movement of 2-partial dislocations is deduced as 650-750MPa for the well ordered materials as grain size/domain size varies. This value is obviously much too high for these well ordered materials and cannot be a correct model of dislocation motion. Instead we may consider a model of loosely-coupled dislocation pair movement in a two phase (matrix plus ordered particle) material, as developed to describe for example Ni matrix-Ni3A1 particle systems. In this case [30] the yield stress may be written, for a 2-partial superdislocation system m~'l a o = ~ f f {(y,dpf/#bZ) '/2 - f }
(4)
where ~bis the particle size (ordered domain size), and f the volume fraction of ordered material. Using suitable values for the parameters, taking ¢p to be the size of the ordered regions, f t h e measured fraction of ordered domain interiors (typically 85 to 55% for the highly ordered materials as grain size changes), the yield stress contribution due to ordered particle strengthening is calculated as 250-150 MPa. Bearing in mind that the 2-partial superdislocations will require higher stresses since the trailing D03 type APB must also be considered, and including a grain size strengthening term, it is believed that the experimental yield stresses are reasonably explained. The work hardening rate behaviour of the various materials is easily understood in terms of the dislocations responsible for deformation. For the poorly ordered materials where single dislocations control deformation, the stress-strain behaviour is parabolic
110
MORRIS et al.: Cr ADDITION TO A Fe-AI INTERMETALLIC
in form and low work hardening rates are possible after a small amount of strain. F o r such material, where initial deformation takes place by the motion of planar dislocation arrays, cross slip of individual dislocations is relatively easy allowing them to bypass obstacles. For the highly ordered Fe-AI materials, on the other hand, deformation remains controlled by the motion of 2-partial superdislocations, although the two partial dislocations may be rather loosely coupled. Under such conditions work hardening remains linear as found earlier for typical Fe3AI alloys [10-12]. The linear work hardening of the F e - A I - C r alloy is easily understood since superdislocations control deformation. The reason why this ordered material shows a lower work hardening rate than well ordered Fe-A1 is not clear, however, and may be a significant reason for the improved ductility of the ternary alloyed material. In the present study it is possible that the presence of disordered domain walls provides additional barriers to dislocation movement or arrangement thereby affecting also the work hardening rate. The ductility variations shown by the Fe-AI materials can be easily understood in terms of the yield stress and the work hardening rate of a given material. Of importance for the following discussion is to note that failure for these materials occurred in each case at about the same fracture stress which may be considered the stress for cleavage propagation for the given ordered state and grain size. Consequently, it is possible to predict the failure strain from the initial, yield stress and from the work hardening rate. To a very good approximation the failure strain of each Fe-A1 sample can be described as proportional to the stress difference between yield and failure (650 MPa) divided by the work hardening rate once uniform deformation is established, for example at 1% strain. By way of example, the very ductile Fe-AI samples are relatively strong at yield (600 MPa) and have very low work hardening rates ( < 1 GPa/strain or < 10 MPa/%); the medium ductile Fe-AI samples are medium strong at yield (400-500 MPa) with medium to high work hardening rates (40-60 MPa/%); the brittle Fe-Ai samples are strong at yield (650 MPa) and have moderately high work hardening rates. These simplistic arguments imply that the observed ductility variations can mostly be explained by changes in the plasticity mechanisms without invoking changes in fracture processes themselves. CONCLUSIONS A detailed examination of the ordered microstructure of binary Fe-28%A1 and ternary Fe-28% A I - 4 % C r has shown completely different ordering mechanisms during heating at 800-850°C to produce B2 order and then at 500°C to produce D03 order. In the case of the ternary alloy a high degree of B2 and DO3 order is induced uniformly throughout the
material. For the binary alloy it is shown that uniform ordering to the B2 structure at high temperature is followed by a decomposition to ~tFe and D03 order on annealing at the lower temperature. The final degree of order of domain interiors varies from 0.6 to 0.87 for slight changes in annealing conditions or prior treatments. In most cases the domain walls contain disordered phase, the presence of which leads to slower domain growth kinetics. Heat treatment at very high temperatures for recrystallization is believed to dissolve some of the TiB 2 compound added to the binary alloy for grain refinement and it is the additional Ti and B solute that modifies the ordering behaviour. The ternary Fe-Al~:~r alloy deforms by the glide of superdislocations which dissociate partially into paired dislocations at higher stresses and strains. The easy movement of such dislocations leads to low yield stress, high linear work hardening and good ductility. The binary Fe-A1 alloys have higher yield stresses because of the difficulty of nucleating and moving single dislocations in poorly ordered material or because of the difficulty in moving loosely coupled superdislocations in a two phase ordered plus disordered mixture. The work hardening rate can be very high or very low depending on the particular dislocations involved, with single dislocation motion leading to parabolic hardening and low hardening rates after some strain. The strain at failure of the materials examined is sensitively dependent on the initial yield stress and the work hardening rate, since failure by cleavage seems to occur at an almost constant stress. Possible influences of environment on failure processes have not been demonstrated. Acknowledgements--We are very thankful to Dr C. T.
Liu and Ms C. G. McKamey of Oak Ridge National Laboratory for supply of the two alloys examined. One of us (M.M.D.) acknowledges financial support from the Swiss National Science Foundation (contract no. 20.28949.90)
REFERENCES
1. C. G. McKamey, J. H. DeVan, P. F. Tortorelli and V. K. Sikka, J. Mater. Res. 6, 1779 (1991). 2. U. Prakash, R. A. Buckley, H. Jones and C. M. Sellars, ISIJ Int. 31, 1112 (1991). 3. H. Warlimont, Z. Metallk. 60, 195 (1969). 4. H. Warlimont and G. Thomas, Metal Sci. J. 4, 47 (1970). 5. H. Okamoto and P. A. Beck, Metall. Trans. 2, 569 (1971). 6. P. R. Swann, W. R. Duff and R. M. Fisher, Metall. Trans. 3, 409 (1972). 7. S. M. Allen and J. W. Cahn, Acta metalL 23, 1017 (1975). 8. S. M. Allen and J. W. Cahn, Acta metall. 24, 425 (1976). 9. G. Sainfort, P. Mouturat, P. Pepin, J. Petit, G. Cabane and M. Salesse, M~m. scient. Revue M~tall. 60, 125 (1963). 10. H. J. Leamy, F. X. Kayser and M. J. Marcinkowski, Phil. Mag. 20, 763 (1969).
MORRIS et al.: Cr ADDITION TO A Fe-A1 INTERMETALLIC 1I. H. J. Leamy, F. X. Kayser and M. J. Marcinkowski, Phil. Mag. 20, 779 (1969). 12. H. J. I.~amy and F. X. Kayser, Physica status solidi 34, 765 (1969). 13. M. J. Marcinkowski, in Electron Microscopy and Strength of Crystals (edited by G. Thomas and J. Washburn), p. 333. Interscience, New York (1963). 14. M. G. Mendiratta, S. K. Ehlers, D. K. Chatterjee and H. A. Lipsitt, Metall. Trans. 18A, 283 (1987). 15. W. R. Kerr, Metall. Trans. 17A, 2298 (1986). 16. C. G. McKamey, J. A. Horton and C. T. Liu, J. Mater. Res. 4, 1156 (1989). 17. C. G. McKamey and C. T. Lui, Scripta metall, mater. 24, 2119 (1990). 18. C. T. Liu, E. H. Lee and C. G. McKamey, Scripta metalL 23, 875 (1989). 19. C. T. Liu, C. G. McKamey and E. H. Lee, Scripta metalL mater. 24, 385 (1990). 20. C. T. Liu and E. P. George, Scripta metall, mater. 24, 1285 (1990).
111
21. B. D. Cullity, Elements of X-ray Diffraction. AddisonWesley, Reading, Mass. (1967). 22. M. H. Loretto, in Electron Beam Analysis of Materials. Chapman & Hall, London (1984). 23. M. G. Mendiratta, S. K. Ehlers and H. A. Lipsitt, Metall. Trans. ISA, 509 (1987). 24, D. J. Gaydosh, S. L. Draper and M. V. Nathal, Metall. Trans. 20A, 1701 (1989). 25, G. E. Lasko and M. J. Marcinkowski, Trans. TMSAIME 245, 111 (1969). 26. A. E. Vidoz and L. N. Brown, Phil. Mag. 7, 1167 (1962). 27. R. C, Crawford and I. L. F. Ray, Phil. Mag, 35, 549 (1977). 28. J. P. Eymery, R. J. Gaboriaud, J. F. Dinhut and J. Grilhe, Scripta metall. 6, 707 (1972). 29. H. J. Leamy, E. D. Gibson and F. X. Kayser, Acta metall. 15, 1827 (1967). 30. V. Gerold, in Dislocations in Solids (edited by F. R. N. Nabarro), p. 242. North-Holland, Amsterdam (1979).