86
JOURNAL OF HYDROMETEOROLOGY
VOLUME 5
Influence of Soil Moisture on Boundary Layer Cloud Development M. B. EK National Centers for Environmental Prediction, Environmental Modeling Center, Suitland, Maryland
A. A. M. HOLTSLAG Meteorology and Air Quality Section, Wageningen University, Wageningen, Netherlands (Manuscript received 22 February 2002, in final form 10 May 2003) ABSTRACT The daytime interaction of the land surface with the atmospheric boundary layer (ABL) is studied using a coupled one-dimensional (column) land surface–ABL model. This is an extension of earlier work that focused on modeling the ABL for 31 May 1978 at Cabauw, Netherlands; previously, it was found that coupled land– atmosphere tests using a simple land surface scheme did not accurately represent surface fluxes and coupled ABL development. Here, findings from that earlier study on ABL parameterization are utilized, and include a more sophisticated land surface scheme. This land surface scheme allows the land–atmosphere system to respond interactively with the ABL. Results indicate that in coupled land–atmosphere model runs, realistic daytime surface fluxes and atmospheric profiles are produced, even in the presence of ABL clouds (shallow cumulus). Subsequently, the role of soil moisture in the development of ABL clouds is explored in terms of a new relative humidity tendency equation at the ABL top where a number of processes and interactions are involved. Among other issues, it is shown that decreasing soil moisture may actually lead to an increase in ABL clouds in some cases.
1. Introduction The interaction of the land surface with the atmospheric boundary layer (ABL) includes many processes and important feedback mechanisms with additional interactions in the case of clouds (Fig. 1; e.g., see Wetzel et al. 1996; Pielke et al. 1998; Betts 2000; Freedman et al. 2001). It is the purpose of this study to explore the feedback mechanisms, in particular, the role of soil moisture on ABL cloud development. The case study by Holtslag et al. (1995, hereafter HMR95) examined ABL model runs driven by observed surface fluxes, and reproduced the observed boundary layer structure for a case study at Cabauw, Netherlands (see, also, Stull and Driedonks 1987). But in their coupled land surface– ABL model runs HMR95 found that they could not reproduce observed fluxes and boundary layer structure using a simple land surface scheme (using constant surface conductance). In this study we use the same case study day as HMR95, but we also model land surface– ABL interactions using an ABL scheme coupled with a more sophisticated land surface scheme. To this end, for the study here we use the Coupled Corresponding author address: M. B. Ek, National Centers for Environmental Prediction, Environmental Modeling Center, 5200 Auth Road, Room 207, Suitland, MD 20746-4304. E-mail:
[email protected]
q 2004 American Meteorological Society
Atmospheric Boundary Layer–Plant-Soil (CAPS) model that consists of coupled land surface and ABL schemes, and was developed to represent interactions of the land surface with the ABL. Originally the CAPS model was intended for inclusion in large-scale numerical weather prediction models where computational efficiency is important, yet the equations used are comprehensive enough to approximate the physical processes thought to be most important (e.g., Holtslag et al. 1990; Pan 1990; Holtslag and Boville 1993; F. Chen et al. 1997; Betts et al. 1997). The land surface scheme in the CAPS model has been used in a stand-alone mode for a number of sensitivity experiments in different geophysical conditions (e.g., Kim and Ek 1995; Chen et al. 1996) and, for the same purpose, as part of the Project for Intercomparison of Land-Surface Parameterization Schemes (PILPS; e.g., T. H. Chen et al. 1997; Wood et al. 1998; Chang et al. 1999); the study by Chang et al. (1999) includes a comprehensive description of the current physics in the CAPS model land surface scheme. In addition, a number of studies have specifically examined land–atmosphere interactions using the CAPS model in a coupled land surface–ABL column mode (e.g., Ek and Mahrt 1994; Ek and Cuenca 1994; Xinmei and Lyons 1995; Cuenca et al. 1996; Holtslag and Ek 1996). In this study we first describe the dataset at Cabauw (section 2); then give an overview of the CAPS model
FEBRUARY 2004
EK AND HOLTSLAG
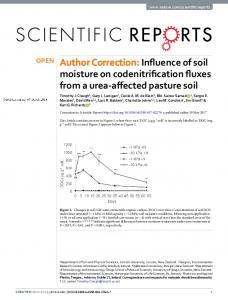
FIG. 1. Important interactions between the surface and atmospheric boundary layer for conditions of daytime surface heating. Solid arrows indicate the direction of feedbacks that are normally positive (leading to an increase of the recipient variable). Dashed arrows indicate negative feedbacks. Two consecutive negative feedbacks make a positive one. Note the many positive and negative feedback loops that may lead to increased or decreased relative humidity and cloud cover (adapted from Ek and Mahrt 1994, their Fig. 1).
(section 3); followed by land surface–only, ABL-only, and coupled land surface–ABL model runs (section 4); then examine the influence of soil moisture on ABL cloud (shallow, fair-weather cumulus) development (section 5); and finally close with a summary and conclusions (section 6). 2. Cabauw site and dataset In this study we use observations made on 31 May 1978 at or near the Cabauw site in central Netherlands that provide the necessary information for model initialization, forcing, and verification. The region surrounding the Cabauw site is rather flat for a distance of at least 20 km, with many fields and scattered canals, villages, orchards, and lines of trees. One of the main branches of the Rhine, the River Lek, flows about 1 km south of the Cabauw site, approximately 45 km east of the North Sea. The Cabauw site itself is located in an open field nearly completely covered by short grass that extends for several hundred meters in all directions, with a series of shallow, narrow ditches that provide drainage for the site. Under the sod layer (3 cm) the soil consists of heavy clay down to about 0.6 m, with a nearly saturated peat layer below. Soil moisture measurements using a neutron probe were taken covering the study day at three sample sites in the micrometeorology tower plot adjacent to the Cabauw tower; measurements were made at 10-cm intervals down to 50 cm, and at 1 m (Wessels 1983). The case study day was the beginning of a ‘‘dry down’’ period, though soil moisture values were still sufficient so that transpiration was not overly limited.
87
There had not been any precipitation for 1 week, and this was to last three more weeks into later June before the next substantial precipitation event. The 213-m tower at the Cabauw site includes atmospheric observations of winds and wind stress, temperature, and specific humidity at multiple levels, as well as sensible and latent heat fluxes determined from profile and Bowen ratio methods. Incoming solar and longwave radiation, low-level surface and soil temperatures, and low-level specific humidity measurements were made at the micrometeorological site adjacent to the Cabauw tower (within 200 m). The downward longwave radiation is suspect, however, being anomalously low. An estimate of downward longwave radiation is made via a residual by taking the difference between the observed net radiation, and the sum of the net solar radiation and outgoing terrestrial (longwave) radiation (computed from the infrared radiometer, assuming an emissivity of 1). Soil heat fluxes were measured by transducers buried at depths of 5 and 10 cm; surface soil heat flux was inferred from extrapolation of these measurements (Beljaars and Bosveld 1997). See Monna et al. (1987) and Wessels (1984) for further information on Cabauw observations, and van Ulden and Wieringa (1996) for an extensive review of Cabauw boundary layer research. Four radiosondes were launched from the Cabauw site during the morning of the study day providing temperature and moisture profiles above the tower level. Additionally the dataset is supplemented with information from radiosondes launched at De Bilt (about 25 km to the northeast) several times during the day, providing additional measurements of wind, temperature, and moisture. Because of the proximity and similarity in surface conditions, the De Bilt observations are thought to be representative of the Cabauw site, especially above the surface layer (see HMR95). For our case study day of interest, the synoptic weather pattern over western Europe was dominated by surface high pressure with generally fair weather and light winds from the east, with a frontal system to the west of the British Isles. 3. CAPS model The CAPS model consists of a land surface scheme with multiple soil layers (Mahrt and Pan 1984), and a simple plant canopy (Pan and Mahrt 1987) that is modified to include the effect of vegetation using a ‘‘big leaf’’ approach for canopy conductance, following Noilhan and Planton (1989), and is described in Holtslag and Ek (1996). This more empirically based approach for canopy conductance follows the original work by Jarvis (1976) and Stewart (1988) where canopy conductance is modeled as a function of atmospheric forcing and soil moisture availability. Under this approach, for this study we adopt the canopy conductance formulation more specific to Cabauw following Beljaars
88
JOURNAL OF HYDROMETEOROLOGY
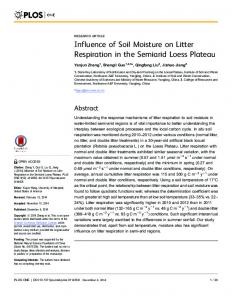
FIG. 2. Initial soil moisture profiles for 31 May 1978 at Cabauw, Netherlands: observed (3), initial model soil moisture reference profile interpolated to model soil-level midpoints (V, and solid line), and observed soil temperature at 22 cm (1) and initial model soil temperature reference profile (V, and heavy solid line).
and Bosveld (1997) who examined the influence of vegetation evaporative control on surface moisture fluxes at Cabauw. The soil heat flux formulation implicitly accounts for vegetation-reduced thermal conductivity (and, thus, soil heat flux), allowing more available energy for sensible and latent heat fluxes; this formulation follows the one used in the Tiled European Centre for Medium-Range Weather Forecasts (ECMWF) Scheme for Surface Exchanges over Land (TESSEL) model (Viterbo and Baljaars 1995; van den Hurk et al. 2000). This is in principle similar to the formulation described in Peters-Lidard et al. (1997) that uses a more explicit dependence on vegetation density (via a leaf area index). We set the depth of the first soil layer in our model the same as in the TESSEL model (7 cm; Fig. 2) in order to use the same Cabauw-calibrated coefficient in the soil heat flux formulation. Following Beljaars and Bosveld (1997), our subsequent soil layers match the bottom of the ‘‘higher root density’’ zone (18-cm depth), a zone of ‘‘lower root density’’ down to the bottom of the root zone (60 cm), with a subroot zone below (1.5-m total depth), and an implicit soil column bottom at 3.0 m. A nonlinear root distribution with excessively high root density near the surface may lead to improper rapid drying of the higher– root density soil layers in the root zone (Zeng et al. 1998). This can yield less accurate predictions of latent heat flux, and subsequently the surface energy budget. As such, in our study here we assume a near-uniform root distribution because bulk methods (uniform root
VOLUME 5
distribution) are more consistent with the current level of understanding and, thus, are preferred over rootweighted methods (Desborough 1997). This may mitigate the problem of treating the root zone as static when in fact it may be rather dynamic in terms of the ability of vegetation to extract water from where it is available in the root zone, despite the root density distribution. The ABL scheme uses the original combined local (K theory) and nonlocal (boundary layer scale mixing) development by Troen and Mahrt (1986) with an update to nonlocal mixing of heat and moisture following Holtslag and Boville (1993), and quite similar to the ABL scheme used in the HMR95 study. The boundary layer height formulation has been modified to account for boundary layers with relatively high wind speed and upper–boundary layer stratification, and includes the effect of turbulence due to surface friction under nearneutral and stable conditions (for further details, see Vogelezang and Holtslag 1996). A simple fractional boundary layer cloud-cover formulation (Ek and Mahrt 1991) is included in the ABL scheme, which is based on a Gaussian distribution of total-water (vapor plus liquid) relative humidity near the boundary layer top, where cloud cover is defined as the area under the Gaussian curve above saturation. The relative humidity distribution includes turbulent and mesoscale variations, where the turbulent variation is formulated in terms of dry-air entrainment at the boundary layer top, while the mesoscale (subgrid) variation is specified as a function of horizontal grid size (assumed to be on the order of 100 km, corresponding to a mesoscale relative humidity variation of 5% across the domain of central Netherlands). When spatial fluctuations of relative humidity are large, boundary layer clouds first form at a lower spatially averaged relative humidity. This formulation was developed using Hydrological Atmospheric Pilot Experiment (HAPEX)–Mode´lisation du Bilan Hydrique (MOBILHY) data (continental fairweather cumulus), but has also shown quite favorable performance in the study of Mocko and Cotton (1995) using data from the Boundary Layer Experiment (BLX) (also continental fair-weather cumulus) as well as from the First International Satellite Cloud Climatology Project (ISCCP) Regional Experiment (FIRE) (marine stratocumulus). With the CAPS model in a fully interactive mode, the land surface scheme is coupled with the ABL scheme, and ABL clouds predicted by the cloud-cover formulation are allowed to alter the radiation budget at the surface (via a simple surface radiation scheme included as an option in the CAPS model), thereby affecting surface processes (e.g., fluxes). Incoming clear-sky solar and downward longwave radiation reaching the surface are calculated following the methods of Collier and Lockwood (1974) (similar to Holtslag and van Ulden 1983), and Satterlund (1979), respectively, and include solar attenuation by ABL clouds via a transmission function following Liou (1976) for ‘‘climatological’’ cu-
FEBRUARY 2004
EK AND HOLTSLAG
89
mulus clouds, a cloud enhancement to the downward longwave radiation, following Paltridge and Platt (1976), and a Cabauw-specific shortwave albedo formulation following Duynkerke (1992). The lowest atmospheric model levels are at 20, 40, 80, 120, and 200 m (matching the Cabauw tower observation heights), with 100-m vertical resolution from 200 m to a height of 2 km, then 200-m resolution above to the top of the model domain (10 km). The time step used in the model runs is 180 s, which is felt to be appropriate for the model (vertical) resolution. 4. Model evaluations We first examine model runs of the land surface forced by atmospheric conditions, followed by model runs of the ABL forced by observed surface heat and moisture fluxes. These stand-alone or ‘‘offline’’ land surface–only and ABL-only (uncoupled) tests allow us to isolate the processes responsible for land surface fluxes (land surface scheme without ABL interaction) and ABL development (ABL scheme without land surface interaction) separately before coupling the land surface and ABL schemes. In a coupled mode, more complicated interactions and feedbacks are possible, including the formation and presence of ABL clouds. a. Land surface modeling results (atmospheric forcing) We use the same case study day as HMR95, and first examine a ‘‘base state’’ model run to show land surface behavior in response to observed atmospheric forcing (Fig. 3) before making coupled land surface–ABL model runs. We initialize our land surface model using soil moisture observations interpolated to the midpoint of the model soil levels (Wessels 1983; Fig. 2). Soil temperature is initialized at the first model soil layer (23.5 cm) using 22 cm observations; this difference is not expected to be significant at this time of day. Soil temperature observations are not available below 2 cm, so to initialize soil temperatures at subsequent model soil levels we make approximations from the average of the previous week, month, and 3-month 2-m air temperatures, respectively, for the lowest three model levels, with the annual 2-m air temperature used as the implicit bottom temperature. In our land surface model run driven by observed atmospheric conditions, the latent heat flux is slightly underpredicted (overpredicted) in the morning (afternoon), while sensible heat flux is generally well predicted, though slightly high around midday (Fig. 4a). This may be due to the slight underprediction in the canopy conductance in the morning (results not shown). Net radiation and soil heat flux are generally well predicted (Fig. 4b), though the soil heat flux is slightly overpredicted (underpredicted) in the morning (early afternoon), with soil temperatures still comparing fa-
FIG. 3. Atmospheric forcing data for 31 May 1978 at Cabauw, Netherlands: (a) 20-m temperature, specific humidity, and wind speed (large symbols from Cabauw and DeBilt radiosonde data), and (b) incoming and reflected solar and downward longwave radiation. (a) Time series of air temperature and specific humidity for ABL-only, and coupled land surface–ABL model runs, and (b) time series of incoming solar, reflected solar, and downward longwave radiation for coupled land surface–ABL model runs using modeled radiation (with ABL cloud interaction).
vorably (results not shown). These results are not completely surprising because the parameters used in the various surface formulations have been calibrated for Cabauw data, although not specifically for our case study day here (31 May 1978). b. Atmospheric boundary layer modeling results (surface forcing) We also examine a base state model run to show ABL behavior in response to observed surface fluxes before making coupled land surface–ABL model runs. Overall, our results are similar to those of HMR95. Following
90
JOURNAL OF HYDROMETEOROLOGY
FIG. 4. Time series of (a) latent and sensible heat flux, and (b) net radiation and soil heat flux (observations indicated by symbols), and model runs (lines) for land surface–only and coupled ABL–land surface model runs using prescribed or modeled radiation (31 May 1978 at Cabauw, Netherlands).
HMR95, large-scale (horizontal) advection was unknown but thought to be weak, considering the synoptic situation, so this same condition is applied to the ABL model runs here. As in HMR95, we initialize the ABL scheme with temperature and specific humidity profiles (Fig. 5a), and drive the ABL by prescribing observed fluxes on 31 May 1978 (see Fig. 4a). Because a column model cannot adequately represent mesoscale momentum dynamics, we prescribe the wind profile at each time step by interpolating radiosonde wind data (above 200 m) taken at 0600, 1200, and 1800 UTC; below 200 m we use 0600–1800 UTC interpolated
VOLUME 5
FIG. 5. (a) Initial atmospheric profiles of potential temperature ( u), and specific humidity (q) and saturation specific humidity (qsat), and (b) wind speed profiles from De Bilt radiosondes and Cabauw tower winds used for prescribing winds in model runs (31 May 1978).
30-min Cabauw tower wind observations that are consistent with radiosonde winds (Fig. 5b). So we depart slightly from HMR95 where wind was modeled (though they prescribed geostrophic wind); this may also have contributed to the less accurately modeled surface fluxes in HMR95. By avoiding modeling the wind we can focus more effectively on the ABL mixing of heat and moisture, and on the interactions with the land surface in the case of coupled land surface–ABL model runs (described in the next section). This method of prescribing winds was also successfully employed by Holtslag and Ek (1996) to deal with a complicated wind situation and allowed them to focus on boundary layer
FEBRUARY 2004
EK AND HOLTSLAG
91
FIG. 6. Maximum afternoon boundary layer depth (dashed line), and 1600 UTC (light gray) and maximum boundary layer (dark gray) cloud cover vs prescribed vertical motion in ABL model runs forced by observed surface fluxes (31 May 1978 at Cabauw, Netherlands).
heat and moisture mixing, and interaction with the surface. Additionally, we ‘‘turn on’’ the ABL clouds in order to assess the performance of the ABL cloud formulation, though there is no interaction with the surface because surface fluxes are prescribed; that is, in this phase of testing, ABL clouds do not modify the surface radiation budget and subsequent ABL development. In ‘‘full’’ coupled land surface–ABL testing (the subject of the next section), we include the effect of a cloud-modified surface radiation budget. (However, note that in our cloud-cover formulation so far, there is no enhanced turbulent mixing due to ABL clouds, that is, by shallow cumulus.) Large-scale vertical motion was not known in the HMR95 study where it was set to zero; however, the prescribed vertical motion affects boundary layer growth, which influences ABL cloud development. So we first make a series of sensitivity tests of the ABL model forced by observed surface fluxes where vertical motion is varied between 61.0 cm s21 (at 2 km, then linearly decreasing to zero at the surface). Modeled ABL clouds are first predicted in the midafternoon, and generally increase with increasing vertical motion (increasing boundary layer depth), with modeled ABL cloud cover varying between near zero and complete coverage (Fig. 6). With increasing prescribed vertical motion, ABL clouds form and increase in their fractional coverage because with an increasingly deeper ABL, cooling at the ABL top is sufficient for the relative humidity to reach a threshold value (influenced by the ABL-top relative humidity variation) for clouds to form. For our case study day here, modeled cloud cover remains small until positive values of vertical motion are prescribed, after which cloud cover increases greatly (while bound-
FIG. 7. Time series of (a) ABL height and (b) cloud cover for ABLonly, and coupled land surface–ABL model runs (31 May 1978 at Cabauw, Netherlands).
ary layer depth increases slightly). Results suggest that a nominally small value of vertical motion (10.5 cm s21) gives a fractional ABL cloud cover that is qualitatively consistent with the synoptic weather situation described earlier, where ABL clouds (fair-weather cumulus) first formed in the early to midafternoon with 3/8–5/8 coverage by late afternoon across the region around Cabauw in central Netherlands. Note that when using a prescribed large-scale vertical motion of zero (as in HMR95), modeled cloud coverage is quite small, though profiles and time series of temperature and specific humidity are not overly sensitive (as in HMR95) (results not shown). In our ABL model run driven by observed surface fluxes, modeled ABL growth is slightly too vigorous in the morning hours; ABL depth is better represented in the afternoon, and during the late afternoon ABL transition to a shallow stable boundary layer (Fig. 7). ABL growth is also slightly more vigorous in the late morning than that found in HMR95, with noon time values a few hundred meters deeper, though well within the range of uncertainty in the observed ABL depth at De Bilt (used as an estimate for Cabauw). Midafternoon values of modeled ABL depth were about 400–500 m deeper than found by HMR95, though lack of observations during
92
JOURNAL OF HYDROMETEOROLOGY
VOLUME 5
this period makes this comparison inconclusive. Our prescription of wind profiles throughout the model run period versus modeled winds in HMR95 may have lead to differences in diagnosed ABL height. Also recall that in our study here we have updated the ABL height formulation (described in section 3), though use of the original formulation for ABL height yields little difference in the development of the ABL, owing to the daytime convective nature of the ABL (results not shown). The modeled evolution of both temperature and moisture is consistent with the ABL development, and, as in HMR95, the modeled 20-m (potential) temperature was found to be slightly warmer than observed in the morning hours, and about 18C cooler than observed during the afternoon hours (Fig. 3a). Specific humidity is comparable to observations, though with a slightly smaller midmorning peak that is often observed prior to late-morning rapid ABL growth (Fig. 3a). Also note the 1200 UTC profiles of potential temperature and specific humidity (Fig. 8), which show the modeled potential temperature profile cooler than observed by about 1.0 K (1.5 K) compared to Cabauw tower (De Bilt radiosonde) observations, and specific humidity about 0.5 g kg21 greater (less) than the Cabauw tower (De Bilt radiosonde) observations. As in HMR95, the differences in the profiles may be attributed to modifications in the air mass not represented by the forcings, that is, surface fluxes, and initial temperature and humidity and specified wind profiles. We refer the reader to HMR95 for further details of their sensitivity experiments on ABL response to, for example, various choices of advection, initial temperature and specific humidity profiles, and other model sensitivity tests. c. Coupled modeling results (surface–atmosphere interaction) In coupled runs, the model is initialized the same as in previous land surface–only (section 4a) and ABLonly (section 4b) model runs, but now the land surface is allowed to operate interactively with the ABL, but with the observed radiation at the surface prescribed for our first test. Note that if the results from coupled model runs improve compared to results from model runs with the land surface scheme operating alone (atmosphere and radiation forced), or with the ABL scheme operating alone (surface forced), then compensating interactions could be responsible for any noted improvement. On the other hand, a coupled model study may reveal that the model fluxes are more representative on the ABL scale (e.g., on the order of tens of kilometers) compared to those observed (at the Cabauw tower site). Margulis and Entekhabi (2001) explored land–atmosphere interaction using an adjoint framework, and point out the importance of using a coupled (e.g., land surface–ABL) model in examining the sensitivity of surface parameters (versus typical uncoupled testing). In our study here, generally we hope that in coupling the land surface and
FIG. 8. ABL profiles at 1200 UTC for (a) potential temperature and (b) specific humidity for ABL-only, and coupled land surface– ABL model runs (31 May 1978 at Cabauw, Netherlands).
ABL schemes that the results will not diverge significantly. This appears to be the case in the coupled model runs for surface heat fluxes (Fig. 4), and ABL development and cloud formation (Figs. 3a, 7, and 8). (Note that in the case here, predicted ABL clouds are passive in that they do not affect the radiation reaching the surface.) As an additional test, we utilize the simple surface radiation scheme (described in section 3) to predict the radiation budget at the surface. This removes an additional degree of freedom in coupled model runs so that it is more ‘‘fully interactive’’ (except for the specified evolution of the wind profile). The ABL cloud cover predicted by the cloud-cover formulation attenuates incoming solar radiation and slightly enhances downward longwave radiation that reaches the surface, which af-
FEBRUARY 2004
EK AND HOLTSLAG
93
fects land surface processes (canopy conductance, surface fluxes, etc), subsequent boundary layer development, cloud cover, and so on. In this case, the incoming and reflected solar (S↓ and S↑, respectively) and downward longwave (L↓) radiation are predicted fairly well (Fig. 3b), which assesses the performance of our simple surface radiation scheme and the interaction with ABL clouds. The modeled surface heat fluxes (Fig. 4) are similar to those using observed radiation, with similar results for ABL development and cloud cover (Figs. 3a, 7, and 8). 5. Impact of soil moisture on ABL cloud development a. Coupled model results To fully explore the interaction of the land surface with the ABL and the effect on boundary layer cloud development, we make a series of model runs (a ‘‘reference’’ set) where we change the soil moisture from quite dry to quite wet. Initial conditions and forcing are the same as in our previous coupled model runs (except here we specify a uniform soil moisture profile to better illustrate differences between model runs), and vary soil moisture from below the wilting point (Qwilt) to near saturation (Qsat). We note that for the various model runs, as we decrease the initial soil moisture from intermediate soil moisture values (close to observations, Q 5 0.43) to below the wilting point, ABL cloud cover decreases to zero (Fig. 9a), a somewhat intuitive result. However, as we increase the initial soil moisture from intermediate soil moisture values to near saturation, ABL cloud cover decreases slightly, a somewhat counterintuitive result. Certainly there are a number of processes that account for this behavior, that is, interactions between the land surface, atmospheric boundary layer (including ABL clouds), free atmosphere, and initial ABL conditions (Fig. 1). Before attempting an explanation of this response, we also examine the role of atmospheric stability (gu) above the ABL in land surface interaction with the evolving boundary layer because gu has a strong influence on boundary layer growth. We make two additional sets of model runs as above, except now we prescribe one set with increased atmospheric stability above the observed afternoon boundary layer top (compared with the reference set of model runs above), and another set with decreased atmospheric stability (see Fig. 5a). We then examine the resulting afternoon ABL depth and fractional cloud cover, and the midday surface energy budget as it changes with changing prescribed initial soil moisture (Fig. 9b). The set of model runs with stronger atmospheric stability has shallower ABL depths than the reference set and less cloud cover for drier soils, with increasing cloud cover for model runs with increased soil moisture. However, in great contrast, the set of model runs with
FIG. 9. Impact of variation in volumetric soil moisture for different sets of model runs (reference, and increased and decreased aboveABL atmospheric stability) on (a) ABL depth and cloud cover, and (b) components of the surface energy budget (Rn: net radiation; LE: latent heat flux; H: sensible heat flux; and G: soil heat flux).
weaker atmospheric stability above the ABL has deeper ABL depths (as one would expect) and yet much greater cloud cover for drier soils, with decreasing cloud cover for increasing soil moisture. This is in general agreement with the findings by Wetzel et al. (1996). In the next section, we will attempt to explain this result in terms of a tendency equation for relative humidity at the ABL top. b. Analytical results The role of soil moisture in ABL cloud development involves a complex interaction of surface and atmospheric processes. Ek and Mahrt (1994) examined the daytime evolution of ABL-top relative humidity that is expected to control ABL cloud development. They showed that the relative humidity tendency at the ABL top involves a number of competing mechanisms, with relative humidity directly increasing due to surface evaporation and due to ABL growth (ABL-top temperature decreases), and relative humidity directly decreasing due to surface sensible heat flux and due to entrainment of warm and dry air into the ABL from above. The indirect role of surface evaporation is to reduce
94
JOURNAL OF HYDROMETEOROLOGY
VOLUME 5
surface heating, thereby competing with ABL growth that is reduced due to reduced surface heating, although this diminishes ABL-top warm- and dry-air entrainment. In a similar type of study, De Bruin (1983) examined the effect of different land surface and ABL processes on the Priestley–Taylor parameter (used in relating surface available energy to surface evaporation). To further understand the role of soil moisture and other factors on ABL cloud development, we extend the work of Ek and Mahrt (1994) and examine a useful new equation for relative humidity tendency at the ABL top (see appendix for development), where
1
2
]RH Rn 2 G 5 [e f 1 ne(1 2 e f )], ]t rLy hq s
(1)
where Rn 2 G is available energy at the surface (Rn is net radiation and G is soil heat flux), r is air density, Ly is latent heat, h is ABL depth, and qs is saturation specific humidity just below the ABL top. In (1), ef is the surface evaporative fraction (of surface energy available for evaporation) defined as ef 5
LE LE 5 , Rn 2 G H 1 LE
(2)
where LE (5rLy w9q9s ) and H (5rcpw9us9 ) are the surface latent and sensible heat fluxes, respectively. Furthermore, ne(1 2 ef) reflects the direct effects of nonevaporative processes on relative humidity tendency, where ne is given by ne 5
[
1
2
]
Ly Dq c (1 1 Cu) 1 RH 2 2 c1 , cp hgu gu
(3)
where cp is specific heat, Cu is the (negative of the) ratio of surface to ABL-top sensible heat flux, Dq is the specific humidity drop above the ABL (negative), gu is the potential temperature lapse rate above the ABL, and c1, c2 are functions of surface pressure, temperature and pressure at the ABL top, and constants (see appendix). Here, ne consists of three terms [each multiplied by (Ly / cp)(1 1 Cu)]: ABL-top dry-air entrainment [Dq/(hgu), a negative contribution to ABL-top relative humidity tendency], boundary layer growth (RHc2 /gu, a positive contribution), and boundary layer heating through surface warming and ABL-top warm-air entrainment (RHc1, a negative contribution). From (1) we see that the relative humidity tendency is proportional to available energy and inversely proportional to ABL depth and temperature (via saturation specific humidity), while the sign of the relative humidity tendency is determined by the sign of ef 1 ne(1 2 ef). Examining (1), it is apparent that the direct role of ef is to increase the ABL-top relative humidity, while the indirect role of surface evaporation (via reduced surface heating, and diminished ABL growth and entrainment) is found in the expression ne(1 2 ef). Figure
FIG. 10. ABL-top relative humidity tendency equation, ef 1 ne(1 2 e f ) (normalized by the available energy term), as a function of evaporative fraction (ef) vs nonevaporative processes (ne) with Cabauw (Netherlands, 31 May 1978) values and times indicated (dots). See text for details.
10 shows how ef 1 ne(1 2 ef) depends on ef versus ne, where ef 1 ne(1 2 ef ) is the relative humidity tendency, ]RH/]t, normalized by the available energy term, (Rn 2 G)/(rly hqs). When the above-ABL atmospheric stability is rather strong (larger gu), or if the stability is rather weak and the above-ABL air is rather dry (larger Dq), then ne , 1 so that ]RH/]t increases as ef increases, confirming intuition. (For the range 0 , ne , 1, ]RH/]t . 0 and increases with increasing ef, while for ne , 0, ]RH/]t . 0 only when ef exceeds some threshold value that increases for increasingly negative values of ne.) Here, soil moisture acts to increase ABL-top relative humidity and, thus, increases the probability of ABL cloud development given a sufficient initial ABL relative humidity. On the other hand, with weaker above-ABL stability (smaller gu), boundary layer growth is less restricted over drier soils than over moister soils compared to the case with stronger stability. So with above-ABL air that is not too dry, then ne . 1 so that ]RH/]t increases as ef decreases, which is somewhat counterintuitive. Here, soil moisture acts to limit the increase of ABL-top relative humidity and, thus, decreases the probability of ABL cloud development. Note that the largest values of ]RH/]t are achieved for ne . 1, suggesting that the greatest potential for ABL cloud development is not over moist soils, but rather over dry soils with weak stability and above-ABL air that is not too dry. From (1)–(3), note that with drier air above the ABL (increasingly negative Dq), the value of ne decreases,
FEBRUARY 2004
EK AND HOLTSLAG
95
and that as the soil moisture increases, generally ef increases (depending on the precise relationship between soil moisture and surface evaporation). But a change in stability above the ABL (gu) affects both dry-air entrainment and boundary layer growth, two opposing processes in the ABL-top relative humidity tendency equation. So, only if the above-ABL specific humidity drop is greater (less negative) than some threshold Dq . 2RHhc2 (at the ABL top) will ne increase with decreasing stability, which corresponds to ne . 2(Ly /cp) (1 1 Cu)RHc1 (to the left of the heavy vertical dashed lines in Fig. 11). Note that this threshold value of Dq decreases (becomes more negative) for increasing RH, h, and c2 (decreasing T); this is the case at Cabauw from morning to midday. Finally, as Dq → 0, ne . 0 for gu , c2/c1 , øg/cp ø 1C (100 m)21 (dry adiabatic lapse rate). Before we proceed, we note that the outcome of (1)– (3) (as presented in Figs. 10 and 11) agrees well with the output of the coupled model (confirmed by more than a thousand runs), as long as h/2L . 5, which is required for the assumption of mixed-layer conditions (see Holtslag and Nieuwstadt 1986). c. Discussion We can examine the various ABL-top relative humidity tendency terms in (1)–(3) for Cabauw data during periods of positive surface fluxes and when h/2L . 5 (Table 1, Fig. 10). From midmorning until midday, the dry-air entrainment term decreases in magnitude (becomes less negative) with time because of increasing ABL depth and a somewhat steady value of dry air above the ABL (despite decreasing atmospheric stability just above the growing ABL), while the ABL growth term increases greatly as the atmospheric stability decreases. During this same time period the ABL warming term diminishes only modestly, and the evaporative fraction increases only slightly. Here, the effect of soil moisture is to increase the ABL-top relative humidity (ne , 1), except during the midday rapid ABL growth when the effect of soil moisture only modestly increases ABL-top relative humidity (ne , ø1). We note that the ABL-top relative humidity increased sufficiently for ABL clouds (both modeled and observed) to form by mid- to late afternoon (see discussion in section 4b). We now focus on the rapid ABL growth period (e.g., 1115 UTC at Cabauw), during or after which ABL clouds are generally initiated, and examine the effect of changing evaporative fraction and atmospheric stability on the relative humidity tendency. Using the initial soil moisture value near that observed at Cabauw, note that as with the Cabuaw observations, ne , ø1 for the reference set model run as well (Table 2). For a drier soil in this case, normalized relative humidity tendency decreases slightly, with the ABL cloud cover also decreasing. In a deeper growing boundary layer due to larger surface sensible heat flux, a larger h yields a
FIG. 11. Values of ne as a function of above-ABL atmospheric stability (gu) vs above-ABL specific humidity drop (Dq) for (a) morning conditions at Cabauw (Netherlands, 31 May 1978; RH 5 0.80, h 5 400 m, and T 5 12.0C at 0850 UTC, with Cabauw values based on observations, upper left, black dot) and (b) midday conditions (RH 5 0.90, h 5 1875 m, and T 5 5.0C at 1115 UTC, with Cabauw value middle left, black dot).
smaller actual relative humidity tendency [see (1)–(3)], and less cloud cover (Fig. 9a). Here, stronger warmand dry-air entrainment negates the effect of ABL-top cooling on the increase of ABL-top relative humidity. For a moister soil, normalized relative humidity tendency increases slightly, although with a shallower ABL depth the actual relative humidity tendency is less with subsequently less cloud cover. In this case the greatest relative humidity tendency (and, thus, cloud cover) occurs for intermediate soil moisture. This is in agreement
96
JOURNAL OF HYDROMETEOROLOGY
VOLUME 5
TABLE 1. Quantities used to evaluated the relative humidity tendency terms from observations via Eqs. (1)–(3) for 31 May 1978 at Cabauw, Netherlands, corresponding to times at the Cabauw tower in the morning shallower boundary layer (0645 and 0715 UTC), and radiosonde launches at Cabauw (0748 and 0850 UTC) and at De Bilt (1115 UTC). See text for explanation. Time (UTC)
R n 2 G (W m22 )
r (kg m23 )
h (m)
qsat (g kg21 )
e f (2)
Dq (g kg21 )
0645 0715 0748 0850 1115
168 211 247 336 431
1.22 1.21 1.20 1.19 1.02
137 172 250 400 1875
10.6 10.7 10.1 9.0 6.6
0.86 0.82 0.83 0.81 0.79
21.0 21.0 21.0 21.0 21.0
Time (UTC)
gu (K km21 )
RH (2)
T (8C)
( p/ps )Rd /cp (2)
h/2L (2)
0645 0715 0748 0850 1115
20 18 16 12 4
0.81 0.80 0.77 0.80 0.90
15.0 15.0 14.0 12.0 5.0
1.00 0.99 0.99 0.99 0.94
6.8 17.6 31.0 47.0 250.0
Time (UTC)
Dry-air ABL growth entrainment (2) (2)
0645 0715 0748 0850 1115
21.09 20.96 20.75 20.62 20.40
0.67 0.73 0.76 0.95 2.51
ABL warming (2)
ne (2)
e f (2)
ne (1 2 e f ) (2)
e f 1 ne (1 2 e f ) (2)
dRH/dt (h21 )
21.67 21.65 21.52 21.41 21.18
22.09 21.88 21.50 21.08 0.94
0.86 0.82 0.83 0.81 0.79
20.30 20.34 20.25 20.20 0.20
0.55 0.48 0.58 0.61 0.99
0.076 0.066 0.068 0.069 0.048
with our assessment of the role of soil moisture on ABL cloud development based on the development in the previous section. For the two sets of model runs where the atmospheric stability above the boundary layer is changed, note that Dq is greater (less negative) than the threshold value, so that an increase (decrease) in atmospheric stability (gu) should yield a decrease (increase) in ne (see previous section, Fig. 11). So for the set of model runs with increased (stronger) atmospheric stability, ABL depth is shallower (as one would expect), and because ne , 1 there is a decrease in ABL-top relative humidity tendency and, thus, less cloud cover for drier soils (Table 2, Fig. 9a), with increasing cloud cover for increasing soil moisture (ne ø 0). In contrast, for the set of model runs with decreased (weaker) atmospheric stability, ABL depth is deeper (as one would expect), and yet because ne . 1 there is an increase in ABL-top relative humidity tendency and, thus, more cloud cover for drier soils, with decreasing cloud cover for increasing soil moisture (ne k 1). Note that the largest values of ]RH/ ]t and, thus, ABL cloud cover are achieved for a small evaporative fraction (lower soil moisture) with weak TABLE 2. Midday normalized relative humidity tendency, e f 1 ne(1 2 e f ) [5(]RH/]t) rLy hqs /(R n 2 G)]; for different surface evaporative fractions and atmospheric stability conditions. Evaporative fraction (e f )
Stability above ABL [gu (K km21 )]
Nonevaporative term (ne)
Dry (0.20)
øObserved (0.79)
Moist (0.95)
Increased (7.0) Reference (4.0) Decreased (1.0)
0.03 0.94 7.28
0.224 0.949 6.021
0.797 0.987 2.315
0.953 0.997 1.314
stability (ne k 1), as was suggested in the relative humidity tendency development in the previous section. These findings are qualitatively consistent with the Ek and Mahrt (1994) HAPEX MOBILHY data (summer 1986, southwest France) who found that a fair-weather day with strong atmospheric stability above the ABL and a large observed evaporative fraction (via higher soil moisture) gave a similar midday relative humidity at the ABL top as a fair-weather case 9 days later with weaker atmospheric stability and decreased soil moisture. 6. Summary In this coupled model study we have examined land– atmosphere interaction using model runs with observational verification. Results indicate that in coupled land surface–atmospheric boundary layer (ABL) model runs, realistic daytime surface fluxes and atmospheric profiles, including ABL clouds, are produced using the CAPS model. Both land surface and ABL model runs yielded encouraging results operating separately, and when coupled together interactively, even in the presence of model-predicted ABL clouds. This suggests that in this coupled land–atmosphere system, processes are well-represented by the CAPS model. The role of soil moisture on ABL cloud development was explored in terms of a new ABL-top relative humidity tendency equation, where a number of land surface and atmospheric processes interact. It was shown with good agreement between model runs, an analytical development, and analysis of Cabauw data, that the effect of soil moisture is to increase the ABL-top relative humidity tendency and, thus, the potential for ABL
FEBRUARY 2004
97
EK AND HOLTSLAG
cloud formation only if the stability above the boundary layer is not too weak (and given sufficient initial ABL relative humidity, and above-ABL air that is not too dry). On the other hand, for weak stability above the boundary layer, drier soils yield a greater ABL-top relative humidity tendency and, thus, cloud cover. There is great interest in the study of land–atmosphere interaction and a large number of datasets from many field programs representing diverse geophysical locations with which to study these interactions. The new relative humidity tendency equation presented here may provide a useful quantitative framework for future land surface– ABL interaction studies in the formation of ABL clouds. Acknowledgments. This research was supported by the NOAA Climate and Global Change Program under award number NA36GP0369, the Air Force Office of Scientific Research under contract F49620-9610058, and the Royal Netherlands Meteorological Institute (KNMI), which provided the Cabauw dataset. KNMI sponsored Michael Ek as a visiting scientist while on sabbatical leave from Oregon State University, prior to joining NCEP/EMC under the University Corporation for Atmospheric Research Visiting Scientist Program. We also wish to thank Fred Bosveld and Bart van den Hurk at KNMI, Anton Beljaars at ECMWF, Larry Mahrt and Richard Cuenca at Oregon State University, Ken Mitchell at NCEP/EMC, and a host of other scientists at Wageningen University, KNMI, and elsewhere for their helpful comments, patience, and support during the progress of this work. In addition, we wish to acknowledge the useful comments from reviewer Christa Peters-Lidard at NASA/GSFC and two anonymous referees, and AMS Journal of Hydrometeorology editor Dara Entekhabi. APPENDIX Relative Humidity Tendency at the ABL Top Relative humidity at the atmospheric boundary layer (ABL) top is thought to control the development of ABL clouds. In order to understand the relevant processes we initially follow the development in Ek and Mahrt (1994) (with a modification by Chang and Ek 1996), and analyze the relative humidity (RH) tendency at the ABL top, which may be written as
12
1 2
]RH ] q 1 ]q RH ]q s 1 ]q RH ] ee s 5 5 2 5 2 ]t ]t q s q s ]t q s ]t q s ]t q s ]t p 5
1
2
1 ]q 1 ]p 1 de s ]T 1 RH 2 , q s ]t p ]t e s dT ]t
(A1)
where q is the specific humidity, qs is saturation specific humidity (øees/p), e is the ratio of dry air to water vapor gas constants, es is saturation vapor pressure, p is air pressure, des/dT is the slope of the saturation vapor pressure curve, and T is temperature.
FIG. A1. Schematic of idealized well-mixed boundary layer used in analyzing the relative humidity tendency at the ABL top, where h is boundary layer depth, Dq and gq are the above-ABL specific humidity drop and lapse rate, respectively, and Du and gu are the above-ABL potential temperature ‘‘jump’’ and lapse rate (stability), respectively.
With well-mixed conditions for u and q (typical for a dry convective boundary layer where h/2L . 5), the relative humidity reaches a maximum near the boundary layer top, which will be the reference level in the following development. The relative humidity tendency combines the separate influences of changes in moisture and changes in temperature, the first and second terms on the right-hand side of (A1), respectively, where these tendencies are influenced by different boundary layer and land surface processes. This development is continued to explicitly account for these different processes. Temperature tendency in a well-mixed boundary layer can be expressed as
[1 2 ]
]T ] p 5 u ]t ]t ps
R d /c p
,
(A2)
which can be eventually written as
12
]T p 5 ]t ps
R d /c p
]u R T ]p 1 d , ]t c p p ]t
(A3)
where u is potential temperature, ps is surface pressure, cp is specific heat of air, and the equation of state and the definition of potential temperature have been used. Using the hydrostatic approximation and neglecting the local change of pressure at a fixed height, the pressure tendency can be written as ]p ]p ]h ]h pg ]h 5 5 2r g 5 2 , ]t ]z ]t ]t R d T ]t
(A4)
where h is the boundary layer depth, z is height, r is air density, and g is gravity. Substituting (A4) into (A3) gives
98
JOURNAL OF HYDROMETEOROLOGY
12
]T p 5 ]t ps
R d /c p
]u g ]h 2 . ]t c p ]t
(A5)
The Clausius–Clapeyron equation can be written as 1 de s L 5 y 2, e s dT Ry T
REFERENCES
1
2
]RH 1 ]q RH ]h ]u 5 1 c2 2 c1 , ]t q s ]t qs ]t ]t
(A7)
where
12
c2 5
1R T
Ly q s y
2
2
R d /c p
;
2
cp qs g . Rd T cp
(A8)
For our well-mixed ABL assumption we can use equations for the boundary layer moisture and thermodynamic budgets from Tennekes (1973) (in the advectionfree case): ]q (w9q9 s 2 w9q9 h ) 5 ; ]t h ]u (w9u9 s 2 w9u9 h ) 5 , ]t h
(A9)
where w9q9 and w9u9 are the moisture and heat fluxes, respectively, and the subscripts s and h refer to the surface and the level just below the boundary layer top, respectively. Substituting (A9) into (A7) gives ]RH (w9q9 s 2 w9q9 h ) 5 ]t hq s 1
[
]
RH ]h w9u9 s (1 1 Cu ) c 2 c1 , q s 2 ]t h
(A10)
where Cu 5 2w9u9 h/w9u9 s, the (negative of the) ratio of surface to ABL-top sensible heat flux. Equation (A10) is quite similar to the relative humidity tendency equation from Ek and Mahrt [1994, their Eq. (9)]. Next, we assume a simple bulk well-mixed ABL (Fig. A1) so that the ABL depth tendency may be approximated as (Tennekes 1973; Betts 1973): ]h w9u9 s (1 1 Cu ) 5 , ]t hgu
(A11)
where gu is the vertical gradient of potential temperature above the ABL. ABL-top dry-air entrainment is w9q9 h 5 2Dq
ABL top [which is normally negative, and the mean large-scale vertical motion is zero, analogous to Tennekes (1973, his Eq. (1), and others) (Fig. A1)]. Substituting (A11) and (A12) into (A10) eventually yields (1), the relative humidity tendency at the ABL top.
(A6)
where Ly is latent heat. Substituting (A5) and (A6) into (A1) gives
L q p c1 5 y s2 Ry T p s
VOLUME 5
]h , ]t
(A12)
where Dq is the change in specific humidity across the
Beljaars, A. C. M., and F. C. Bosveld, 1997: Cabauw data for the validation of land surface parameterization schemes. J. Climate, 10, 1172–1193. Betts, A. K., 1973: Non-precipitating cumulus convection and its parameterization. Quart. J. Roy. Meteor. Soc., 99, 178–196. ——, 2000: Idealized model for equilibrium boundary layer over land. J. Hydrometeor., 1, 507–523. ——, F. Chen, K. E. Mitchell, and Z. I. Janjic´, 1997: Assessment of the land surface and boundary layer models in two operational versions of the NCEP Eta Model using FIFE data. Mon. Wea. Rev., 125, 2896–2916. Chang, S., and M. Ek, 1996: Note on ‘‘Daytime evolution of relative humidity at the boundary layer top.’’ Mon. Wea. Rev., 124, 1323– 1326. ——, D. Hahn, C.-H. Yang, D. Norquist, and M. Ek, 1999: Validation study of the CAPS model land surface scheme using the 1987 Cabauw/PILPS dataset. J. Appl. Meteor., 38, 405–422. Chen, F., and Coauthors, 1996: Modeling of land-surface evaporation by four schemes and comparison with FIFE observations. J. Geophys. Res., 101, 7251–7268. ——, Z. Janjic´, and K. Mitchell, 1997: Impact of atmospheric surfacelayer parameterizations in the new land-surface scheme of the NCEP mesoscale Eta model. Bound.-Layer Meteor., 85, 391– 421. Chen, T. H., and Coauthors, 1997: Cabauw experimental results from the Project for Intercomparison of Land-surface Parameterization Schemes. J. Climate, 10, 1194–1215. Collier, L. R., and J. G. Lockwood, 1974: The estimation of solar radiation under cloudless skies with atmospheric dust. Quart. J. Roy. Meteor. Soc., 100, 678–681. Cuenca, R. H., M. Ek, and L. Mahrt, 1996: Impact of soil water property parameterization on atmospheric boundary-layer simulation. J. Geophys. Res., 101, 7269–7277. De Bruin, H. A. R., 1983: A model for the Priestley–Taylor parameter a. J. Climate Appl. Meteor., 22, 572–578. Desborough, C. E., 1997: The impact of root-weighting on the response of transpiration to moisture stress in land surface schemes. Mon. Wea. Rev., 125, 1920–1930. Duynkerke, P. G., 1992: The roughness length for heat and other vegetation parameters for a surface of short grass. J. Appl. Meteor., 31, 579–586. Ek, M., and L. Mahrt, 1991: A formulation for boundary-layer cloud cover. Ann. Geophys., 9, 716–724. ——, and R. H. Cuenca, 1994: Variation in soil parameters: Implications for modeling surface fluxes and atmospheric boundarylayer development. Bound.-Layer Meteor., 70, 369–383. ——, and L. Mahrt, 1994: Daytime evolution of relative humidity at the boundary layer top. Mon. Wea. Rev., 122, 2709–2721. Freedman, J. M., D. R. Fitzjarrald, K. E. Moore, and R. K. Sakai, 2001: Boundary layer clouds and vegetation–atmosphere feedbacks. J. Climate, 14, 180–197. Holtslag, A. A. M., and A. P. van Ulden, 1983: A simple scheme for daytime estimates of the surface fluxes from routine weather data. J. Climate Appl. Meteor., 22, 517–529. ——, and F. T. M. Nieuwstadt, 1986: Scaling the atmospheric boundary layer. Bound.-Layer Meteor., 36, 201–209. ——, and B. Boville, 1993: Local versus nonlocal boundary-layer diffusion in a global climate model. J. Climate, 6, 1825–1842. ——, and M. Ek, 1996: Simulation of surface fluxes and boundary layer development over the pine forest in HAPEX–MOBILHY. J. Appl. Meteor., 35, 202–213.
FEBRUARY 2004
EK AND HOLTSLAG
——, E. I. F. de Bruijn, and H.-L. Pan, 1990: A high-resolution air mass transformation model for short-range weather forecasting. Mon. Wea. Rev., 118, 1561–1575. ——, E. van Meijgaard, and W. C. de Rooy, 1995: A comparison of boundary layer diffusion schemes in unstable conditions over land. Bound.-Layer Meteor., 76, 69–95. Jarvis, P. G., 1976: The interpretation of the variations in leaf water potential and stomatal conductance found in canopies in the field. Philos. Trans. Roy. Soc. London, 273B, 593–610. Kim, J., and M. Ek, 1995: A simulation of the surface energy budget and soil water content over the Hydrologic Atmospheric Pilot Experiment–Mode´lisation du Bilan Hydrique forest site. J. Geophys. Res., 100, 20 845–20 854. Liou, K.-N., 1976: On the absorption, reflection and transmission of solar radiation in cloudy atmospheres. J. Atmos. Sci., 33, 798– 805. Mahrt, L., and H.-L. Pan, 1984: A two-layer model of soil hydrology. Bound.-Layer Meteor., 29, 1–20. Margulis, S. A., and D. Entekhabi, 2001: Feedback between the land surface energy balance and atmospheric boundary layer diagnosed through a model and its adjoint. J. Hydrometeor., 2, 599– 620. Mocko, D. M., and W. R. Cotton, 1995: Evaluation of fractional cloudiness parameterizations for use in a mesoscale model. J. Atmos. Sci., 52, 2884–2901. Monna, W. A. A., and J. G. van der Vliet, 1987: Facilities for research and weather observations on the 213-m tower at Cabauw and at remote locations. KNMI Scientific Rep. WP-87-5, 28 pp. [Available from Royal Netherlands Meteorological Institute (KNMI), Postbus 201, 3730 AE De Bilt, Netherlands.] Noilhan, J., and S. Planton, 1989: A simple parameterization of land surface processes for meteorological models. Mon. Wea. Rev., 117, 536–549. Paltridge, G. W., and C. M. R. Platt, 1976: Radiative Processes in Meteorology and Climatology. Vol. 5, Developments in Atmospheric Science, Elsevier, 318 pp. Pan, H.-L., 1990: A simple parameterization scheme of evapotranspiration over land for the NMC medium-range forecast model. Mon. Wea. Rev., 118, 2500–2512. ——, and L. Mahrt, 1987: Interaction between soil hydrology and boundary-layer development. Bound.-Layer Meteor., 38, 185– 202. Peters-Lidard, C. D., M. S. Zion, and E. F. Wood, 1997: A soilvegetation-atmosphere transfer scheme for modeling spatially variable water and energy balance processes. J. Geophys. Res., 102 (D4), 4303–4324. Pielke, R. A., Sr., G. Dalu, J. Eastman, P. L. Vidale, and X. Zeng, 1998: Boundary layer processes and land surface interactions on the mesoscale. Clear and Cloudy Boundary Layers, A. A. M.
99
Holtslag and P. G. Duynkerke, Eds., Royal Netherlands Academy of Arts and Sciences, 155–176. Satterlund, D. R., 1979: An improved equation for estimating longwave radiation from the atmosphere. Water Resour. Res., 15, 1649–1650. Stewart, J. B., 1988: Modeling surface conductance of pine forests. Agric. For. Meteor., 43, 19–35. Stull, R. B., and A. G. M. Driedonks, 1987: Applications of the transilient turbulence parameterization to atmospheric boundarylayer simulations. Bound.-Layer Meteor., 40, 209–239. Tennekes, H., 1973: A model for the dynamics of the inversion above a convective boundary layer. J. Atmos. Sci., 30, 558–567. Troen, I., and L. Mahrt, 1986: A simple model of the atmospheric boundary layer: Sensitivity to surface evaporation. Bound.-Layer Meteor., 37, 129–148. van den Hurk, B. J. J. M., P. Viterbo, A. C. M. Beljaars, and A. K. Betts, 2000: Offline validation of the ERA40 surface scheme. European Centre for Medium-Range Weather Forecasts Tech. Memo. 295, 43 pp. van Ulden, A. P., and J. Wieringa, 1996: Atmospheric boundary layer research at Cabauw. Bound.-Layer. Meteor., 78, 39–69. Viterbo, P., and A. C. M. Beljaars, 1995: An improved land surface parameterization scheme in the ECMWF model and its validation. J. Climate, 8, 2716–2748. Vogelezang, D. H. P., and A. A. M. Holtslag, 1996: Evaluation and model impacts of alternative boundary-layer height formulations. Bound.-Layer Meteor., 81, 245–269. Wessels, H. R. A., 1983: Soil moisture measurements 1977–1981 at the Cabauw micrometeorology field. KNMI Tech. Rep. FM-8319, 12 pp. [Available from Royal Netherlands Meteorological Institute (KNMI), Postbus 201, 3730 AE De Bilt, Netherlands.] ——, 1984: Cabauw meteorological data tapes 1973–1984: Description of instrumentation and data processing for the continuous measurements. KNMI Tech. Rep. WR-84-6, 29 pp. [Available from Royal Netherlands Meteorological Institute (KNMI), Postbus 201, 3730 AE De Bilt, Netherlands.] Wetzel, P. J., S. Argentini, and A. Boone, 1996: Role of land surface in controlling daytime cloud amount: Two case studies in the GCIP-SW area. J. Geophys. Res., 101, 7359–7370. Wood, E. F., and Coauthors, 1998: The Project for Intercomparison of Land-surface Parameterization Schemes (PILPS) Phase 2(c) Red–Arkansas river basin experiment: 1. Experiment description and summary intercomparisons. Global Planet. Change, 19, 115–135. Xinmei, H., and T. J. Lyons, 1995: The simulation of surface heat fluxes in a land surface–atmosphere model. J. Appl. Meteor., 34, 1099–1111. Zeng, X., Y. J. Dai, R. E. Dickinson, and M. Shaikh, 1998: The role of root distribution for land climate simulation over land. Geophys. Res. Lett., 25, 4533–4536.