Article
Influence of the Drum Position Parameters and the Ranging Arm Thickness on the Coal Loading Performance Kuidong Gao 1,2, *, Changlong Du 2 , Jianghui Dong 3, * and Qingliang Zeng 4 Received: 3 August 2015 ; Accepted: 30 September 2015 ; Published: 28 October 2015 Academic Editor: Saiied Aminossadati 1 2 3 4
*
College of Mechanical & Electrical Engineering, Shandong University of Science & Technology, Qingdao 266590, China School of Mechanical & Electrical Engineering, China University of Mining & Technology, Xuzhou 221116, China;
[email protected] School of Natural and Built Environments, University of South Australia, Adelaide, SA 5095, Australia College of Mechanical & Electrical Engineering, Shandong University of Science & Technology, Qingdao 266590, China;
[email protected] Correspondence:
[email protected] (K.G.);
[email protected] (J.D.); Tel./Fax: +86-532-8605-7559 (K.G.); +61-088-357-9928 (J.D.)
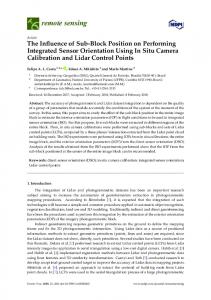
Abstract: The poor coal loading performance of a shearer drum primarily restricts the widespread application of the shearer and affects the mining efficiency in thin seam mining. The coal loading performance of the shearer drum is influenced by several factors, such as geographical environment, drum structural parameters, and motion parameters. In addition to the above factors, in the actual production, the coal loading performance of the shearer drum is also affected significantly by the drum position parameters and the structural parameters of the connected equipment, e.g., the thickness of the ranging arm. The influence of the parameters on the coal loading performance of the shearer drum was studied using a three-dimensional (3D) discrete element method (DEM) simulation in the current study, and the trends of the influential parameters were obtained. Therefore, the results of this study can provide technical guidance for thin seam shearer structural design, associated equipment selection, and mining technology selection, thus improving the mining efficiency and reducing the labor cost. Keywords: shearer drum; coal mining; discrete element method; coal loading performance; shearer structure; ranging arm
1. Introduction A thin seam refers to the coal seam thickness, which is less than 1.7 m in Europe and America. However, in China, the thickness of the thin seam is less than 1.3 m. A thin seam shearer is used for mining thin seams in China. Additionally, a medium seam shearer or a thick seam shearer is used for a coal seam thicker than 1.3 m. In China, due to the different definitions of the seam height, the working height of the thin seam shearer is lower, and the drum diameter is smaller. Furthermore, the roller blade space capacity of the seam is extremely small, and the seam shearer capacity through the space is even smaller. Due to the influence of the above-mentioned two aspects, the loading rate of the shearer drum is extremely low for the thin seam shearer in China, typically under 70%. The coal is not loaded to the scraper conveyor and becomes float coal, which is left on the shearer track. The float coal has to be manually cleaned, which increases the work load and cost. Therefore, the low coal loading rate of the shearer drum has affected the general use of the shearer in thin seam mining and the improvement in mining efficiency. Minerals 2015, 5, 723–736; doi:10.3390/min5040520
www.mdpi.com/journal/minerals
Minerals 2015, 5, 723–736
Studies on the coal loading performance of the shearer drum are relatively rare, and most of them were performed earlier. In the 1980s and 1990s, the key factors affecting the coal loading performance of the shearer drum were discussed and studied. The effects of mining conditions, structural parameters, and working parameters of the shearer and mining technology on the loading rate of the shearer drum were presented in their studies using theoretical analysis, worksite statistical analysis, and computer technology. The studies had a positive role in guiding the shearer design using a mining wall with a height greater than 1.7 m [1–4]. Based on their experiences, American scholars Peng and Chiang proposed “Longwall Mining” [5]. Several primary factors, which influenced the coal loading performance of the shearer drum, were noted, and precautions were suggested. Furthermore, Turkish mentioned that the distance of the drum to the scraper conveyor could affect the coal loading performance of the shearer drum [6]. Additionally, it was indicated that the drum with a conical hub had a better coal loading performance than that of a cylindrical hub [7]. The coal loading performance of the shearer drum can be increased using a helical vane in the form of a varying pitch and a curved generatrix [8]. An experimental modeling method was used by Liu and Gao [9–11] to study the effects of the vane helix angle, rotation speed, and pulling speed on the coal loading rate. It is difficult to directly use the research results to guide the design and usage of the thin seam shearer because most of the earlier studies focused on a medium or thick seam shearer. Although the effects of the scraper conveyor on the coal loading performance of the shearer drum were demonstrated in these studies, they were not described in detail [2,5,6]. Furthermore, the objective of their studies was also a medium or thick seam shearer, thus limiting the guidance for thin seam mining in China. The discrete element method (DEM) is a computer simulation that has been widely used in several fields, e.g., geotechnical engineering, geology, and machinery fields [12–19], and especially the screw conveying field [20–23]. In the current study, we attempted to simulate the mining and loading processes using a thin seam shearer with PFC3D (Ver.3.00) software. The primary objectives of this study were two-fold: (1) investigate the effects of the drum position parameters and the thickness of the ranging arm on the coal loading rate of the shearer drum using the DEM simulation; and (2) verify the feasibility and accuracy of the drum coal loading process simulation. 2. Mathematical Model [24] Generally, PFC3D (Itasca Consulting Group, Minneapolis, MN, USA) supports basic contact constitutive models, e.g., the contact-stiffness model, slip model, and bonding model. The contact-stiffness model is used to describe the relationship between the particle contact force and the displacement; the slip model is used to conduct the relative motion of each particle; and the bonding model is used to restrict the shear forces and the normal forces of the particles. In this study, the constitutive models of the particles were determined using the considered drum loading process and each model’s serviceable range [25,26]. 2.1. Contact-Stiffness Model Essentially, there are two types of contact models in PFC3D : a linear contact model and a Hertz-Mindlin contact model. Bonding cannot be used because tensile forces cannot be applied in the Hertz-Mindlin model. Therefore, the linear contact model has to be selected in this study; the adhesive force between the particles needs to be considered in the constitute coal seam, and the coal seams should have a certain shape before being mined. The normal contact force and the shear contact force in the linear contact model can be described in Equation (1) as follows: # Fin “ K n U n ni (1) ∆Fis “ ´K s ∆Uis
724
Minerals 2015, 5, 723–736
where Fin is2015, the5,normal contact force; ∆Fis is the shear contact force; K n is the normal contact stiffness; Minerals page–page S K is the shear contact stiffness; U n is the tangential displacement increment; ni is the unit normal n n vector; ∆UisFis the shear component the contact displacement-increment i is the number Δ Fi s is the where is the normal contact of force; shear contact force; K vector; is the and normal contact i S n of particles. stiffness; K is the shear contact stiffness; U is the tangential displacement increment; ni is the The normal contact stiffness Kn can be expressed in Equation (2) as follows: s unit normal vector;
ΔU i is the shear component of the contact displacement-increment vector; and
i is the number of particles. k n r As k n r Bs n “ r As in Equation The normal contact stiffness Kn can K be expressed (2) as follows: r Bs
kn ` kn [ A] [ B ] k kn n n r As r Bs K = [ A ] the contact where k n and k n are the normal stiffnessk of particles. + k n[ B ] n The shear contact stiffness Ks can be expressed in Equation (3) as follows:
(2) (2)
where k n [ A ] and k n [ B ] are the normal stiffness of the contact particles. r As
r Bs
k s inkEquation s s The shear contact stiffness Ks can beKexpressed (3) as follows: “ k s r As ` k s r Bs ks[ A ] k s[ B ]
where k s
r As
and k s
r Bs
K s = [ A] + ks[ B ] are the normal stiffnesskof particles. s the contact
(3) (3)
where k s [ A ] and k s [ B ] are the normal stiffness of the contact particles. 2.2. Slip Model
The slip is enforced by verifying whether the maximum static friction force is exceeded by the shearing force. The maximum static friction force is calculated using the minimum friction coefficient The slip is enforced whether the maximum static friction force is exceeded by the µ, and this friction force canby beverifying expressed in Equation (4) as follows: 2.2. Slip Model
shearing force. The maximum static friction force is calculated using the minimum friction coefficient μ, and this friction force can be expressed in sEquation (4)n as follows:
F
max
“ µ|Fi |
s
(4)
n
F max = μ | Fi | (4) The slip will occur between the two contact elements, when the shear contact force Fis meets ˇ sˇ s ˇ F ˇą F s max The. slip will occur between the two contact elements, when the shear contact force Fi meets i | Fi s |> F s max . 2.3. Bonding Model 2.3. Bonding Model are used to determine the contact between two particles. PFC3D provides two Bonding models
types of bonding models, parallel bonding contact bonding. ParallelPFC bonding can transmit 3D provides Bonding models arei.e., used to determine theand contact between two particles. two bothtypes forceofand moment while contact bonding can transmit force. Because the cutting force and the bonding models, i.e., parallel bonding and contact bonding. Parallel bonding can transmit broken mode were notwhile considered this report, contactforce. bonding canthe becutting used inforce the and simulation. bothcoal force and moment contact in bonding can transmit Because the broken coal were in this report, for contact bonding can be used the simulation. As indicated inmode Figure 1, not the considered constitutive behavior contact occurring at a in point as well as the As failure indicated in Figure 1, thebonding constitutive behavior forexpressed contact occurring at a (5) point well as the fatigue criterion of two models can be in Equation as as follows: fatigue failure criterion of two bonding models can be expressed in Equation (5) as follows:
#
c
Rn pnormalq Rn (normal) Fn cF≥nc ě F ě R cs s ptangentialq Fs ≥ Rs ( tangential)
(5)
where Rn and Rs are thethe normal bondingstrength strength particles, respectively. where Rn and Rs are normaland andthe the tangential tangential bonding of of thethe particles, respectively.
s Fmax
(a)
(b)
Figure 1. Constitutive behavior in the contact bonding model: (a) normal component of the contact
Figure 1. Constitutive behavior in the contact bonding model: (a) normal component of the contact force and (b) tangential component of the contact force. force and (b) tangential component of the contact force. 3
725
(5)
Minerals 2015, 5, 723–736 Minerals 2015, 5, page–page
3. Simulation Model Establishment 3. Simulation Model Establishment Minerals 5, page–page In the2015, thin seam mining process, the thin seam shearer has to work with the associated support In the thin seam mining process, the thin seam shearer hasto to protect work with associated supportby and conveyor equipment. The support equipment is used thethe thin seam shearer 3. Simulation Model Establishment and conveyor equipment. The support equipment is used to protect the thin seam shearer by supporting the roof of the mined-out areas. The conveyor equipment is used to ensure continuous In the thin seam mining process, the thin seam shearer has to work with the associated support supporting the roof of the mined-out areas. The conveyor equipment is used to ensure continuous mining by loading the fallen coal. A thin seam shearer in operation is depicted in Figure 2. In an andmining conveyor equipment. support equipment isin used to protect the thin seam2.shearer bythe mining by loading the fallen coal. A thincoals seam shearer operation is depicted inHowever, Figure In an ideal ideal condition, all ofThe the fallen are conveyed onto the scrapers. some of supporting the roof of the mined-out areas. The conveyor equipment is used to ensure continuous mining condition, all ofinto the the fallen coals are conveyed onto the scrapers. However, the fallen fallen coals are thrown mined-out area or the bottom of the drum due some to theofeffect of the mining loadinginto the the fallen coal. A thin seam shearer in operation is depicted in Figure anhelical ideal coals arebythrown mined-out area or the bottom of the drum due to the effect 2. of In the helical vanes. Additionally, because of the ranging arm, parts of the fallen coal loaded at the bottom miningAdditionally, condition, allbecause of the fallen coals are conveyed onto the fallen scrapers. of the fallen vanes. of the ranging arm, parts of the coalHowever, loaded atsome the bottom of the of the drum are bounced back and become float coal or circling coal, whereas the other parts that coals are theand mined-out theorbottom the drum duethe to the effect ofthat the helical drum are thrown bouncedinto back become area float or coal circlingofcoal, whereas other parts are not are not bounced back are ejected. Because there is a considerable distance between the coal wall and vanes. Additionally, because of the ranging parts of thedistance fallen coal loadedthe at coal the bottom of the bounced back are ejected. Because there is arm, a considerable between wall and the thedrum middle groove ofback the and scraper conveyor, a few of the coal, coalswhereas are loaded in this areathat and become are bounced become float coal or circling the other parts are not middle groove of the scraper conveyor, a few of the coals are loaded in this area and become float float coal onback the shearer track. Thus, it appears that the drum position parameters andwall the and associated bounced are ejected. Because there is athat considerable the and coal the coal on the shearer track. Thus, it appears the drum distance position between parameters the associated equipment’s structural parameters have a significant effect on the coal loading rate. middle groove of the scraper conveyor, few of the effect coals are loaded this area equipment’s structural parameters have a significant on the coal in loading rate.and become float coal on the shearer track. Thus, it appears that the drum position parameters and the associated equipment’s structural parameters have a significant effect on the coal loading rate.
Figure 2. Shearer in operation. Figure 2. Shearer in operation. 2. Shearer in operation. The drum position is illustratedFigure in Figure 3, where Dc is the drum diameter; G represents the The drum position is illustrated in Figure 3, where Dcarm; is the drum diameter; G represents distance between the bottom of the drum and the ranging S represents the distance from thethe The drum position is illustrated in Figure 3, where D c is the drum diameter; G represents distance between the bottom of the drum and the ranging arm; S represents the distance lowest section of the drum to the middle groove of the scraper conveyor; B is the thicknessfrom of the thethe distance between the bottom of the drum and the ranging arm; S represents the distance from the lowest section drum from to thethe middle groove to of the thefloor; scraper B is the thickness ranging arm; of I isthe distance drum bottom andconveyor; L is the distance between the of cellthe lowest section thegroove drum to groove of the the scraper conveyor; isown the thickness ranging arm; is of distance from the middle drum bottom to floor; L isdrum’s theBdistance betweenofthe wall and theI middle of the scraper conveyor. Because Dand c is the parameter, I the cancell ranging arm; is and distance from drum bottom to Because the L conveyor isdrum’s the distance between theIonce cell be be reduced byIS, the height of the middle groove of floor; the scraper (L) is parameter, determined wall and the middle groove of thethe scraper conveyor. Dand own can c is the wall and the middle groove of the scraper conveyor. Because D c is the drum’s own parameter, I can the scraper conveyor is selected; thus, the effects of parameters B, S and L determined on the conveying reduced by S, and the height of the middle groove of the scraper conveyor (L) is once the be reduced bywere S, and the heightin ofthis the middle of the scraper conveyor (L) is determined once performance investigated study.ofgroove scraper conveyor is selected; thus, the effects parameters B, S and L on the conveying performance the scraper conveyor is selected; thus, the effects of parameters B, S and L on the conveying were investigated in this study.
performance were investigated in this study.
Figure 3. Drum position. Figure 3. Drum position. In China, the thin seam shearer used for mining Figure 3. Drumprimarily position. includes a front drum for ejection and a back drum for pushing. The drum and its simplified model are illustrated in Figure 4. Moreover, In China, the thin seam shearer used for mining primarily includes a front drum for ejection and the back drum has poor coal loading performance because the primary coal loading area is hindered a back drumthe forthin pushing. drum andfor its mining simplified model are illustrated in Figure 4. Moreover, In China, seamThe shearer used primarily includes a front drum for ejection and by the ranging arm. The front drum is primarily responsible for the coal loading due to the poor coal the back drum has poor coal performance because the primary coal loading area is4.hindered a back drum for pushing. Theloading drum and its simplified model are illustrated in Figure Moreover, by the ranging arm. The front drum is primarily responsible for the coal loading due to the poor coal 4 726 4
Minerals 2015, 5, 723–736
the back drum has poor coal loading performance because the primary coal loading area is hindered by the ranging arm. The front drum is primarily responsible for the coal loading due to the poor coal loading performance of the back drum. Thus, the front drum was the primary objective in this 2015, 5, page–page study.Minerals Additionally, the effects of the drum position parameters and the thickness of the ranging arm on the coal loading performance were predicted. The scraper-based shearer could select from loading performance of the back drum. Thus, the front drum was the primary objective in this study. Minerals 2015, 5, page–page the following mining options: front drum to cut the roof, back drum to cut the bottom, front drum Additionally, the effects of the drum position parameters and the thickness of the ranging arm on the to cutcoal theloading bottom, and back drum to cut theThe roof (Figure 2). shearer However, the floor-based shearer could performance scraper-based could select from in thethis following loading performance of thewere backpredicted. drum. Thus, the front drum was the primary objective study. only mining use theoptions: front drum drum for cutting theroof, bottom and the drum forfront sweepingtothe Hence, the to cut the back drum to back cut cutroof. the bottom, Additionally, thefront effects of the drum position parameters andthe thebottom, thickness of drum the ranging arm on the valueand of S could be negative or positive. By analyzing the parameters of the thin seam shearer back drum to cut the roof (Figure 2). However, the floor-based shearer could only use the front and coal loading performance were predicted. The scraper-based shearer could select from the following drum for cutting the bottom and the back drum for sweeping the roof. Hence, the value of S could the associated scraper conveyor equipment, which are made in China, the actual value of B is be greater mining options: front drum to cut the roof, back drum to cut the bottom, front drum to cut the bottom, negative or positive. By analyzing the parameters of the thin seam shearer and the associated scraper than 450 The Gtovalue is within 200 mm, and thethe L value is greater thancould 250 mm. To compare and mm. back drum cut the roof (Figure 2). However, floor-based shearer only use the front with conveyor equipment, which are made in drum China, actual value of BHence, is greater 450 mm. drum cutting the bottom and the back forthe sweeping the roof. the value of of S could beG on the test, theforactual values of the simulation parameters were scaled down bythan a ratio 1:2The based value is within 200 mm, and the L value is greater than 250 mm. To compare with the test, the actual negative or positive. analyzing the parameters of the thin seam and the associated scraper the similarity theory. InBy our simulations, Dc , cutting depth, vaneshearer diameter, and drum hub diameter values of the simulation parameters were scaled down by a ratio ofof1:2 based on the similarity theory. conveyor equipment, which are made in China, the actual value B is greater than 450 mm. The G 300, were 600, 530, 500 and 240 mm, respectively. The G value is 100 mm. The values of B were 275, In ourissimulations, Dc, cutting vane diameter, hub diameter were and value within 200 mm, and thedepth, L value is greater thanand 250 drum mm. To compare with the600, test,530, the500 actual 325 and 350 mm. The values of S were 100 ´120, ´60, 0, 60, 120 and 180 mm. The values of L were 150, 240 mm, The G value is mm. The values of B were 300, and 350 mm. The values of respectively. the simulation parameters were scaled down by a ratio of 1:2 275, based on 325 the similarity theory. 200, 250 andof300 mm.−120, The −60, height of 120 the and middle mm. groove ofvalues the scraper conveyor 120and mm. Tomm. achieve values S were 0, 60, L diameter were 150,were 200,is600, 250 In our simulations, Dc, cutting depth, vane 180 diameter,The and drum of hub 530, 300 500 and the desired simulation results and reduce the simulation time, the ranging arm was simplified The of the middle groove of the scraper is 120 To275, achieve the desired 240 height mm, respectively. The G value is 100 mm.conveyor The values of Bmm. were 300, 325 and 350simulation mm. The to a combination of a closed cube and a closed cylinder, and the shovel board of the scraper results the simulation time, the180 ranging armvalues was simplified a combination a closed values and of S reduce were −120, −60, 0, 60, 120 and mm. The of L wereto150, 200, 250 andofconveyor 300 mm. and cube and a closed cylinder, and the shovel board of the particles scraper conveyor and the were replaced the ledge were replaced bygroove tilting The that moved toledge the right of the tilting The height of the middle oftetrahedrons. the scraper conveyor is 120 mm. To achieve the desired simulation by tilting tetrahedrons. Theasparticles that moved to fixed the tetrahedrons were was results and reduce the simulation time, the ranging arm was right simplified to tilting a combination of a closed tetrahedrons were considered loaded coal. A grey wallofof the tilting tetrahedrons, which considered as loaded coal. A grey fixed wall of tilting tetrahedrons, which was parallel to the ground, cube and a closed cylinder, and the shovel board of the scraper conveyor and the ledge were replaced parallel to the ground, was set between the scraper conveyor and the coal wall. A certain height was set between scraper conveyor and themoved coal wall. A certain to betetrahedrons ensured to prevent bybetilting tetrahedrons. The particles that the rightheight ofconveyor, thehad tilting were the had to ensured tothe prevent particle accumulation attothe scraper which could worsen particle accumulation at the conveyor, whichtetrahedrons, could worsenwhich the conveying performance. The considered as loaded coal. A scraper grey fixed wall of tilting was parallel to the ground, conveying performance. The simulation model is illustrated in Figure 5, where the particle diameter simulation modelthe is scraper illustrated in Figure where particle diameter 30 to mm, the particle friction was set between conveyor and5,the coal the wall. A certain height is had be ensured to prevent is 30 factor mm, the particle friction factor is0.6, 0.8,and thethe wall friction factor is 0.6, and the particle stiffness is is accumulation 0.8, the wall friction factor isconveyor, particle stiffness 1 ×conveying 104 N·m. The statistical zone particle at the scraper which could worsenisthe performance. The 4 N¨ m. The statistical zone of the effective loaded particle is depicted in Figure 6, and the coal 1 ˆ 10 of the effective loaded particle is Figure and thediameter coal loading based simulation model is illustrated indepicted Figure 5,in where the6,particle is 30rate mm,was thecalculated particle friction loading rate was calculated based onisthe particle mass.is 1 × 10⁴ N·m. The statistical zone on the statistical particle mass. factor is 0.8, the wall friction factor 0.6,statistical and the particle stiffness of the effective loaded particle is depicted in Figure 6, and the coal loading rate was calculated based on the statistical particle mass.
Figure 4. Drum and its simplified model.
Figure 4. Drum and its simplified model. Figure 4. Drum and its simplified model.
Figure 5. Simulation model of ranging arm. Figure 5. Simulation model of ranging arm.
Figure 5. Simulation model of ranging arm.
727 5 5
Minerals 2015, 5, 723–736
Minerals 2015, 5, page–page
Figure 6. Statistical zone of the effective loaded particle. Figure 6. Statistical zone of the effective loaded particle.
3. Results and Discussion 4. Results and Discussion 3.1. Effects of the Distance Between the Coal Wall and the Scraper Conveyor Middle Groove on the Drum Coal 4.1. Effects of the Distance Between the Coal Wall and the Scraper Conveyor Middle Groove on the Drum Loading Performance Coal Loading Performance To investigate investigate the the conveying thethe drum bottom S inS the To conveying performance performance influenced influencedby bythe theheight heightofof drum bottom in middle groove of the conveyor, the loading rate was underunder different rotation speed the middle groove of scraper the scraper conveyor, the loading ratesimulated was simulated different rotation and pulling speedspeed combinations. The The S values were −120, −60, 0, 0, 60,60,120 the speed and pulling combinations. S values were ´120, ´60, 120and and180 180 mm. mm. In In the simulations, BB and and LL are are 350 350 and and 250 250 mm, mm, respectively. respectively. Figure Figure 77 demonstrates demonstrates the the simulation simulation result result simulations, when the speed is 2 m/min and the rotation speed is 60 r/min. when the speed is 2 m/min and the rotation speed is 60 r/min. As indicated indicated in in Figure Figure7, 7, the the number numberof ofyellow yellowand andblue blue particles particleswas wasthe the highest, highest,white whiteparticles particles As took second second place, place, followed followed by by red red and and green greenparticles, particles,and andorange orangeparticles particlesalmost almostdid didnot notexist. exist. ItIt took was illustrated that the closer the particles were to the inner position, the more difficult it was to be be was illustrated that the closer the particles were to the inner position, the more difficult it was to conveyed out. The accumulation surface was primarily composed of yellow particles, especially the conveyed out. The accumulation surface was primarily composed of yellow particles, especially the space between between the the scraper scraper conveyor conveyor and and the the coal coal wall. wall. This This is is because because the the coal coal wall wall was was cut cut from from space inside to outside by the pick, and the yellow particles were the closest to the shearer; thus, they were inside to outside by the pick, and the yellow particles were the closest to the shearer; thus, they were the last last ones ones to to be be cut cut and and conveyed conveyed in in each each rotation rotation of of the the drum. drum. Additionally, Additionally, aa few few of of the the particles particles the were ejected to the upside of the ranging arm, which was accorded with the practical results. Then, were ejected to the upside of the ranging arm, which was accorded with the practical results. Then, the effectiveness of the DEM was verified again. However, there were no significant differences in the the effectiveness of the DEM was verified again. However, there were no significant differences in number of loaded particles under the six conditions (Figure 7). The for this was the number of loaded particles under the different six different conditions (Figure 7). key The reason key reason for this that that a few of the particles were conveyed toto the particles were were was a few of the particles were conveyed thestatistical statisticalarea areawhereas whereasmost most of of the the particles accumulated between the scraper conveyor and the coal wall. The simulation results for different accumulated between the scraper conveyor and the coal wall. The simulation results for different SS values were were obtained obtained in in18 18seconds, seconds,and andthe thestatistical statisticalresults resultsare areprovided providedin inTable Table1.1. values
Figure7. 7. Cont. Cont. Figure
728 6
Minerals 2015, 5, 723–736
Minerals 2015, 5, page–page
Figure 7. Simulation results for different S values. Figure 7. Simulation results for different S values. Table 1. Simulation statistical results for different S values. Table 1. Simulation statistical results for different S values. Hauling Speed Rotation Vane Helix S Value Particle Accumulation Particle Loading (m/min) Speed (r/min) Angle (°) (mm) Mass (kg) Rate (%) Hauling Rotation Vane Helix Particle Accumulation Particle Loading S Value (mm) 2 60 −120 14.34 23.73 Speed (m/min) Speed (r/min) Angle21 (˝ ) Mass (kg) Rate (%) 2 60 21 −60 13.98 22.55 2 60 21 ´120 14.34 23.73 0 12.28 20.13 22 6060 21 21 ´60 13.98 22.55 22 6060 21 21 060 12.28 20.13 12.44 20.41 22 6060 21 21 60 12.44 20.41 120 15.38 26.23 2 60 21 120 15.38 26.23 2 60 21 180 15.247 26.17 2 60 21 180 15.247 26.17 −120 14.97 24.45 22 9090 21 21 ´120 14.97 24.45 22 9090 21 21 ´60 13.66 22.57 −60 13.66 22.57 2 90 21 0 12.55 20.60 2 90 21 0 12.55 20.60 2 90 21 60 14.43 24.02 60 14.43 24.02 22 9090 21 21 120 16.67 28.45 120 16.67 28.45 22 9090 21 21 180 16.58 28.28 22 9090 15 21 ´120 13.35 22.00 180 16.58 28.28 2 90 15 ´60 11.83 19.33 2 90 15 −120 13.35 22.00 2 120 15 ´120 17.55 29.01 −60 11.83 19.33 22 12090 15 15 ´60 16.01 27.13 22 120 15 15 0 16.78 28.24 120 −120 17.55 29.01 22 120 15 15 60 16.67 27.86 120 −60 16.01 27.13 2 120 15 120 19.05 31.31 120 0 16.78 28.24 22 120 15 15 180 19.34 31.77 2 120 15 60 16.67 27.86 2 120 15 120 19.05 31.31 The 2loading rate first Table 1). 120increased and 15then decreased 180 with an increase 19.34 in S (Figure 8 and 31.77
If S reached a certain value, the loading rate would remain constant. First, the L value was larger, and most the coal particles could not load indecreased the statistical with the in action of the8drum. Then, The of loading rate first increased and then witharea an increase S (Figure and Table 1). they were accumulated in the between the remain coal wall and theFirst, scraper If S reached a certain value, theregion loading rate would constant. the Lconveyor, value waswhich larger,was and known thecoal L area in thecould study.not When ´120 mm,area the with motion particles most ofasthe particles load S inwas the statistical thetraces actionof ofthe the ejection drum. Then, they were by the particlesthe and remained thescraper L area. conveyor, At that point, there were no wereimpeded accumulated inaccumulated the region between coal wall andinthe which was known obstacles on both sides of the L area, and the coal particles then accumulated naturally to a modest as the L area in the study. When S was −120 mm, the motion traces of the ejection particles were peak. Because of the gravitational attraction, particles both positions. A portion them impeded by the accumulated particles and the remained inslid the on L area. At that point, there of were no slid to the drum and moved again under the activity of the vane, and another part slid to the statistical obstacles on both sides of the L area, and the coal particles then accumulated naturally to a modest area, improving coal loading rate. peak.thus Because of thethe gravitational attraction, the particles slid on both positions. A portion of them with an increase in the of theand drum, the part blockade on the slid Subsequently, to the drum and moved again under therelative activityheight of the vane, another slid toeffect the statistical ejected particles was weakened. As the wall height on the left continually increased, the amount of area, thus improving the coal loading rate. particles needed to bewith increased to reach balance the L area. Within a effect certainon wall Subsequently, an increase in the the accumulated relative height of theindrum, the blockade the height, accumulated particles were intended to play leading role, whichincreased, reduced the ejectedthe particles was weakened. As the wall height on athe left continually theamount amountofof particles the loading area and led to a decrease in the loading rate. particlesinneeded to be increased to reach the accumulated balance in the L area. Within a certain wall Lastly, blockade effect on the ejected particles continued to role, decrease as reduced the S value height, the the accumulated particles were intended to play a leading which theincreased. amount of Additionally, the accumulation angle gradually increased to a maximum, which illustrated that the particles in the loading area and led to a decrease in the loading rate. number of accumulated particles had reached a stable state. Thus, the quantity of particles that Lastly, the blockade effect on the ejected particles continued to decrease as the S value increased.
Additionally, the accumulation angle gradually increased to a maximum, which illustrated that the number of accumulated particles had reached a729 stable state. Thus, the quantity of particles that were 7
Minerals 2015, 5, 723–736 Minerals 2015, 5, page–page
were loaded in the statistical area increased. The axial and tangential velocities of the particles after loaded in the statistical increased. Theon axial tangential velocities the particles after [27]. coming coming in contact with thearea vane depended theand drum rotation and theofvane helix angle In the ˝ in contact with the vane depended on the drum rotation and the vane helix angle [27]. In the simulation, the vane helix angle and the drum rotation were 21 and 60 r/min, respectively, and the simulation, vane helix and the drum rotation were m/min 21° and 60 r/min, and the particles' axial the velocity and angle tangential velocity were 18.16 and 22.45respectively, m/min, respectively. particles' axialangle velocity were 18.16 and 22.45 respectively. When the helix wasand 21˝tangential and the velocity drum rotation wasm/min 90 r/min, the m/min, axial velocity and the When the helix angle was 21° and the drum rotation was 90 r/min, the axial velocity and the tangential tangential velocity of the particles were 27.2 and 33.76 m/min, respectively. When the helix angle velocity of the particles were 27.2 and 33.76 m/min, respectively. When the helix angle decreased to decreased to 15˝ and the drum rotation increased to 120 r/min, the axial velocity and the tangential 15° and the drum rotation increased to 120 r/min, the axial velocity and the tangential velocity of the velocity of the particles were 29.5 and 29.47 m/min, respectively. When the axial velocity reached particles were 29.5 and 29.47 m/min, respectively. When the axial velocity reached the above values, the above values, the not particles were not in directly loadedarea in the areaand but they in the L area, the particles were directly loaded the statistical butstatistical in the L area, were evenand theyejected were even ejected from the top of the drum. The loading rate was essentially the same from the top of the drum. The loading rate was essentially the same when S was 120 when and S was 180 120mm andbecause 180 mm the same numberwas of particles needed to balance the accumulation, thebecause same number of particles needed towas balance the accumulation, which caused which the same amounttoofbe particles to be loaded into the loading area. thecaused same amount of particles loaded into the loading area.
Figure 8. Variations in the particle mean loading rate for various S values. Figure 8. Variations in the particle mean loading rate for various S values.
As indicated in Figure 8, when the vane helix angle was 15° and the rotation speed was ˝ and the rotation speed was As r/min, indicated in Figure 8, when vane helix the angle 120 the loading rate was greaterthe than that when vanewas helix15angle was 21° and the rotation 120 r/min, the loading rate was greater than that when the vane helix angle was 21˝ was and less the than rotation speed was 90 r/min. This is primarily because the cutting depth used in the simulation speed was 90 r/min. This is primarily because the cutting depth used in the simulation was less the maximum theoretical value. Compared with the theoretical analysis, a smaller tangential velocitythan the maximum value. the theoretical and a largertheoretical axial velocity wereCompared obtained inwith the DEM simulation.analysis, a smaller tangential velocity Additionally, whenwere S ≤ 0obtained mm and the helix angle was 21°, the loading rate was essentially the and a larger axial velocity in the DEM simulation. ˝ , theprimarily same as when the rotation was the 90 and 60angle r/min.was This21 result the the Additionally, when S ď 0speed mm and helix loading occurred rate was because essentially movement of the particle output was blocked by the accumulated particles in the L area. Moreover, same as when the rotation speed was 90 and 60 r/min. This result primarily occurred because the the particles ejected to both of the and accumulated behind theL ranging arm. movement of thewere particle output wassides blocked by drum the accumulated particles in the area. Moreover, Furthermore, these particles were stopped due to the larger thickness and lower height of the ranging the particles were ejected to both sides of the drum and accumulated behind the ranging arm. arm, thus they could not enter the L area, which resulted in the same loading rate as when S ≤ 0 mm. Furthermore, these particles were stopped due to the larger thickness and lower height of the ranging However, when the S value continued to increase (S ≥ 0), the loading rate was greater when the arm, thus they could not enter the L area, which resulted in the same loading rate as when S ď 0 mm. rotation speed was 90 r/min compared to when the rotation speed was 60 r/min. The distance between However, when the Sofvalue increase ě 0), thewith loading rate was greater the bottom surface the L continued area and thetoranging arm(Sincreased an increase in the height when of the the rotation speed was 90 r/min compared to when the rotation speed was 60 r/min. The distance ranging arm, and this distance was larger than the height of the particles naturally accumulated on between the bottom surface of the L area and the ranging arm increased with an increase in the height the rear of the drum. There was a length of 100 mm between the coal wall and the ranging arm, and of the arm, and this distance larger to than height of the this particles accumulated a ranging large number of particles, whichwas belonged thethe L area, entered field. naturally If the height of the accumulated this area then the wouldarm, on the rear of theparticles drum. inThere wasexceeded a lengththe of natural 100 mmaccumulation between theheight, coal wall andparticles the ranging to the statistical areas; hence, the loading ratetowas the rotation speed washeight 90 r/min and slide a large number of particles, which belonged thegreater L area,when entered this field. If the of the compared to that of 60 r/min. accumulated particles in this area exceeded the natural accumulation height, then the particles would It can be understood from the research thatgreater the loading bespeed smaller without slide to the statistical areas; hence, the above loading rate was whenrate the would rotation was 90 r/min considering the ranging arm and the distance L, when it exists. In the simulation, the loading rate compared to that of 60 r/min. reached a minimum value when the drum bottom had the same height as that of the middle groove It can be understood from the above research that the loading rate would be smaller without of the scraper conveyor. The coal loading was improved to a certain extent by increasing the S value
considering the ranging arm and the distance L, when it exists. In the simulation, the loading rate reached a minimum value when the drum bottom8 had the same height as that of the middle groove 730
Minerals 2015, 5, 723–736
of the scraper conveyor. The coal loading was improved to a certain extent by increasing the S value Minerals 2015, 5, page–page or the drum rotation speed on the premise that the cutting depth was smaller than the theoretical upper value. or limit the drum rotation speed on the premise that the cutting depth was smaller than the theoretical upper limit value.
4.2. Effects of the Distance Between the Coal Wall and the Middle Groove of the Scraper Conveyor on the Drum Coal Loading Performance
3.2. Effects of the Distance Between the Coal Wall and the Middle Groove of the Scraper Conveyor on the Drum Coal Loading Performance Based on the above research, due to the accumulated coal in the L area after being outputted from
the drum, the actual of the due coaltoloading decreased, and performance Based on the quantity above research, the accumulated coal in the the following L area afteroutput being outputted was from blocked, thethe coalcoal loading performance. result indicates that it is the thus drum,negatively the actualimpacting quantity of loading decreased, This and the following output necessary to consider the influence L on the impacting coal loading the design of the scraper performance was blocked, thus of negatively therate coalinloading performance. This conveyor result thatThus, it is necessary to consider the the influence of L on the coal loading rate inand the design of the and indicates the drum. the influence of L on coal loading rate was simulated analyzed using 3D software. scraper conveyor and thesimulations, drum. Thus, the of LBon= the loading rate simulated and200, the PFC In the S =influence 60 mm and 350coal mm, and the L was values were 150, 3D software. In the simulations, S = 60 mm and B = 350 mm, and the L values usingwhere the PFC 250 analyzed and 300 mm the rotation speed was 60 r/min and the pulling speed was 2 m/min. The were 150, 200, 250 and 300 mminwhere simulation results were obtained 18 s. the rotation speed was 60 r/min and the pulling speed was 2 m/min. The simulation results were obtained in 18 s. In Figure 9, the loaded particles are mostly yellow, with a few white and red, which illustrated In Figure 9, the loaded particles are mostly yellow, with a few white and red, which illustrated that the inner particles were hard to output, even if the distance between the coal wall and the middle that the inner particles were hard to output, even if the distance between the coal wall and the middle groove of the scraper conveyor was varied. As seen from the accumulated particles figure, the surface groove of the scraper conveyor was varied. As seen from the accumulated particles figure, the surface of the area is covered in yellow. With an an increase in in the L value, in the of Lthe L area is covered in yellow. With increase the L value,the theamount amountof ofparticles particles loaded loaded in statistical area clearly The simulation statistical resultsresults for different L values are provided the statistical area decreased. clearly decreased. The simulation statistical for different L values are in Table 2, and the time was 18 s. provided in Table 2, and the time was 18 s.
L = 150 mm
L = 200 mm
L = 250 mm
L = 300 mm
Figure 9. Simulation results for different L values.
Figure 9. Simulation results for different L values. Table 2. Simulation statistical results for different L values.
Table 2. Particle Simulation statistical results for different LParticle values. Particle Mean Mean Particle Mean Velocity in Velocity in Velocity in Accumulated Mass Particle(m/s) Mean Y-Direction Particle (m/s) Mean Z-Direction Particle Mean X-Direction (m/s) (kg) Particle Accumulated L Value (mm) Velocity in Velocity in Velocity in Mass (kg) 150 0.0124 0.0102 (m/s) 0.0202 (m/s) 42.93 X-Direction (m/s) Y-Direction Z-Direction 200 0.0121 0.0098 0.0139 26.71 150 0.0124 0.0102 0.0202 42.93 200 0.0121 0.0098 0.0139 26.71 250 0.0111 0.0082 0.0124 12.44 250 0.0111 0.0082 0.0124 12.44 300 0.0114 0.0078 0.0096 4.32 L value (mm)
300
0.0114
0.0078
0.0096
9
731
4.32
Particle Loading Rate (%) Particle Loading Rate (%) 52.67 38.61 52.67 38.61 20.41 20.41 7.54 7.54
Minerals 2015, 5, 723–736
Minerals 2015, 5,velocity page–pagein the Y and Z directions, the accumulated mass of the loaded particles, and The mean the loading rate decreased with an increase in the L value (Table 2). The mean velocity in the X The mean Z directions, the accumulated mass ofThe thevariation loaded particles, and direction was less velocity affectedinbythe theYLand value, and the trend was not obvious. in the particle the loading rate decreased with an increase in the L value (Table 2). The mean velocity in the X mean velocity in the Y direction and the particle loading rate for different L values can be analyzed direction was less affected by the L value, and the trend was not obvious. The variation in the particle based on Table 2, and the trend is illustrated in Figure 10. The particle loading rate decreased linearly mean velocity in the Y direction and the particle loading rate for different L values can be analyzed with a decrease in the L value. The relationship between the average velocity in the Y direction and based on Table 2, and the trend is illustrated in Figure 10. The particle loading rate decreased linearly the L values had a similar trend; however, it was not an obvious linear trend compared with the with a decrease in the L value. The relationship between the average velocity in the Y direction and relationship between loading and the values, is because the particles pass the L values had a the similar trend;rate however, it L was not anwhich obvious linear trend comparedshould with the therelationship L area first between and thenthe load in the statistical area. The movement in the Y direction was complex loading rate and the L values, which is because the particles should pass the dueLto thefirst existing L area. witharea. the loading rate forinanthe LY value of 150 and 300 mm, was area and then loadCompared in the statistical The movement direction was complex dueitto determined thatL the loading rate was the distance between the coal wall the existing area. Compared withsignificantly the loading influenced rate for an by L value of 150 and 300 mm, it was anddetermined the middlethat groove of the scraper conveyor, and influenced the loadingbyrate for a 10 the loading rate was significantly thereduced distance 3% between themm coalincrease wall in the value. the should be minimized in the of3% theforscraper conveyor and andLthe middleThus, groove of L thevalue scraper conveyor, and the loading ratedesign reduced a 10 mm increase in L value. Thus, the L value should be minimized in the design of the scraper conveyor and the shearer. thethe shearer.
Figure 10. Variations in the particle’s Y direction mean velocity and the particle loading rate for
Figure 10. Variations in the particle’s Y direction mean velocity and the particle loading rate for different L values. different L values.
3.3. Effects of the Thickness of the Ranging Arm on the Drum Coal Loading Performance
4.3. Effects of the Thickness of the Ranging Arm on the Drum Coal Loading Performance The particle outputs could be blocked by the ranging arm, and the particles were more likely to particle bearm, blocked bywould the ranging and in thethe particles more the likely beThe blocked by aoutputs thicker could ranging which cause aarm, decrease loading were rate. Thus, to be blocked by aofthicker ranging which would cause a decrease in themodel loading Thus, particle output the drum was arm, studied using the established simulation for rate. different thethicknesses particle output of the drum was studied using the established simulation model for different of the ranging arm (275, 300, 325 and 350 mm) (Figure 11). In these simulations, S was thicknesses of Lthe ranging arm (275, 325 speed and 350 (Figure In these simulations, S was 60 mm, and was 260 mm. When the300, rotation wasmm) 60 r/min and11). the pulling speed was 2 m/min, 60 mm, and Lofwas mm. the rotation speedyellow was 60 r/min When and the speed was the surface the 260 L area wasWhen primarily covered with particles. thepulling thickness of the rangingthe arm B wasof 275 300 was mm,primarily red, green,covered blue and white particles appeared in the thickness statistical of 2 m/min, surface theand L area with yellow particles. When andarm the red, green, and 300 bluemm, particles were evenly distributed. When B was 325 in and mm, thearea, ranging B was 275 and red, green, blue and white particles appeared the350 statistical the particles in the statistical area were primarily yellow, with a few other colors. This result indicated area, and the red, green, and blue particles were evenly distributed. When B was 325 and 350 mm, the that the had a strong capacity because the aB few was other a smaller value. Furthermore, we particles indrum the statistical areaconveying were primarily yellow, with colors. This result indicated determined that the mean velocity in the Y direction and the loading rate exhibited a general tendency that the drum had a strong conveying capacity because the B was a smaller value. Furthermore, we to decrease with an increasing B value when the rotation speed was 60 r/min and the pulling speed determined that the mean velocity in the Y direction and the loading rate exhibited a general tendency was 2 m/min (Table 3). The mean velocity in the X and Z directions had no significant relationship to decrease with an increasing B value when the rotation speed was 60 r/min and the pulling speed with the thickness of the ranging arm. The variations in the particle Y direction mean velocity and the was 2 m/min (Table 3). The mean velocity in the X and Z directions had no significant relationship particle loading rate for different B values are provided in Figure 12. From the fitted curves, the mean with the thickness of the ranging arm. The variations in the particle Y direction mean velocity and the velocity in the Y direction and the loading rate decreased as a quadratic function with an increase in particle rate for different B values are between providedthem. in Figure 12. From the fitted curves, mean the Bloading value, but there was a large difference This result occurred because the Lthe value velocity in the Y direction and the loading rate decreased as a quadratic function with an increase was greater in the simulation; thus, the particles could not be directly conveyed to the statistical area in theand B value, butthe there was a large difference between blockages them. This occurred thein L the value entered L area first. Along with the different of result the ranging arm,because the change wasmean greater in the simulation; thus, particleshowever, could not be directly conveyed area velocity in the Y direction was the complicated; it was similar to the trendsto ofthe the statistical loading rate. 10
732
Minerals 2015, 5, 723–736
and entered the L area first. Along with the different blockages of the ranging arm, the change in the mean velocity in the Y direction was complicated; however, it was similar to the trends of the loading rate.2015, 5, page–page Minerals Minerals 2015, 5, page–page
B = 275 mm B = 275 mm
B = 300 mm B = 300 mm
B = 325 mm
B = 350 mm
B Figure = 325 mm B = 350 mm Simulationresults results for Figure 11.11. Simulation for different differentBBvalues. values. Figure 11. Simulation results for different B values. Table 3. Simulation statistical results for different B values. B VValue (mm) B VValue
B Value (mm)
(mm) 275
300 275 275 300 325 300 325 350 350 325
350
Table 3. Simulationstatistical statistical results results for Table 3. Simulation fordifferent differentBBvalues. values. Particle Mean Particle Mean Particle Mean Particle Particle Velocity in Velocity in Velocity in Accumulated Loading Particle Mean Particle Mean Particle Mean Particle Particle Particle Mean Particle Mean Particle Mean Particle Accumulated Loading X-Direction (m/s) Velocity Y-Direction (m/s) Velocity Z-Direction (m/s) Mass (kg) Particle Rate (%) Velocity in in in in Velocity Velocity in Velocity in MassAccumulated Loading (kg) Rate (%) X-Direction (m/s) Y-Direction0.0088 (m/s) Z-Direction (m/s) 0.0109 0.0108 14.41 20.88 X-Direction (m/s) Y-Direction (m/s) Z-Direction (m/s) Mass (kg) Rate (%) 0.012 19.04 0.0109 0.00880.0086 0.0108 0.0138 14.41 13.3 20.88 0.0109 0.0088 0.0108 14.41 20.88 0.012 0.00860.0083 0.0138 0.0108 13.3 10.95 19.04 0.0122 18.78 0.012 19.04 0.0122 0.00830.0086 0.0108 0.0138 10.95 13.3 18.78 0.0118 0.0082 18.23 0.0118 0.00820.0083 0.0121 0.0121 10.84 10.84 18.23 0.0122 0.0108 10.95 18.78 0.0118
0.0082
0.0121
10.84
18.23
Figure 12. Variations in the particles’ Y direction mean velocity and the particle loading rate for different B values. Figure 12. Variations in the particles’ Y direction mean velocity and the particle loading rate for Figure 12. Variations in the particles’ Y direction mean velocity and the particle loading rate for different B values.
In previous different B values.studies, for a greater drum rotation speed, the ejection effect of the vane on the particles was more evident. Additionally, in certain cases, for a higher position of the particles on the In previous studies, for a greater drum rotation speed, the ejection effect of the vane on the 11 cases, for a higher position of the particles on the particles was more evident. Additionally, in certain
733 11
Minerals 2015, 5, 723–736
Minerals 2015, 5, page–page
In previous studies, for a greater drum rotation speed, the ejection effect of the vane on the exit of thewas drum, the blockage became worse with ancases, increase the thickness To particles more evident. Additionally, in certain for ainhigher positionof ofthe theranging particlesarm. on the confirm this theory and study the influence of the thickness of the ranging arm on the loading rate exit of the drum, the blockage became worse with an increase in the thickness of the ranging arm. for confirm differentthis rotation an additional study wasthickness conducted the DEM. results are To theoryspeeds, and study the influence of the of using the ranging arm The on the loading provided in Tablerotation 4 and Figure illustrate loading rate decreased increase rate for different speeds,13, anwhich additional studythat wasthe conducted using the DEM.with Thean results are in the thickness of 4the ranging As indicated in Figure the rate of decrease the loading rate provided in Table and Figurearm. 13, which illustrate that the13, loading rate decreasedofwith an increase was similar for 90ofand r/min,arm. whereas the loadinginrate changed slightly fordecrease 60 r/min.ofIf the the rotation in the thickness the120 ranging As indicated Figure 13, the rate of loading speed was slower, the particles would slide to the L area directly along the ranging arm due the rate was similar for 90 and 120 r/min, whereas the loading rate changed slightly for 60 r/min. to If the lower exit, smaller contact area with the ranging arm, and softer collision. rotation speed was slower, the particles would slide to the L area directly along the ranging arm due theexit, increase in the rotation theranging exit velocity and softer the particle height increased as well to theWith lower smaller contact area speed, with the arm, and collision. as theWith blockage area of the ranging arm on the particles. Thus, the loading rate considerably decreased the increase in the rotation speed, the exit velocity and the particle height increased as with as thethe increase of the thickness of the ranging the rotation speed was rate 90 and 120 r/min. well blockage area of the ranging arm onarm the when particles. Thus, the loading considerably Additionally, the thickness of the ranging was arm small, the the loading ratespeed was higher decreased withwhen the increase of the thickness of thearm ranging when rotation was 90for anda rotation speed of 120 r/min than that for 60 r/min. With an increase in the thickness of the ranging 120 r/min. Additionally, when the thickness of the ranging arm was small, the loading rate was arm, thefor resulting trend changes. other words, thefor loading rate was lower for the 120 rotation higher a rotation speed of 120Inr/min than that 60 r/min. With an increase in r/min the thickness speed compared with the rotation speed of 60 r/min. Even when the rotation speed was 120 r/min, of the ranging arm, the resulting trend changes. In other words, the loading rate was lower for the the amount of particle output was lower than it was for 60 r/min. A few of the particles could still 120 r/min rotation speed compared with the rotation speed of 60 r/min. Even when the rotation pass the L area and load the statistical area whenwas the lower ranging armit was whichAwas speed was 120 r/min, theinto amount of particle output than was thinner, for 60 r/min. fewcaused of the by the higher output speed. The loading rate clearly decreased with an increase in the thickness of particles could still pass the L area and load into the statistical area when the ranging arm was thinner, the ranging arm because blockage the ranging arm became significant. which was caused by the the higher outputofspeed. The loading rate clearly decreased with an increase in the thickness of the ranging armofbecause the arm blockage the ranging significant. Table 4. Influence of the thickness the ranging on theof particle loadingarm rate became for different rotation speeds. TableSpeed 4. Influence of the thickness the ranging arm on Particle the particle loading rate Particle for different Hauling Rotation Speed VaneofHelix B Value Accumulated Loading rotation speeds. (m/min) (r/min) Angle (°) (mm) Mass (kg) Rate (%) 2 60 21 275 14.41 20.88 Hauling Rotation Vane Helix Particle Accumulated Particle Loading B Value (mm) 2Speed (m/min) 60 21 300 13.30 ˝ Speed (r/min) Angle ( ) Mass (kg) Rate (%) 19.04 2 60 21 325 10.95 18.78 2 60 21 275 14.41 20.88 2 21 300 13.30 19.04 18.23 2 6060 21 350 10.84 2 21 325 10.95 18.78 2 9060 21 275 20.10 33.16 2 60 21 350 10.84 18.23 2 21 275 20.10 33.16 30.27 2 9090 21 300 17.82 2 21 300 17.82 30.27 2 9090 21 325 16.01 25.98 2 90 21 325 16.01 25.98 2 21 350 14.12 23.92 23.92 2 9090 21 350 14.12 2 120 21 275 13.60 23.04 2 120 21 275 13.60 23.04 2 120 21 300 11.21 18.86 2 120 21 325 9.79 16.11 18.86 2 120 21 300 11.21 2 120 21 350 8.44 13.73 2 120 21 325 9.79 16.11 2 120 21 350 8.44 13.73
Figure 13. 13. Variations in the the particle particle loading loading rate rate with with the the thickness thickness of of the the ranging ranging arm arm B B for for different different Figure Variations in rotation speeds. rotation speeds.
It can be concluded from the above analysis that the loading rate decreased with an increase in the thickness of the ranging arm within a small 734 range when a lower rotation speed was used. 12
Minerals 2015, 5, 723–736
It can be concluded from the above analysis that the loading rate decreased with an increase in the thickness of the ranging arm within a small range when a lower rotation speed was used. Furthermore, the loading rate was significantly influenced by the thickness of the ranging arm when a higher rotation speed was used, especially when significant ejecting occurred. Thus, the thickness of the ranging arm should be reduced as much as possible in the design of the shearer. 5. Conclusions Based on the structural characteristics and the working environment of thin coal seam shearers, the simulation model of an operational thin coal seam shearer ranging arm was established. The drum coal loading processes for different drum position parameters and different ranging arm thicknesses were simulated. Additionally, the effects of the related parameters on the coal loading performance of the shearer drum were obtained. The influence of the relative height between the drum and the scraper on the coal loading performance of the shearer drum was investigated. The results indicate that when the height of the drum bottom is consistent with the scraper, the drum coal loading performance is the worst; thus, the loading performance of the shearer drum can be increased by decreasing or increasing the drum height. An investigation on the effects of the distance between the coal wall and a scraper on the coal loading performance of the shearer drum was conducted. The results indicate that the distance is the most significant factor that affects the coal loading performance of the shearer drum, and the coal loading performance decreases linearly with an increase in the distance. Furthermore, our study indicates that the effects of the thickness of the ranging arm on the low-speed drum coal loading rate are not apparent, whereas the effects of the thickness of the ranging arm on the high-speed drum coal loading rate are evident. In summary, the current study provides a reference for improving the coal loading rate from the aspects of shearer structural design, mining technology selection, and scraper structural design. Acknowledgments: This study was supported by the National High Technology Research and Development Program of China (863 Program) (No. 2012AA062104) and the Scientific Research Foundation of the Shandong University of Science and Technology for Recruited Talents (2015RCJJ024). Jianghui Dong is supported by an Australian Postgraduate Award (APA) PhD scholarship as well as Vice Chancellor and President’s Scholarships (University of South Australia). Qingliang Zeng was supported by the National Natural Science Foundation of China (Grant No. 51375282). Author Contributions: Kuidong Gao and Jianghui Dong conceived and designed the experiments, Kuidong Gao performed the experiments, Kuidong Gao, Qingliang Zeng and Changlong Du analyzed the data, and Kuidong Gao, Changlong Du and Jianghui Dong wrote the report. Conflicts of Interest: The authors declare no conflict of interest. References 1. 2. 3. 4. 5. 6. 7. 8. 9.
Morris, C.J. The design of shearer drums with the aid of a computer. The Min. Eng. 1980, 11, 289–295. Hurt, K.G.; Mcstravick, F.G. High performance shearer drum design. Colliery Guard. 1988, 236, 425–429. Brooker, C.M. Theoretical and practical aspects of cutting and loading by shearer drums. Colliery Guard. 1979, 1, 9–16. Ludlow, J.; Jankowski, R.A. Use lower shearer drum speed to achieve deeper coal cutting. Min. Eng. 1984, 36, 251–255. Peng, S.S.; Chiang, H.S. Longwall Mining; John Wiley and Sons: New York, NY, USA, 1984. Ayhan, M. Investigation into the Cutting and Loading Performance of Drum Shearers in OAL Mine. Master’s Thesis, Institution of Science, The University of Hacettepe, Ankara, Turkey, 1994. Ayhan, M.; Eyyuboglu, E.M. Comparison of globoid and cylindrical shearer drums’ loading performance. J. S. Afr. Inst. Min. Metall. 2006, 106, 51–56. Liu, Q.Y.; Yan, H.F. Symmetrical coefficient design of shearer drum. J. China Univ. Min. Technol. Chin. Ed. 1997, 4, 95–98. Liu, S.Y.; Du, C.L.; Zhang, J.J.; Jiang, H. Parameters analysis of shearer drum loading performance. Min. Sci. Technol. 2011, 5, 621–624. [CrossRef]
735
Minerals 2015, 5, 723–736
10. 11. 12. 13.
14. 15. 16.
17. 18. 19. 20. 21. 22. 23. 24. 25. 26. 27.
Gao, K.D.; Du, C.L.; Liu, S.Y.; Fu, L. Model test of helical angle effect on coal loading performance of shear drum. Int. J. Min. Sci. Technol. 2012, 22, 165–168. Gao, K.D.; Du, C.L.; Liu, S.Y.; Fu, L. Analysis on significance of the factors influencing shearer drum cutting performance. Int. J. Oil Gas Coal Technol. 2014, 4, 386–398. [CrossRef] Shmulevich, I.; Asaf, Z.; Rubinstein, D. Interaction between soil and a wide cutting blade using the discrete element method. Soil Tillage Res. 2007, 97, 37–50. [CrossRef] Ketterhagen, W.R.; Curtis, J.S.; Wassgren, C.R.; Kong, A.; Narayan, P.J.; Hancock, B.C. Granular segregation in discharging cylindrical hoppers: A discrete element and experimental study. Chem. Eng. Sci. 2007, 22, 6423–6439. [CrossRef] Mukherjee, A.K.; Mishra, B.K. Experimental and simulation studies on the role of fluid velocity during particle separation in a liquid–solid fluidized bed. Int. J. Miner. Process. 2007, 4, 211–221. [CrossRef] Labra, C.; Rojek, J.; Oñate, E.; Zarate, F. Advances in discrete element modeling of underground excavations. Acta Geotech. 2008, 3, 317–322. [CrossRef] Nakashima, H.; Fujii, H.; Oida, A.; Momozu, M.; Kanamori, H.; Aoki, S.; Yokoyama, T.; Shimizu, H.; Miyasaka, J.; Ohdoi, K. Discrete element method analysis of single wheel performance for a small lunar rover on sloped terrain. J. Terramech. 2010, 5, 307–321. [CrossRef] Su, O.; Akcin, N.A. Numerical simulation of rock cutting using the discrete element method. Int. J. Rock Mech. Min. 2011, 3, 434–442. [CrossRef] Estay, D.A.; Chiang, L.E. Discrete crack model for simulating rock comminution processes with the Discrete Element Method. Int. J. Rock Mech. Min. 2013, 60, 125–133. [CrossRef] McBride, W.; Cleary, P.W. An investigation and optimization of the ‘OLDS’ elevator using discrete element modeling. Powder Technol. 2009, 3, 216–234. [CrossRef] Owen, P.J.; Cleary, P.W. Prediction of screw conveyor performance using the Discrete Element Method (DEM). Powder Technol. 2009, 3, 274–288. [CrossRef] Osman, H.B. Granular Flow and Heat Transfer in a Screw Conveyor Heater: A Discrete Element Modeling Study. Ph.D. Thesis, National University of Singapore, Singapore, 2012. Knuth, M.A.; Johnson, J.B.; Hopkins, M.A.; Sullivan, R.J.; Moore, J.M. Discrete element modeling of a mars exploration rover wheel in granular material. J. Terramech. 2012, 1, 27–36. [CrossRef] Fu, L.; Du, C.L.; Li, J.P.; Gao, K.D. Discrete element simulation of the drill tool on the auger drill miner (DTAM) conveying coal. Int. J. Earth Sci. Eng. 2014, 2, 552–560. PFC3D: User Manual. Itasca Consulting Group: Minneapolis, MN, USA, 2003. Gao, K.D.; Du, C.L.; Fu, L.; Jiang, H.X. Effect of mining face angle on drum loading performance using discrete element method. Int. J. Earth Sci. Eng. 2014, 1, 41–51. Gao, K.D. Feasibility of drum coal loading process simulation using three dimensional discrete element method. Electron. J. Geotech. Eng. 2015, 14, 5999–6007. Roberts, A.W. The influence of granular vortex motion on the volumetric performance of enclosed screw conveyors. Powder Technol. 1999, 1, 56–67. [CrossRef] © 2015 by the authors; licensee MDPI, Basel, Switzerland. This article is an open access article distributed under the terms and conditions of the Creative Commons by Attribution (CC-BY) license (http://creativecommons.org/licenses/by/4.0/).
736