RESEARCH ARTICLE
Influence on number of top-ups after implementing patient controlled epidural analgesia: A cohort study Ganapathy van Samkar, Henning Hermanns, Philipp Lirk¤, Markus W. Hollmann*, Markus F. Stevens Department of Anaesthesiology, Academic Medical Centre, Amsterdam, the Netherlands
a1111111111 a1111111111 a1111111111 a1111111111 a1111111111
OPEN ACCESS Citation: van Samkar G, Hermanns H, Lirk P, Hollmann MW, Stevens MF (2017) Influence on number of top-ups after implementing patient controlled epidural analgesia: A cohort study. PLoS ONE 12(10): e0186225. https://doi.org/10.1371/ journal.pone.0186225 Editor: Ashham Mansur, University Medical Center Goettingen, GERMANY Received: February 13, 2017
¤ Current address: Brigham and Women’s Hospital, Harvard Medical School, Boston, MA, United States of America *
[email protected]
Abstract Postoperative epidural analgesia often needs rate readjustment using top-ups. Patient-controlled epidural analgesia (PCEA) is said to reduce the requirement of epidural top-ups when compared to continuous epidural analgesia (CEA). We compared CEA and PCEA in major thoracic and abdominal surgery, in a cohort study. The primary endpoint was the required number of epidural top-ups. Secondary endpoints were pain scores, side effects and workload differences. We analysed 199 patients with CEA and 187 with PCEA. Both groups had similar pain scores. The total number of top-ups was 75 in 57 patients (CEA) versus 20 top-ups in 18 patients (PCEA). (p = 0.0001) Sedation tended to occur more frequently in patients with CEA versus PCEA, 5.5% vs 1.6% (p = 0.05). Implementation of PCEA led to a decreased number of top-ups, fewer side-effects and decreased use of the postoperative care unit.
Accepted: September 27, 2017 Published: October 18, 2017 Copyright: © 2017 van Samkar et al. This is an open access article distributed under the terms of the Creative Commons Attribution License, which permits unrestricted use, distribution, and reproduction in any medium, provided the original author and source are credited. Data Availability Statement: All relevant data are within the paper and its Supporting Information files. Funding: The study was funded by an internal developmental grant (project code SH102002; grant number 201015b) of the Academic Medical Center, Amsterdam, The Netherlands to MS. We would like to acknowledge B. Braun Medical B.V. (Oss, The Netherlands) for giving financial support of 750 Euros as a contribution to the costs of publication. B. Braun Medical was not involved in
Introduction Epidural analgesia is regularly applied perioperatively for major abdominal or thoracic surgery.[1, 2] However, epidural analgesia can have a failure rate as high as 30%, frequently requiring re-adjustment by increasing the speed of infusion and/or top-ups with a bolus of local anaesthetic.[3–5] Nevertheless, top-ups with larger doses of local anaesthetics and/or opioids can cause hemodynamic or respiratory depression and therefore require intensified monitoring. A refinement of continuous epidural analgesia (CEA) is patient controlled epidural analgesia (PCEA) where a basal epidural infusion rate can be supplemented by an on demand bolus. The efficacy of PCEA has already been investigated in numerous clinical studies, and confirmed in a systematic review.[6–14] PCEA induced superior analgesia with fewer side effects and a decrease in drug requirement. However, many hospitals and anaesthesiologists continue using CEA for reasons of simplicity, scarcity of PCEA pumps and intricacy of handling of these pumps. In our institution CEA was the standard of care before we introduced PCEA.
PLOS ONE | https://doi.org/10.1371/journal.pone.0186225 October 18, 2017
1 / 10
Patient controlled epidural analgesia reduces top-up frequency
any part of the research, including design, analysis, or writing of the manuscript. Competing interests: We would like to acknowledge B. Braun Medical B.V. (Oss, The Netherlands) for giving financial support of 750 Euros as a contribution to the costs of publication. Therefore: This does not alter our adherence to PLOS ONE policies on sharing data and materials.
Monitoring of an epidural top-up can be challenging to manage, given the logistics of a large hospital and teaching centre: response time, transport time, time to contact a physician to do the top-up, and assessment, supervision and monitoring time. We investigated whether the introduction of PCEA infusion pumps on the regular postoperative wards decreased the need for postoperative top-ups. Thus—in contrast to previous studies—the primary aim of this study was to reduce the number of top-ups after implementation of PCEA. Secondary outcome measures were: pain score (numeric rating scale, NRS), side effects (sedation, itching, motor block, nausea and vomiting) and calculated hours of differences in workload. Our hypothesis was that PCEA would reduce the number of top-ups, side effects and workload. Further, it could lead to a reduced duration of use of epidural analgesia.
Materials and methods In this retrospective cohort study, we investigated adult patients who had undergone thoracic and upper abdominal surgery during 2012–2013. The institutional medical ethics committee provided a waiver (W14-051 # 14.17.005) for this anonymized investigation. Patient consent was not required, as data used for this cohort analysis was already present, and patients were not subjected to study measures. Epidural catheters were placed preceding the induction of general anaesthesia by a consultant or a registrar in anaesthesia with adequate experience, and proper placement was confirmed, according to local standard operating procedures. The epidural catheter was used for analgesia during the operation, infusion of bupivacaine 0.25% at the rate of 8–10 ml per hour. Patients received only standard CEA for nine months in 2012. (N = 199). After educating all care givers about the technique of PCEA, patients received PCEA for nine months in 2013 (N = 187). Itching (tolerable or needing medication), motor weakness (Bromage score), sedation (Ramsay score) and nausea (tolerable or needing medication) were scored. For safety reasons (e.g. monitoring of hypotension and respiratory depression), top-ups (top-ups: lidocaine 1%, dosed at 1mg/kg body weight) were given by a physician under basic monitoring (by means of non-invasive blood pressure, ECG and saturation). In patients not needing top-ups, the standard rate of epidural infusion was as per protocol (see below). Primary and secondary epidural failures were scored in both groups: primary failure was defined as: the epidural was not working immediately after the operation in spite of topup, and secondary failure was defined as: initially good analgesia, but in the course of time a failed epidural (no analgesia) in spite of top-ups. Peak NRS scores were registered before topups in both groups. Both, primary and secondary failures were included in an intention-totreat analysis. Workload was calculated as the amount of time spent by medical professionals to treat inadequate postoperative epidural analgesia.
CEA protocol Standard epidural medication was bupivacaine 0.125% with 1 microgram sufentanil per ml solution. In patients older than 70 years or weighing less than 60 kg, sufentanil was omitted from the epidural. The epidural pump was set at a constant speed of 10 millilitres per hour (ml/hr). The rate was increased by 2 ml/hr if indicated by pain scores (see below), after a topup dose. Maximum dose was 0.3 mg/kg per hour of bupivacaine. The rate was decreased by 2 ml/hr if analgesia was adequate or in the presence of hypotension.
PCEA protocol Epidural solution was identical to the CEA protocol. The epidural infusion speed was 6 ml/hr with a patient controlled bolus of 2 ml and a lockout time of 20 minutes. The maximum bupivacaine dose was defined as 0.3 mg/kg per hour. In case of inadequate analgesia the bolus was
PLOS ONE | https://doi.org/10.1371/journal.pone.0186225 October 18, 2017
2 / 10
Patient controlled epidural analgesia reduces top-up frequency
primarily increased from 2 ml to 4 ml. In case of arterial hypotension the rate was decreased by 2 ml/hr (as above).
Both groups Standard additional medication (unless they were contraindicated) included acetaminophen 4 grams (g) daily in 4 doses, and diclofenac 150 milligrams (mg) daily in 3 doses or dipyrone 4 grams (g) daily in 4 doses. We used the following pump: BBraun PerfusorSpace with special module for PCEA. This enabled us to use the same pump for continuous epidural and patient controlled epidural analgesia by adding an extra module with button for patient control.
Pain scores The first pain scores were routinely taken at the post anesthesia care unit (PACU). After transferring the patients to the surgical wards, the level of epidural analgesia was judged by the staff of the acute pain service daily, and if inadequate (resting NRS score above 4 in the operated location, inadequate block height) the patient received an epidural top-up bolus with lidocaine 1%, dosed at 1 mg/kg. This was done after transferring the patient to the PACU under extended hemodynamic and neurologic monitoring, because of the complexity of the patient population with underlying diseases in a university hospital.This is partially reflected in ASA class distribution in Table 1, bearing in mind that a pancreatic resection or transthoracic esophageal resection remains a high risk procedure even in patients categorized as ASA 1 and 2. In addition, NRS scores were documented by the ward personnel 3–4 times daily, and if scores were above 4, the acute pain service was called. Patients could also alert the nurses if they felt uncomfortable due to pain. In both groups, successful top-ups were followed by an increase in basic epidural infusion speed (in case of pain during rest). In the PCEA group pain during activity was treated by an increase in bolus dose. Total failure of epidural analgesia (insufficient effect of top-up) was followed by removal of the epidural catheter and the initiation of patient controlled analgesia with morphine (PCA).
Endpoints Primary endpoint was the cumulative frequency of top-up rescue interventions per therapy group throughout the entire period of postoperative epidural analgesia. Secondary endpoints were: NRS pain scores, side effects (hypotension, nausea, vomiting, itching, motor weakness, sedation) and estimated differences in workload. Hypotension was generally defined as: when mean arterial pressure decreased more than 20% from the normal mean arterial pressure of the patient as commonly measured in normal circumstances. Additionally, for the workload calculation, we measured the average time involved in a top-up of a surgical ward patient. Including transport, this was 2.5 hours per patient. (30 min transport to and from the PACU, 2 hours observation including top-up of epidural on PACU).
Statistics SPSS version 22 (IBM software, New York, USA) was used to analyze our data. Normality of distribution was evaluated using the Shapiro-Wilk test. Student’s t-test or Mann-Whitney U test was used to calculate differences in mean or median where appropriate. Continuous data not normally distributed were analyzed by a Kruskal-Wallis test and if significant followed by Mann-Whitney U test. Categorical data and frequencies were analyzed by Fisher’s exact test. Confidence intervals of 95% are given where appropriate, otherwise data are presented as
PLOS ONE | https://doi.org/10.1371/journal.pone.0186225 October 18, 2017
3 / 10
Patient controlled epidural analgesia reduces top-up frequency
Table 1. Patient and treatment characteristics. CEA* N = 199
PCEA† N = 187
P-Value
Male/Female N (%)
63/136 (32/68)
45/142 (24/76)
0.131‡
Mean Weight in kg SD
73 15
73 14
0.824§
Median age IQR
60 (47–68)
62 (52–70)
0.566
1
55 (28)
70 (38)
2
122 (61)
94 (50)
3
22 (11)
23 (12)
PPPD, pancreatic surgery
18 (9)
42 (23)
0.000
Thoracic oesophagus resection
25 (13)
7 (4)
0.000
Trans hiatal oesophagus resection
8 (4)
1 (0.5)
0.04
Laparotomy
58 (29)
45 (24)
0.30
Debulking tumour load
31 (16)
42 (23)
0.16
Wertheim
25 (13)
18 (11)
0.42
Hemihepatectomy
10 (5)
12 (6)
0.66
Liver hilus resection
3 (2)
0
0.25
Gastrectomy
3 (2)
6 (3)
0.32
Pelvic exenteration
3 (2)
0
0.25
Liver segment resection
4 (2)
5 (3)
0.74
Colonic surgery
11 (6)
8 (4)
0.64
T6-T7
24 (12)
11 (6)
0.05
T7-T8
36 (18)
20 (11)
0.04
T8-T9
41 (21)
31 (17)
0.36
T9-T10
38 (19)
35 (19)
1
T10-T11
18 (9)
46 (25)
0.000
T11-T12
5 (3)
17 (9)
0.007
T12-L1
5 (3)
6 (3)
0.76
L1-L2
28 (14)
20 (11)
0.36
ASA class** N (%)
0.08‡
Operation type N (%)
¶
Level of Epidural N(%)
**ASA class, American Society of Anesthesiologists physical status classification *CEA, Continuous Epidural Analgesia †PCEA, Patient Controlled Epidural Analgesia. ‡2 sided Pearson Chi Square test. §t Test Bias Corrected Accelerated. ¶ Fisher exact two tailed. https://doi.org/10.1371/journal.pone.0186225.t001
means with standard deviations (SD) or median with interquartile range (IQR), respectively. A p-value of < 0.05 was considered statistically significant.
Results A total of 386 patients were analysed from 2012 to 2013: 199 in the CEA and 187 in the PCEA group. There were no significant differences between the two groups regarding age, weight, distribution of sex. Regarding type of surgery, there were significantly more oesophageal resections with CEA. On the other hand, significantly more patients underwent pylorus preserving pancreato duodenectomy with PCEA. More than 80% of epidurals were placed at thoracic level in both groups. (Table 1) In the group of patients with CEA, 75 top-ups were necessary,
PLOS ONE | https://doi.org/10.1371/journal.pone.0186225 October 18, 2017
4 / 10
Patient controlled epidural analgesia reduces top-up frequency
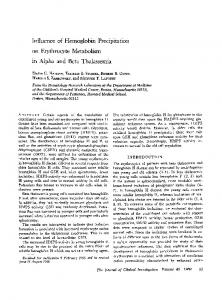
Fig 1. NRS* resting pain scores postoperative day 1 to day 4, CEA† (N = 199) vs PCEA‡ (N = 187). *NRS, Numeric rating scale of pain. †CEA, continuous epidural analgesia, ‡PCEA, patient controlled epidural analgesia. Depicted in the boxes are resting postoperative pain scores of 4 days in patients with continuous and patient controlled epidural analgesia. Top of box is third quartile, bottom is first quartile. The horizontal line in box is median value; whiskers at the end of lines are minimum and maximum values. Dots are outliers. https://doi.org/10.1371/journal.pone.0186225.g001
compared to 20 in the PCEA group (p = 0.0001). There were no significant intergroup differences in NRS scores on Postoperative day 1 to 4. (Figs 1 and 2). Peak NRS scores before top-up did not differ between groups.
Fig 2. NRS* pain scores during movement postoperative day 1 to day 4, CEA† (N = 199) vs PCEA‡ (N = 187). *NRS, Numeric rating scale of pain. †CEA, continuous epidural analgesia, ‡PCEA, patient controlled epidural analgesia. Depicted in the boxes are resting postoperative pain scores of 4 days in patients with continuous and patient controlled epidural analgesia. Top of box is third quartile, bottom is first quartile. The horizontal line in box is median value; whiskers at the end of lines are minimum and maximum values. Dots are outliers. https://doi.org/10.1371/journal.pone.0186225.g002
PLOS ONE | https://doi.org/10.1371/journal.pone.0186225 October 18, 2017
5 / 10
Patient controlled epidural analgesia reduces top-up frequency
Table 2. Comparison of endpoints between CEA* and PCEA†. CEA* (N = 199)
PCEA† (1879(18((N = 187)
p value ‡
Total number of patients with Top-ups N (%)
57 (28.6)
18 (9.6)
0.0001
Requiring One top-up N
41
16
0.001
Two top-ups N
14
2
0.004
Three top-ups N
2
0
0.49
Mean days duration epidural analgesia (SD)
3.3 (1.5)
3 (1)
0.07
Median Peak NRS scores (95% CI)
8 (7–8)
8 (7–8)
0.75
Primary failure of epidural
6
1
0.12
Secondary failure of epidural
2
4
0.44 0.57
Side effects Itching untreated N (%)
4
3
4
2
Nausea untreated N (%)
11
10
treated
14
9
Motor weakness total N (%)
28
19
Bromage level 2
13
9
Bromage level 3
11
9
Bromage level 4
4
1
Sedation total N (%)
11 (5.5)
3 (1.6)
Ramsay score 3
3
2
Ramsay score 4
2
1
Ramsay score 5
6
0
Any side effect (%)
72 (36.1)
46 (24.5)
treated
0.52 0.27
0.05
0.02
*CEA, continuous epidural analgesia. †PCEA, Patient controlled epidural analgesia. ‡ Fisher exact. https://doi.org/10.1371/journal.pone.0186225.t002
Primary and secondary endpoints are compared in Table 2. Itching, nausea and motor weakness was not significantly different between groups. The timings of top-ups are represented in Fig 3. Post-hoc exclusion of pancreatoduodenectomies and oesophagectomies to control for nonrandom distribution of these procedures between groups resulted in 148 patients with CEA and 137 patients with PCEA with 32 top-ups in the CEA group, and 16 top-ups in the PCEA group (p = 0.03). Thus, the difference remains significant even in the patients with presumably less painful operations. Table 3 presents reasons for decreasing the rate of the epidural infusion. We decreased rates in 17 patients (8.5%) in the CEA group and in 3 patients (1.6%) in the PCEA group (p = 0.002).
Workload calculation In our hospital, the average time spent on the monitoring ward, was 2 hours. Transport to and from the surgical and gynecological wards required on average 30 minutes per patient. This sums up to an average workload per (patient) top-up of 2.5 hours in our setting. We had 20 top-ups in our PCEA group of 187 epidurals, and 75 in our CEA group of 199 patients., 20 top-ups result in 50 hours per 187 patients receiving PCEA, this is 16 minutes per patient in this group. 75 top-ups result in 187.5 hours per 199 patients receiving CEA, this is 56.5 minutes per patient in this group.
PLOS ONE | https://doi.org/10.1371/journal.pone.0186225 October 18, 2017
6 / 10
Patient controlled epidural analgesia reduces top-up frequency
Fig 3. Top-up administration in CEA and PCEA groups. †CEA, continuous epidural analgesia, ‡PCEA, patient controlled epidural analgesia. Each circle represents one top-up. The time-interval is given in hours. In order to visualize each patient data points were mildly shifted in time and stacked to improve readability of the figure. https://doi.org/10.1371/journal.pone.0186225.g003
Discussion Our main finding in this retrospective cohort study was that the use of PCEA significantly reduced the number of patients requiring top-ups, while NRS scores did not differ between groups. The total numbers of top-ups in our study are in accordance with other studies: a Swedish study encompassing seven years of PCEA and 4912 epidurals had a failure rate of 11%, resulting in termination of the epidural.[15] Recent literature gives a failure rate of up to 30% in CEA epidurals. [3, 16] Our study investigates the effect of implementation of PCEA on the total number of rescue top-ups, which form a logistically important and costly aspect of postoperative epidural analgesia. The finding that the PCEA group did not improve pain scores is in contrast to other studies.[7, 9] However, most studies comparing PCEA and CEA were done before the introduction of multimodal pain concepts. Thus, the fact that all patients continued preoperative pain medication with the addition of acetaminophen and diclofenac or dipyrone may have also worked in favour of the pain scores in the CEA group. Well in accordance to the quoted comparative studies between CEA and PCEA, we noticed more side effects in the CEA group. There was a significant difference between groups, in the number of patients requiring reduction of infusion rate due to side effects such as sedation, motor block or hypotension. The degree of sedation was considerably lower in patients with PCEA. Also, fewer patients were sedated. Since our pumps only register drug consumption over the last 4 hours, unfortunately we were not able to obtain results regarding the applied doses, but it is likely that the increased percentages of side effects in the CEA group were caused by high local anaesthetic and opioid Table 3. Rate adjustment due to side effects. Number of patients for whom:
CEA* (N = 199)
PCEA† (N = 187)
p value‡
rate was decreased due to motor blockade
5
3
0.5
rate was decreased due to sedation
5
0
0.02
rate was decreased due to arterial hypotension
7
0
0.006
Total N (%)
17 (8.5)
3 (1.6)
0.002
*CEA, continuous epidural analgesia. †PCEA, Patient controlled epidural analgesia. ‡Fisher exact https://doi.org/10.1371/journal.pone.0186225.t003
PLOS ONE | https://doi.org/10.1371/journal.pone.0186225 October 18, 2017
7 / 10
Patient controlled epidural analgesia reduces top-up frequency
doses applied. Regarding hypotension and possible respiratory complications after epidural analgesia, these frequencies may be under reported. Due to the retrospective nature of the study, we can only show the actual documentation of these events. Furthermore, the incidence of hypotensive episodes may have been influenced by the the epidural level. In the CEA group midthoracic epidural levels (T6-T8) were more frequent than in the PCEA group where low thoracic levels(T10-T12) were more frequent. Therefore these are limitations of the study. Our PCEA algorithm is rather conservative, and there are studies with more successful algorithms; especially those with integrated mandatory and automatic bolus.[17] Nevertheless, we noticed a significant improvement in our in-hospital logistics after the introduction of PCEA pumps. Perhaps the feeling of being in control positively adds to the success of PCEA, as suggested in an earlier publication.[18] More than a decade ago, Schuster and co-workers calculated the cost of PCEA and demonstrated that most of the money is spent on staff costs, although in their calculation they did not include expenses for top-ups at medium- or high-care units.[19] In an earlier study of 6349 patients, Brodner and co-workers demonstrated significant cost savings due to the implementation of a multimodal pain management including PCEA.[20] Furthermore, in the last decennium, the percentage of staff cost in developed countries increased further while drug and material costs tended to decrease. In our hospital the transport and admittance of patients for epidural top-ups is not only time-consuming, but because of its urgent character it cannot be scheduled or planned and can create logistic problems for the ward, transport service and the postoperative care unit. The introduction of PCEA did significantly ameliorate this problem. In our hospital, we calculate 16 minutes per patient in the PCEA group versus 56.5 minutes in the CEA group. Even though this is specific to our hospital and may not reflect the situation in other hospitals, top-ups are always time consuming, and efficiency is welcome. Top-ups are often done in the wards, but even then if the frequency of top-ups can be drastically reduced, it is beneficial to workload. Thus, not only patient comfort and success rate were increased (decrease in sedation and less top-ups) but also hospital investment of costly urgent medium or high care space. Our study has several limitations: Patients with oesophageal and pancreatic surgery were not equally distributed between cohorts. However, excluding these patients in a post-hoc analysis revealed even in the remaining and presumably less painful operations, a significant difference in the number of top-ups between groups (p = 0.03). In this subgroup the number of side-effects leading to changes in management was significantly more in the in CEA group than in the PCEA group. Thus, the non-randomized nature of the study leads to an uneven distribution of operations between groups, but the results were robust enough, when controlled for the uneven distribution. Furthermore, due to the nature of the study (not an RCT, no blinding) there are many possible causes of bias: the effect of the PCEA may be due to the psychological factor of “self-control”, resulting in less complaints, nurses may call the pain service earlier in case of CEA, or delay because of the hassle involved in a top-up dose. Irrespective of whether the effect of PCEA was caused by psychological or pharmacologic factors, in clinical practice it will have a benefit. Whatever bias may have been involved, it did not seem to result in a significant difference in NRS scores between groups. Although our results may need validation in a prospective randomized trial, we demonstrated for the first time that PCEA could reduce the frequency of top-ups and thereby reduce inconvenience for the patient, workload for the staff and costs for the hospital.
Conclusion We conclude that PCEA can reduce the frequency of top-ups and side effects, compared to CEA. This may lead to reduced logistic workload and hospital costs.
PLOS ONE | https://doi.org/10.1371/journal.pone.0186225 October 18, 2017
8 / 10
Patient controlled epidural analgesia reduces top-up frequency
Supporting information S1 File. Database pcea vs cea 23 aug for plosone. (XLSX) S1 Table. Ramsay score. (DOCX) S2 Table. Bromage score. (DOCX)
Author Contributions Conceptualization: Ganapathy van Samkar, Markus W. Hollmann. Formal analysis: Ganapathy van Samkar, Henning Hermanns. Funding acquisition: Ganapathy van Samkar, Markus F. Stevens. Investigation: Ganapathy van Samkar, Henning Hermanns, Markus F. Stevens. Methodology: Ganapathy van Samkar. Project administration: Markus W. Hollmann, Markus F. Stevens. Resources: Henning Hermanns, Philipp Lirk, Markus F. Stevens. Supervision: Philipp Lirk, Markus W. Hollmann, Markus F. Stevens. Visualization: Ganapathy van Samkar, Henning Hermanns, Philipp Lirk, Markus F. Stevens. Writing – original draft: Ganapathy van Samkar, Markus F. Stevens. Writing – review & editing: Henning Hermanns, Philipp Lirk, Markus W. Hollmann.
References 1.
Kainzwaldner V, Rachinger-Adam B, Mioc-Curic T, Wohrle T, Hinske LC, Luchting B, et al. [Quality of postoperative pain therapy: evaluation of an established anesthesiology acute pain service]. Der Anaesthesist. 2013; 62(6):453–9. https://doi.org/10.1007/s00101-013-2177-7 PMID: 23670580.
2.
Rigg JR, Jamrozik K, Myles PS, Silbert BS, Peyton PJ, Parsons RW, et al. Epidural anaesthesia and analgesia and outcome of major surgery: a randomised trial. Lancet. 2002; 359(9314):1276–82. https:// doi.org/10.1016/S0140-6736(02)08266-1 PMID: 11965272.
3.
Hermanides J, Hollmann MW, Stevens MF, Lirk P. Failed epidural: causes and management. British journal of anaesthesia. 2012; 109(2):144–54. https://doi.org/10.1093/bja/aes214 PMID: 22735301.
4.
Block BM, Liu SS, Rowlingson AJ, Cowan AR, Cowan JA Jr., Wu CL. Efficacy of postoperative epidural analgesia: a meta-analysis. JAMA: the journal of the American Medical Association. 2003; 290 (18):2455–63. https://doi.org/10.1001/jama.290.18.2455 PMID: 14612482.
5.
Lim Y, Sia AT, Ocampo CE. Comparison of computer integrated patient controlled epidural analgesia vs. conventional patient controlled epidural analgesia for pain relief in labour. Anaesthesia. 2006; 61 (4):339–44. https://doi.org/10.1111/j.1365-2044.2006.04535.x PMID: 16548952.
6.
Kim SH, Yoon KB, Yoon DM, Kim CM, Shin YS. Patient-controlled Epidural Analgesia with Ropivacaine and Fentanyl: Experience with 2,276 Surgical Patients. The Korean journal of pain. 2013; 26(1):39–45. https://doi.org/10.3344/kjp.2013.26.1.39 PMID: 23342206; PubMed Central PMCID: PMC3546209.
7.
Nightingale JJ, Knight MV, Higgins B, Dean T. Randomized, double-blind comparison of patient-controlled epidural infusion vs nurse-administered epidural infusion for postoperative analgesia in patients undergoing colonic resection. British journal of anaesthesia. 2007; 98(3):380–4. https://doi.org/10. 1093/bja/ael367 PMID: 17283006.
8.
Sia AT, Leo S, Ocampo CE. A randomised comparison of variable-frequency automated mandatory boluses with a basal infusion for patient-controlled epidural analgesia during labour and delivery. Anaesthesia. 2013; 68(3):267–75. https://doi.org/10.1111/anae.12093 PMID: 23278328.
PLOS ONE | https://doi.org/10.1371/journal.pone.0186225 October 18, 2017
9 / 10
Patient controlled epidural analgesia reduces top-up frequency
9.
van der Vyver M, Halpern S, Joseph G. Patient-controlled epidural analgesia versus continuous infusion for labour analgesia: a meta-analysis. British journal of anaesthesia. 2002; 89(3):459–65. PMID: 12402726.
10.
Lopard E. [Patient-controlled epidural analgesia for labour: in practice]. Annales francaises d’anesthesie et de reanimation. 2006; 25(6):593–8. https://doi.org/10.1016/j.annfar.2006.02.012 PMID: 16626925.
11.
Popping DM, Zahn PK, Van Aken HK, Dasch B, Boche R, Pogatzki-Zahn EM. Effectiveness and safety of postoperative pain management: a survey of 18 925 consecutive patients between 1998 and 2006 (2nd revision): a database analysis of prospectively raised data. British journal of anaesthesia. 2008; 101(6):832–40. https://doi.org/10.1093/bja/aen300 PMID: 18945716.
12.
George RB, Allen TK, Habib AS. Intermittent epidural bolus compared with continuous epidural infusions for labor analgesia: a systematic review and meta-analysis. Anesthesia and analgesia. 2013; 116 (1):133–44. https://doi.org/10.1213/ANE.0b013e3182713b26 PMID: 23223119.
13.
Loubert C, Hinova A, Fernando R. Update on modern neuraxial analgesia in labour: a review of the literature of the last 5 years. Anaesthesia. 2011; 66(3):191–212. https://doi.org/10.1111/j.1365-2044.2010. 06616.x PMID: 21320088.
14.
Wigfull J, Welchew E. Survey of 1057 patients receiving postoperative patient-controlled epidural analgesia. Anaesthesia. 2001; 56(1):70–5. PMID: 11167440.
15.
Golster M. Seven years of patient-controlled epidural analgesia in a Swedish hospital: A prospective survey. European journal of anaesthesiology. 2014. https://doi.org/10.1097/EJA.0000000000000105 PMID: 24922048.
16.
Ready LB. Acute pain: lessons learned from 25,000 patients. Regional anesthesia and pain medicine. 1999; 24(6):499–505. PMID: 10588551.
17.
Capogna G, Stirparo S. Techniques for the maintenance of epidural labor analgesia. Current opinion in anaesthesiology. 2013; 26(3):261–7. https://doi.org/10.1097/ACO.0b013e328360b069 PMID: 23563796.
18.
Stienstra R. Patient-controlled epidural analgesia or continuous infusion: advantages and disadvantages of different modes of delivering epidural analgesia for labour. Current opinion in anaesthesiology. 2000; 13(3):253–6. PMID: 17016309.
19.
Schuster M, Gottschalk A, Freitag M, Standl T. Cost drivers in patient-controlled epidural analgesia for postoperative pain management after major surgery. Anesthesia and analgesia. 2004; 98(3):708–13, table of contents. PMID: 14980925.
20.
Brodner G, Mertes N, Buerkle H, Marcus MA, Van Aken H. Acute pain management: analysis, implications and consequences after prospective experience with 6349 surgical patients. European journal of anaesthesiology. 2000; 17(9):566–75. Epub 2000/10/12. PMID: 11029124.
PLOS ONE | https://doi.org/10.1371/journal.pone.0186225 October 18, 2017
10 / 10