International Journal of Computational Intelligence Research ISSN 0973-1873 Volume 7, Number 2 (2011), pp. 169-180 © Research India Publications http://www.ripublication.com/ijcir.htm
Information Fusion based on Multiplicity of Data Preprocessing Boosts the AdaBoost Classifier Divya Somvanshi1 and R.D.S. Yadava2 1
Sensors and Signal Processing Laboratory, Department of Physics, Faculty of Science, Banaras Hindu University, Varanasi, India. Presently at: Department of Electronics Engineering, Institute of Technology, Banaras Hindu University, Varanasi, India E-mail:
[email protected] 2 Sensors and Signal Processing Laboratory, Department of Physics, Faculty of Science, Banaras Hindu University, Varanasi 221005, India. E-mail:
[email protected];
[email protected]
Abstract The paper considers the possibility of boosting efficiency of the AdaBoost algorithm by introducing diversity in the information extraction procedures and subsequent information fusion. A given raw data set is transformed by two well known methods known as vector autoscaling and dimensional autoscaling. These methods transform data by mean-centering and variancenormalization with respect to the measurement variables and the measured samples, respectively. The feature (information) extraction is implemented by the principal component analysis. Final data representation is obtained by two alternate fusion strategies. In one, feature extraction is done immediately after the scaling transformations and the two feature sets are fused by a simple procedure of concatenation. In the other, data vectors obtained by the two scaling transformations are first fused by simple concatenation and then the feature extraction is done. The data representation is thus by fused feature vectors of dimensionality twice that of the original data. The AdaBoost algorithm by Freund and Schapire is implemented by using a simple threshold base classifier. The classification efficiency of these procedures is compared with that obtained by using single preprocessor based AdaBoosting. Four benchmark data sets are used for validation. The analysis demonstrates that the performance of the AdaBoost algorithm is enhanced further by multiple
170
Divya Somvanshi and R.D.S. Yadava preprocessor based fusion of data space, particularly if the original variables are of same kind. Keywords: Information fusion for pattern recognition, machine learning, boosting the AdaBoost algorithm, data preprocessing.
Introduction The success in any pattern recognition problem depends on three factors: quality of raw data, efficiency of information extraction procedures, and classifier algorithm in succession. An improvement in each boosts the performance of its successor. The overall performance of the pattern recognition algorithm depends on the optimization of all steps doing their operations in tandem. Given a raw data, the objective of information extraction procedures is to represent the data in a form that optimally helps the classifier. The information extraction consists of cleaning up the data for noise, removal of outliers, shifting and scaling, and transformation to generate a new representation of data which is potentially more helpful for pattern classification. The data transformation involves combining raw data variables (often linearly) to create new set of variables by focusing on certain statistical attributes such as variance, statistical independence, or separability. This is referred to as feature extraction. The procedures of data preparation for feature extraction are referred to as preprocessors. Some commonly used feature extraction methods are principal component analysis, independent components analysis and linear discriminant analysis. The new variables (feature components) define the feature space, and the representation of a sample vector in this space is called the feature vector or pattern. The feature vectors are representation of raw data vectors, and are input to the classifier for discrimination of patterns of different classes. The pattern classifier algorithms map feature space (in effect input data space) to different class labels or object identities. A number of pattern classification algorithms are developed that use various strategies for creating input data space to output class space mapping functions. For example, neural network methods produce nonlinear mapping by optimizing feature weights and node activation functions, support vector machines create large dimensionality hyperspace using a kernel function, and discriminant analysis seeks separation boundaries in the feature space. An overview of these methods can be found in [1], [2]. A pattern classification algorithm is basically a decision function which computes decision values by taking feature vectors as input. The construction of decision functions has been inspired by a variety of paradigms from statistical and biological domains. For example, the clustering and discriminant function algorithms implement statistical models, while the neural network and genetic algorithms are bio-inspired [2]. Given a pattern classifier, weak or strong, its performance can be further enhanced by methods of so called ‘ensemble learning’ [3]. The ensemble learning methods use a number of classifiers and combine their decision functions in some way to produce a new classifier with enhanced capabilities. It was proved by Schapire [4] that a number of weak learners trained on the same set of examples can be
Information Fusion based on Multiplicity
171
combined to yield a strong learner with enhanced predictive capability. The ensemble learning methods produce a fused decision fusion. In principle the performance of any classifier can be enhanced. However, usually the risk of overfitting prompts to use an ensemble of weak learners [5]-[7]. There is no limit on the number of learners in the ensemble. The performance of an ensemble learning method can be optimized by proper selection of ensemble size and fusion method to suit any specific application [5], [8]. Most popular among many ensemble learning algorithms is the AdaBoost (nickname for adaptive boosting) algorithm described by Freund and Schapire [9]. A summary of the AdaBoost algorithm is given in section II. The objective of present study is to show that the predictive ability of the AdaBoost algorithm can be further boosted by varied representation of the same raw data by employing several preprocessing and feature extraction methods. Different preprocessing and feature extraction procedures reveal hidden data structure from different perspectives, and yield alternate sets of features to represent the same example. By combining these sets in some way can, in principle, provide a more reliable and accurate representation. Motivated by this idea, we report here a study on enhancing performance of the AdaBoost algorithm by using a simple model of feature fusion based on the two common preprocessors and one feature extractor combination. The procedure is described in section III. Using a linear threshold classifier for the AdaBoost ensemble generation, section IV presents validation results based on some benchmark data sets available from open sources. The paper concludes with a discussion in section V.
The AdaBoost Algorithm The AdaBoost [9] is a supervised learning boosting algorithm that produces a strong classifier by combining several weak classifiers from a family. It needs a set of training examples and a base learning algorithm as input. Let X = {x1 , x 2 ,..., x N } be the set of N training vectors drawn from various target classes, and let Y = {y1, y2 ,..., y N } denote their class labels. The base learner is chosen such that it produces at least more than 50% correct classification on the training set. Let base learner be denoted by ht (x ) . The basic idea of ensemble generation in the AdaBoost algorithm is to assign a distribution of weights on the training examples according to the error rate in such a manner that, in sequentially repeated application of the base learner, the misclassified examples get more weight in the current application than the preceding one. The base classifier in each application is assigned a weight value α t according to its error rate. The process is iteratively repeated until the error rate is minimized. The ensemble consists of all base classifiers generated thus in successive runs until the error rate minimum. The boosted classifier, say H (x ) , is obtained as weighted-sum of all the base classifiers in the ensemble. The steps of the AdaBoost algorithm are reproduced here for the sake of clarity in the presentation of present analysis. We consider the AdaBoost solution for a twoclass problem. The class identities were given numeric representation of −1 and +1 . That is, yi ∈ Y = {− 1, + 1} for all x i ∈ X for all i = 1, 2,..., N .
172
Divya Somvanshi and R.D.S. Yadava
Step 1: Define input. It consists of N training examples, a base learning algorithm, and number of training runs T . Step 2: Initialize weight distribution over the training examples according to w1 (i ) = 1 / N for i = 1,2,..., N where i stands for the training examples and subscript 1 denotes the first round of T runs to determine weights wt (i) . In the first round all training examples are assigned equal weights. This assignment ensures that weight N
distribution is normalized, that is, ∑ w1 (i) = 1. i =1
Step 3: Start a loop ‘for t = 1 to T ’ that will create sequential base classifiers according to the following substeps in succession: Train the base classifiers ht based on the example weight distribution wt (i) . Determine the training error defined as ε t = ∑ wt (i ) which is the sum of weights i:ht ( xi )≠ y i
for all misclassified examples by ht . Assign weight to the t-th classifier ht according to: αt =
1 1 − εt ln . 2 εt
Update the example weights according to: wt +1 (i ) =
wt (i ) ⎧⎪e −α t for ht (x i ) = yi × ⎨ +α zt ⎪⎩ e t for ht (x i ) ≠ yi
where z t is the normalization factor for making wt +1 (i) to be a probability distribution. N
That is, for making ∑ wt +1 (i) = 1. i =1
End loop. Step 3: Output the boosted classifier as weighted sum of the T base classifiers ⎛T ⎞ H (x ) = sign ⎜⎜ ∑ α t ht (x )⎟⎟ . ⎝ t =1 ⎠
The Base Classifier In this work, we have taken the base learning algorithm to be a simple threshold classifier which uses only one feature dimension for class discrimination. The selection of that particular feature dimension is made by searching over all the feature dimensions while monitoring the rate of misclassification according to certain threshold criterion. The dimension with minimum rate of misclassification is selected for defining the base classifier. The error rate for each dimension is calculated as the sum of weights of all misclassified training samples as defined in Step 2 above. The threshold is a moving hyperplane which is perpendicular bisector to feature
Information Fusion basedd on Multiplicity
173
components of consecuttive training samples. The selection of minimum m error dimension with associateed threshold definition and samples weigght distribution specify the base classifiier in each round of the AdaBoost run. In the present calculations we used the AdaBoost A package available in MatLab [10].
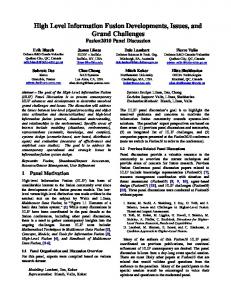
Multiple Preprocessoors and Information Fusion Fusion of information means to combine or assemble information measures obtained from different sources, orr extracted by different methods from the sam me data source, or both, in such a way thaat the fused information becomes potentiallyy more efficient for target representation. In I this work, we analyze the effects of inform mation fusion on the performance of AdaB Boost algorithm as outlined schematically in Fig. 1. The information fusion is impllemented in two alternate ways which have been b referred to in the schematic as dataa space fusion and feature space fusion. The two most commonly used mean centering and data scaling methods callled the vector autoscaling and the dimeensional autoscaling have been used. These are defined as follows. Let M denote thee dimensionality of raw data, and N before the number of training examples of sampples. The training data set will thus be a N × M matrix with samples in rows and variabbles in columns.
Figure 1: Schematic of o data preprocessing, feature extraction and adaboosting. a
174
Divya Somvanshi and R.D.S. Yadava
Vector autoscaling The matrix elements are mean-centered and variance- normalized for each sample separately (row wise) as xij ←
xij − xi
σi
where xi =
1 N ∑ xij N j =1
and σ i =
1 N 2 ∑ ( xij − xi ) N j =1
.
Dimensional autoscaling The matrix elements are mean-centered and variance normalized for each dimension separately (column wise) as xij ←
xij − x j
σj
where xj =
1 M ∑ xij M i =1
and σ j =
1 M 2 ∑ ( xij − x j ) M i =1
.
The feature extraction has been done by the principal component analysis (PCA). In data space fusion, the sample vectors transformed by the two methods were fused by simple concatenation of the vector components. That is, if the i-th training vector processed by the vector autoscaling is x1i = {xij1 } ≡ {x1i1 , x1i 2 ,..., x1iM } and that 2 } then the i-th processed by the dimensional auto scaling is xi2 = {xij2 } ≡ {xi21, xi22 ,..., xiM
2 fused data vector is defined by z i = {x1i1, x1i 2 ,..., x1iM , xi21, xi22 ,..., xiM } . The feature extraction is done by PCA of the new N × 2M dimensional data matrix. In feature space fusion, two alternate feature spaces are created first by the PCA of the vector autoscaled and the dimensional autoscaled data separately. Then, the fusion is done by a similar concatenation of the feature components as explained above. The final feature spaces created by the methods are of the same size, N × 2M matrix with N training examples with increased dimensionality equal to 2 M .
Validation Four data sets of two class problems have used in the validation analysis. These data were collected from the UCI machine learning repository. When analyzed by a single strong classifier (backpropagation neural network) in combination with dimensional autoscaling and PCA feature extraction, the classification rate for the two data sets (sonar and heart) were typically 70%. The analysis of the same data
Information Fusion based on Multiplicity
175
sets were done by the proposed method consisted of the weak threshold classifier based AdaBoost algorithm and the two methods of feature extraction. The division of the available data between the training and the test sets were done by random selection in nearly 50-50 ratio. The description of the data sets is given Table 1.
Table 1: Data sets used in the present analysis. Data Sonar
Classes Samples Attributes Remark 2 208 60 Classes: sonar returns from a metal cylinder and from a similarly shaped rock. Attributes: integrated energy within a frequency band. Heart 2 267 22 Classes: cardiac normal and abnormal condition. Attributes: SPECT images. Haberman’s 2 306 3 Classes: patients’ survival after 5 years and Breastdeath within 5 years of breast cancer surgery. Cancer Attributes: Age, year of operation, positive axillary nodes. Pima-Indian 2 768 8 Classes: signs or no-sign of diabetes pimaDiabetes indian females above 21 years age. Attributes: patient’s history and physiological parameters
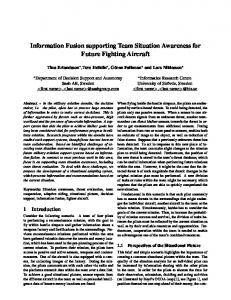
Table 2 presents the best classification results obtained by the AdaBoost algorithm with the linear threshold base classifiers as described in the preceding. The data are processed by four combinations of preprocessing, fusion and feature extraction strategies before AdaBoosting. These combinations are: vector-autoscaling + PCA; dimensional- autoscaling + PCA; (vector-autoscaling + dimensional-autoscaling) data space fusion + PCA; and, (vector-autoscaling + PCA) + (dimensional-autoscaling + PCA) feature space fusion. It can be seen that in all cases the performance of the AdaBoost algorithm has improved after the multiple preprocessor based data space or feature space fusions. The amount of improvement however depends on the type of data. In the Haberman breast cancer data and the pima-indian diabetes data the improvements are very marginal. However, in case of sonar data and heart data the improvements are substantial after data space fusion. The effect of present boosting strategy of the AdaBoost algorithm can be seen from the error plots shown in Fig. 2 through Fig. 5 for the four sets of test data used in the analysis. The error rate is defined as the fraction of misclassified test samples, and the plots show the variation of error rate with the number of base classifiers in the ensemble for AdaBoost. A notable point from these plots is that the boosting strategy yields good results only when the base classifier is weak. For example, the selected
176
Divya Somvanshi and R.D.S. Yadava
threshold classifier results in the initial error rates for the sonar and heart data close to 50%, and for the breast-cancer and diabetes data close to 25%. The AdaBoosting reduces error rate significantly in case of former, Fig. 2 and Fig. 3, but not so much in case of latter, Fig. 4 and Fig. 5. The similar impact on the classification rates is apparent from the results in Table 2. Another notable point is that the data space fusion facilitates better boosting.
Table 2: Adaboost classification results obtained for different conditions of preprocessing and fusion. Data
Sonar Heart Haberman Breast-Cancer Pima-Indian Diabetes
Classification Rate (%) Vector Dimensional Autoscaling Autoscaling 53.66 59.76 66.31 67.92 75 71.7
Data Space Fusion 75.61 79.68 76
Feature Space Fusion 53.66 70.06 75
66.7
76.7
78.4
77.7
vector autoscaling
dimensional autoscaling 1
error rate
error rate
1
0.5
0
20
40
60
0.5
0
80
data space fusion
60
80
1
error rate
error rate
40
feature space fusion
1
0.5
0
20
20
40
60
80
0.5
0
20
40
60
80
X - axis: number of threshold classifiers in AdaBoost ensemble
Figure 2: Variation of error rate for sonar test data with ensemble size in AdaBoost algorithm for linear threshold classifiers.
Information Fusion based on Multiplicity
177
vector autoscaling
dimensional autoscaling 1
error rate
error rate
1
0.5
0
20
40
60
0.5
0
80
data space fusion
60
80
1
error rate
error rate
40
feature space fusion
1
0.5
0
20
20
40
60
0.5
0
80
20
40
60
80
X - axis: number of threshold classifiers in AdaBoost ensemble
Figure 3: Variation of error rate for heart test data with ensemble size in AdaBoost algorithm for linear threshold classifiers. vector autoscaling
dimensional autoscaling 1
error rate
error rate
1
0.5
0
20
40
60
0.5
0
80
data space fusion
60
80
1
error rate
error rate
40
feature space fusion
1
0.5
0
20
20
40
60
80
0.5
0
20
40
60
80
X - axis: number of threshold classifiers in AdaBoost ensemblle
Figure 4: Variation of error rate for Haberman test data with ensemble size in AdaBoost algorithm for linear threshold classifiers.
178
Divya Somvanshi and R.D.S. Yadava vector autoscaling
dimensional autoscaling 1
error rate
error rate
1
0.5
0
20
40
60
0.5
0
80
data space fusion
60
80
1
error rate
error rate
40
feature space fusion
1
0.5
0
20
20
40
60
80
0.5
0
20
40
60
80
X - axis: number of threshold classifiers in AdaBoost ensemble
Figure 5: Variation of error rate for pima-indian diabetes test data with ensemble size in the AdaBoost algorithm for linear threshold classifiers.
Discussion and Conclusion Sonar data is a complex distribution of energy of chirped sonar signals in different frequency bands returned from two types of targets (metallic cylinder and cylinder shaped rock). All the attributes are therefore of the same kind. Besides, there could be appreciable correlation between different attributes in raw data. The best result for this data set is obtained by the combination of data space fusion with AdaBoosting. The error rate on the training data set drops to 0 after 20 rounds of base learner creation. On the test data set however the error rate continued to decrease up to 80 rounds, Fig. 2. The use of other preprocessing methods did not produce much boosting for ensemble sizes. The use of dimensional autoscaling and feature space fusion reduced the error rate significantly after only few rounds of iteration. Later, the error rate increased. The vector autoscaling did not produce boosting effect in any condition, Fig. 2. Heart data is diagnostic cardiac data based on SPECT (single proton emission computed tomography) images for patients belonging to two categories: normal and abnormal. The classification result in Table II and error result in Fig. 3 indicates a trend similar to that for sonar data. The combination of data space fusion with AdaBoosting yields the best result. The attributes of image data are also likely to be correlated.
Information Fusion based on Multiplicity
179
In contrast, the Haberman’s survival data after breast cancer surgery and the Pima Indian Diabetes data consist of patient’s history and physiological parameters like number of positive axillary nodes and body glucose level. The variables in these data sets are of different types and do not seem to have direct correlation. The AdaBoosting in any combination of preprocessing fusion strategy does not yield significantly enhanced classification rate. It appears therefore that the strategy of multiple preprocessors based fusion of information enhances the efficiency of the AdaBoost algorithm in those multivariate situations where the variables are of the same type, and are possibly correlated. The data preprocessing by the vector autoscaling and the dimensional autoscaling followed by data space fusion and feature extraction by principal component analysis enhances the classification efficiency of the AdaBoosted linear threshold classifier by 12% to 22% for the sonar and heart data compared to the AdaBoosting without fusion. We thus conclude that by bringing in diversity in the preprocesssing methods for data representation to the feature extractor yields more accurate feature set, which further enhances the efficiency of the AdaBoost algorithm.
Acknowledgment This work is supported by the Government of India, Defence Research & Development Organization Grant No. ERIP-ER-0703643-01-1025. The authors are thankful to Mr. Prashant Singh and Miss Prabha Verma for their support and several useful discussions.
References [1] A. K. Jain, R. P. W. Duin, and J. Mao. “Statistical pattern recognition: a review”, IEEE Trans. Pattern Analysis and Machine Intelligence, 22 (1), pp. 437, 2000. [2] R. J. Schalkoff. Pattern Recognition – Statistical, Structural and Neural Approaches, chapter 1, Wiley & Sons, 1992. [3] T.G. Dietterich. “Ensemble learning”, in The Handbook of Brain Theory and Neural Networks, 2nd ed., pp. 405-408, M.A. Arbib, (ed.), The MIT Press, Cambridge, MA, 2002. [4] R. E. Schapire. “The strength of weak learnability”, Machine Learning, 5 (2), pp. 197-227, 1990. [5] T. G. Dietterich. “Ensemble methods in machine learning”, in Lecture Notes in Computer Science, vol. 1857, pp. 1–15, J. Kittler, F. Roli (eds.), SpringerVerlag, Berlin Heidelberg, 2000. [6] Y. Freund, Y. Mansour, R. Schapire. “Why averaging classifiers can protect against overfitting”. In Artificial Intelligence and Statistics 2001 (Proceedings of the Eighth International Workshop: January 4-7, 2001, Key West, Florida), T. Jaakkola, T. Richardson (eds.), San Morgan Kaufmann Publishers, Francisco CA, 2001.
180
Divya Somvanshi and R.D.S. Yadava
[7] D. Chen, J. Liu. “Averaging weak classifiers”, in Lecture Notes in Computer Science, vol. 2096, pp. 119-125, J. Kittler and F. Roli (eds.), Springer-Verlag, Berlin Heidelberg, 2001. [8] G. Levitin. “Threshold optimization for weighted voting classifiers”, Naval Research Logistics, 50, pp. 322-344, 2003. [9] Y. Freund, R. E. Schapire. “A decision-theoretic generalization of on-line learning and an application to Boosting”, Journal of Computer and System Sciences, 55 (1), pp. 119–139, 1997. [10] Cuneyt Mertayak (2007, may 25). AdaBoost, version 1.0. Available at: http://www.mathworks.com/matlabcentral/fileexchange/21317-adaboost. [11] R. G. Osuna, H. T. Nagle. “A method for evaluating data preprocesssing techniques for odor classification with an array of gas sensors”, IEEE Trans. Syst. Man Cybern. B, 29, pp. 626–632, 1999.