Information Guided Data Sampling and Recovery using Bitmap Indexing Tzu-Hsuan Wei*
Soumya Dutta†
Han-Wei Shen‡
The Ohio State University
A BSTRACT Creating a data representation is a common approach for efficient and effective data management and exploration. The compressed bitmap indexing is one of the emerging data representation used for large-scale data exploration. Performing sampling on the bitmapindexing based data representation allows further reduction of storage overhead and be more flexible to meet the requirements of different applications. In this paper, we propose two approaches to solve two potential limitations when exploring and visualizing the data using sampling-based bitmap indexing data representation. First, we propose an adaptive sampling approach called information guided stratified sampling (IGStS) for creating compact sampled datasets that preserves the important characteristics of the raw data. Furthermore, we propose a novel data recovery approach to reconstruct the irregular subsampled dataset into a volume dataset with regular grid structure for qualitative post-hoc data exploration and visualization. The quantitative and visual efficacy of our proposed data sampling and recovery approaches are demonstrated through multiple experiments and applications. 1
I NTRODUCTION
The computation power of modern supercomputers has grown rapidly in the recent years. According to the latest report, the most powerful and fastest supercomputer is able to reach the peak performance of more than 125 peta-FLOPS (125 × 1015 floating-point operations per second). Benefiting from the immense computation power, scientists are able to run high-resolution simulations in various scientific disciplines, such as climate modeling and computational fluid dynamic, and produce large-scale datasets. To store, manage, and explore such large-scale scientific datasets, appropriate approaches are crucial. Data scientists have applied several techniques to tackle the problem of accelerating analysis and visualization for large datasets. In particular, parallel computing have been used to speed up the computation. However, the amount of data generated through highresolution scientific simulations put a very high demand on data storage and communication bandwidth. A strategy to conquer this challenge is to create a data representation to reduce the data size and apply data processing and analysis on the compact data representation. The compressed bitmap indexing [2, 36] is one of the emerging data representation used for large-scale data exploration [26, 27, 29, 32, 33]. The benefits of representing raw data by compressed bitmaps are: (1) It can be created at simulation time, which avoids storing and transmitting full-resolution data. (2) It can efficiently respond to a value-based query, which is a common operation for data analysis and visualization. However, the effectiveness of the bitmap compression scheme based on run-length encoding is limited. Although the size of compressed bitmaps can be less than 30% in size compared with the raw data [29], it could * e-mail:
[email protected] † e-mail:
[email protected] ‡ e-mail:
[email protected]
be still too large to be stored or transferred. A viable solution to avoid storage or bandwidth limit exceeded for such large dataset is to perform data sampling before generating bitmaps. This can further reduce the bitmap size since fewer bits in a bitmap are set to 1 due to fewer samples, so that larger number of continuous 0s would appear more frequently in the bitmap, improving the effectiveness of runlength compression. Through incorporating sampling and bitmap compression schemes, a bitmap indexing-based data representation can be created in smaller size which is more flexible to meet the requirements of different applications. While performing sampling before generating bitmaps, a desired property of the sampling approach is to be able to preserve the statistical characteristics of raw data within the compact subsampled data. The stratified random sampling (StRS) [6] is such an approach which draws samples from pre-cluster groups (strata). An advanced stratified random sampling (AStRS) proposed by Su et al. [28] incorporates StRS sampling and bitmap indexing to provide better characteristic-preserved subsampled data. However, there are two remaining limitations when applying existing bitmap indexing-based data representation for data exploration and visualization. First, the data complexity in each stratum is ignored when performing data sampling so that the same amount of samples are drawn from each stratum regardless of its complexity. This can lead to loss of information in the strata with high data complexity but keeping redundant information in the strata with low data complexity. Hence, there is a need to draw samples according to the information complexity in each stratum in order to present more representative samples in the subsampled dataset with compact size. Furthermore, since the characteristic-preserved sampling method is usually stored as an irregular grid data, there is a need to reconstruct the data into a regular grid volume when applying specific types of data analysis or visualization, such as volume rendering, isosurface rendering, or local statistical-based applications [10, 19, 22, 33]. However, it is challenging to have a reconstructed data volume close to the original data volume in terms of the quality of samples as well as local statistical properties. In this paper, we propose two approaches to tackle these two limitations for data analysis and visualization when using bitmap indexing-based data representation. First, we propose an information guided stratified sampling (IGStS) to store more representative samples while preserving characteristics of the raw data and keep the size of the data representation small. We apply AStRS that subdivides the raw samples into several strata and draws samples from each stratum. The strata are created by partitioning the data space into multiple non-overlapping blocks and partitioning the whole data value range into multiple bins. Instead of drawing samples evenly in each block, we calculate the information entropy to examine the data complexity in the block and determine the number of samples to draw according to the entropy value. More samples are drawn from regions with higher entropy (higher data complexity) and fewer samples for regions with lower entropy (lower data complexity). Through this adaptive sampling approach, the proposed bitmap indexing-based data representation allows superior quality of data analysis and visualization while keeping the storage cost low. Second, when a regular volume with extended number of samples as needed, we propose a novel data recovery approach from irregular subsampled data that incorporates the samples’ spatial information
and value distribution preserved in each local region. We transform the data recovery problem to the optimal assignment problem and solve it using the Hungarian algorithm [18]. The idea is to assign a value to each spatial location based on the likelihood of each value estimated from the neighboring samples, and to keep the same value distribution as the preserved one in each local region. This ensures the value compositions and the local statistical properties in the reconstructed data are similar to those of raw data. Through solving the assignment problem, our approach produces recovered data with small errors in terms of sample values and local statistical properties and thus is able to provide qualitative data analysis and visualization. 2
R ELATED W ORK
Benefiting from the huge computation power, scientists are able to run high-resolution scientific simulations in various scientific disciplines, such as physical phenomena and climate modeling, with generating extreme scale datasets. However, due to the limitation of capacity and bandwidth, scientists usually first reduce the data scale by only storing a subset of the raw data and apply further processes and analysis on the compact data representation. Wavelet compression is one of the notable data compression technique which has been extensively applied in data analysis and visualization field. Woodring used wavelet compression in JPEG2000 to provide a bit rate control mechanism to vary data transfer time versus data quality for remote data analysis and visualization [35]. Lee and Shen applied the discrete wavelet transform to reduce the storage overhead of the integral histogram for efficient local histogram queries [19]. Wavelet compression can reduce a large amount of data size, however, it has to take additional CPU cycles to transform the data which could be a burden work in scientific simulation. Distribution-based data representation is another promising approach of reducing data scale for analyzing and visualizing large-scale datasets [9, 14, 16, 24]. Thompson et al. [30] stored the histogram for samples in a local block to form a histogram-based data representation called hixels with small overhead. Liu et al. [20] used per-voxel Gaussian Mixture Model to model the samples in a local block to produce compact data representation. Dutta et al. [7] also model the sample in a local block by Gaussian Mixture Model in an in-situ simulation for efficient in-situ analysis and visualization. A sampling-based approach [21] has been applied to reconstruct the data value from a distribution-based data representation for data analysis and visualization [4, 11]. However, the spatial information and data coherency are not considered in their work when reconstructing the data, which could lead to high data value variation and low-quality visualization. Recently, to improve the accuracy of sampling quality for the distribution-based data representation irregular-shaped homogeneous partitioning is proposed by Dutta et al. [8]. In another work, Wang et al. [31] incorporate spatial distribution information in distribution-based data modeling which shows improved analysis quality. Sampling-based data representation is a common solution applied in the data analysis and visualization field. Woodring et al. [34] applied KDTree-based stratified sampling to store level-of-detail sample data in a particle simulation for interactive analysis and visualization. However, data reorganization is necessary before performing sampling which increases the computation time of creating representative data. Su et al. [28] applied stratified sampling which divides data into multiple strata based on the data spatial and value information. However, they ignore the data complexity and draws the same amount of samples from each stratum, which could lead to insufficient information stored in the regions with high data complexities. To reconstruct a sample data for high-quality data analysis and visualization, a sophisticated approach is to construct the distribution from the subsamples first and use the method of reconstructing distribution-based data representation. However, this suffers the same issue that spatial information and data coherency
b0 10111010 01011100 11000110 1011100 00000000 b1 00010010 01011111 11010111 1010000 00011000
50% sampling b0 00110010 01010000 00000110 0011000 00000000 b1 00000010 01011000 10000101 1000000 00001000
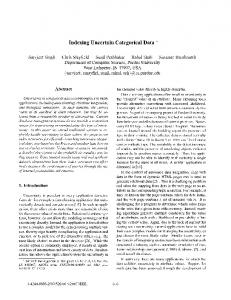
Figure 1: An example of performing the stratified sampling on two bit vectors representing two bins b0 and b1 . Upper row: two bit vectors with full samples. Lower row: two bit vectors after drawing 50% of the samples from each block. are not considered. 3 BACKGROUND In this section, we describe the essential techniques that our approach relies on, bitmap indexing and stratified sampling. 3.1 Bitmap Indexing Bitmap indexing is an efficient indexing structure that has been applied in many query-based visualization applications [26, 27, 33]. Because of the advantage of bitwise operations supported by the computer hardware, it is able to quickly respond to the data value query. To construct a bitmap for a scientific dataset, the whole data value range is divided into several groups first (similar to histogram bins). A bitmap is a table-like data structure where one column represents one value range (one bin) and is stored in one bit vector, whose length is the same as the number of data elements. In each bit vector, a bit is set to 1 if the value in that corresponding voxel falls into the bin; otherwise it is set to 0. In addition to providing efficient query response, bitmap indexing can also be applied to reduce the data size overhead with the compressed version. Several sophisticated compression schemes have been proposed to shrink the size of the bitmap, and mostly are based on the run-length encoding scheme, such as Byte-aligned Bitmap Code (BBC) [2] and Word-Aligned Hybrid (WAH) [36]. In this work, we apply the WAH32 method to store the subsamples. 3.2 Stratified Random Sampling The stratified random sampling (StRS) is a commonly used approach to improve the simple random sampling (SRS) by preserving the characteristics of the raw data. The concept of StRS is to subdivide the raw data into several strata and randomly draw the same percentage of samples form each stratum. A common way of creating strata is to partition the data space into multiple non-overlapped spatial regions. Compared to SRS, the representativeness of the subsampled data drawn by StRS can be significantly improved by preserving the spatial distribution of the raw data. This stratified sampling is also naturally suitable for large-scale scientific simulation since the simulated data generated region by region (each region is computed by a processing unit) can be thought of separating the data into spatial strata [34]. An advanced stratified random sampling (AStRS) is to divide the samples into several strata based on multiple data properties, which intends to preserve multiple characteristics of raw data simultaneously. One of the AStRS proposed by Su et. al [28] is to sample data based on the spatial location and data value in order to preserve both spatial distribution and value distribution simultaneously. They leveraged bitmap indexing to subdivide data samples into several value ranges (bins) first. A bit vector is created as described in Section 3.1. Each bit vector is then subdivided into several non-overlapped sectors with equal length which is the same concept as spatial partitions. To create subsampled data, even samples are drawn from each sector in a bit vector and the same sampling percentage is applied to all other bit vectors. Figure 1 shows an example of the stratified random sampling using bitmap indexing. Suppose 50% data are drawn from two bit vectors representing two bins b0 and b1 , which are shown
Figure 2: Comparisons between two data blocks with different data complexities. Drawing samples evenly in both regions may cause insufficient information stored in the data block shown in the left and redundant information stored in the right data block. Sample size in each spatial partition is defined by its data complexity
Draw samples evenly from each histogram bin in each spatial partition
Figure 3: The concept of our information guided stratified sampling. in the upper part. For each bit vector, we partition the space into 5 blocks and draw samples from each block. To perform drawing samples on a bit vector, we randomly turn off 50% of the bits in each block. The sampled bit vector is shown in the lower part. 4 I NFORMATION G UIDED S TRATIFIED S AMPLING (IGS T S) In this section, we introduce our information guided stratified sampling approach which stores representative samples that preserve the properties of the raw data and keep the sample size small simultaneously. We follow the concept of StRS used in [34] which partitions the data space into multiple non-overlapped blocks and draw samples from each block. It draws samples across the whole data volume, so the information in all the regions is ensured to be retained. However, ignoring the data complexity and drawing samples evenly over the data volume results in imbalanced information contained in the subsampled data of different region. Drawing fixed number of samples from each region can lead to information loss in regions that have high data complexity and redundant information in regions that have low data complexity. Rather than drawing the same percentage of samples from each spatial partition, we draw samples accordingly based on its data complexity, which ensures that sufficient information is stored for each region. In the mean time, the storage overhead of subsampled data is managed as compact as possible. Figure 2 illustrates the issue of drawing samples evenly regardless of the data complexity in each spatial partition. We select two different regions in the test data and display their histograms to show the data complexity. Given a fixed number of samples to be stored for each region (suppose 10 samples in this example), the region containing multiple distinct values shown in the left image cannot be well represented by only 10 samples. On the contrary, using 10 samples to represent the region with homogeneous value, like the data block shown in the right image, is unnecessary. 4.1 Entropy-based Stratified Sampling We apply information theory to evaluate the data complexity for determining the number of samples that should be drawn from each local region. Shannon entropy [25] is a common approach for evaluating the information contained in the samples, which is used to determine the data complexity in our work. We divide the whole value range of the raw data into several value interval (bins) to create a sample histogram and compute the entropy value from it. Let X = x1 , x2 , · · · , xn be the value interval for each bin, n be the number of bins, and pxi be the probability of a data value falls into xi . The entropy of data samples can be defined in Equation 1: n
H(X) = − ∑ p(xi )log2 p(xi ) i=1
(1)
Figure 4: An example of creating a compressed bit vector from the samples ID using WAH32. The data size is 1000 in this example. The minimum entropy value is 0 which occurs when all sample values fall into one value range and the maximum entropy value is log2 n which occurs if all the probabilities p(xi ), i = 1 · · · n are the same. By examining the entropy value, we are able to discriminate the data complexity between different data. A smaller entropy value indicates fewer distinct values across samples (lower data complexity) and a larger entropy value indicates more distinct values across samples (higher data complexity). In order to accurately represent the raw data using the subsampled data, it’s necessary to take enough samples to cover all distinct values and retain the similar value compositions. This concept is similar to AStRS [28] which draws the same percent of the samples from each value range. In our work, we determine the sampling percentage s by entropy values, and the mapping function is defined as: s=
2H(X) ×f n
(2)
where f is a sampling factor to allow users to vary the sample size. The entropy value H(X) can be thought of as the minimum number of bits are required on average to describe the variable X [13]. In other words, the number of events occurs in the observing entity is at least 2H(X) . For a histogram, at least 2H(X) of bins is required to describe the variable. To define the sampling percentage, we normalize it by the total number of bins for the histogram. Once the sampling percentage is defined, we then draw samples from each value interval in order to maintain the same local histograms as that of full samples. In our work, only one sample is drawn in the homogeneous region where the entropy value is 0. Figure 3 shows the overall concept of our sampling approach. 4.2 Subsampled Data Creation using Bitmap Indexing To record samples with a small storage overhead, we create the subsampled data by utilizing compressed bitmap indexing. One bitmap is created for each spatial partition. Rather than creating a raw bitmap for the whole data, and then performing sampling on each bit vector and compressing it, we create compressed bitmap directly during sample selection. As mentioned above, while drawing samples in each partition with the sampling percentage defined above, we select a subset of samples for each value range. Samples in each group of value range can be determined when constructing the value histogram for computing the entropy value by scanning through the entire set of data points in a region. We then randomly select a number of samples from each group and store them in the order of voxel IDs. By knowing the voxel ID for each sample, the number of consecutive 0s or 1s can be easily retrieved to perform run-length encoding. Figure 4 shows an example of creating a compressed bit vector from the samples’ voxel IDs using WAH32. Suppose the whole data size is 1000 in this example. The first line shows the voxels’ ID corresponding to the samples drawn from a region. The second line shows groups with multiples of 31 bits that categorized to fill-word and literal-word, and each group is encoded accordingly in a word (32 bits) shown in the third line. By leveraging the compressed bitmap indexing technique [36], all the bitmaps generated from all spatial partitions can be merged efficiently by applying OR operations between the compressed bit vectors. This makes our sampling approach suitable for large-scale scientific simulation running in the distributed system.
A1
A2
A3
A4 A1
Cost11
A
T1
Figure 5: The comparisons between the bitmap generated from the data within a local block (A), and the bitmap generated from the data of one row (B). To further reduce the storage cost of the subsampled dataset, we apply a data reordering scheme when storing samples using bitmap indexing. As mentioned above, WAH uses run-length encoding to encode consecutive 0s or 1s and store it only by one word (32 bits), which implies it can achieve higher compression rate if more consecutive 0s or 1s appear in a bit vector. In general, the order of bits in a bit vector is the same as that of voxel IDs which follow the order of data elements stored in the disk (row-major order). However, the run length of consecutive 0s or 1s is usually short when using row-major order for creating a bit vector due to data incoherence. Instead, we rearrange the bits in block-major order when creating a bit vector, where the block size is defined by the user. Figure 5 shows an illustration of the difference between using row-major and block-major order for creating bitmaps. The data value retrieved from a local block with size 103 (shown in A) is uniform and the data value retrieved from one row along the x dimension has higher variance (shown in B). The bit vectors created for A and B are shown horizontally in the upper figure and lower figure, respectively. The bit set to 1 is colored black and the bit set to 0 is colored white. In each bitmap, 10 bins (y axis) and 1000 data points (x axis) are used. As shown, the bitmap for data A only has one bit vector that has bits set to 1, so we can only use 10 words to store the bitmap (1 word for 1 bit vector). On the other hand, the bitmap for data B needs more storage since bins from bin 4 to bin 8 need several words to record the discontinuities in those bit vectors. Therefore, the size of the bitmap can be reduced a lot when storing a bit vector in the block-major order. Error Pre-Calculation
In our work, the sampling percentage for each spatial partition is determined by Equation 2. In order to allow flexible sample size to meet user requirements, we add a sampling factor f in Equation 2 to vary the sample size. To find out the desired sample size, we may need to compute the errors between the raw data and multiple subsampled datasets with distinct f values, which is a time-consuming process. Instead, we provide an error pre-calculation method to estimate the errors without performing sampling multiple times. For evaluating the quality of the sampled data, we consider the differences of mean, variance and entropy values between sampled data and raw data in each spatial partition as the error metrics. After scanning through the data once, we can compute the entropy value for each spatial partition, and map it to a sampling percentage using Equation 2 with a given f . Thus, we know the count of samples for each bin k in each partition t (scountkt ) by the multiplication of the total count of bin k in partition t and the corresponding sampling percentage. The mean value of the sampled data in partition t then can be determined as follows: Meant =
∑nk=1 (scountkt × bincentervk ) ∑nk=1 scountkt
T2
T3
T4
A2 A3 A4
T1
T2
T3
71 75 88 63
52 61 60 98
46 48 46 10 45 94 74 7
(a)
B
4.3
Cost41
(3)
n is the number of bins determined by the user, bincentervk is the bin center value for bin k, which can be defined when knowing the data value range and the number of bins n. By varying the
(b)
T4 A1 A2 A3 A4
T1
T2
T3
71 75 88 63
52 61 60 98
46 48 46 10 45 94 74 7
T4
(c)
Figure 6: An example of an assignment problem. (a) A1, A2, A3, and A4 represent four agents and T1, T2, T3, and T4 represent four tasks. One cost value is associated with each agent and task. (b) An example of a cost matrix. (C) The assignment result for the cost matrix shown in (b) f value and using Equation 2 and 3, we can compute the mean value for each partition for different sample size. The variance value for each partition can be computed in a similar way and the entropy value can be computed using Equation 1 when knowing the probability of samples’ values fall into the bin k in partition t, which is scountkt / ∑nk=1 scountkt . After computing the errors between the raw data and the subsampled data using one of error metrics for all partitions, we can either select the maximum error or compute the average error to determine the accuracy level for each f . The user then chooses an f based on accuracy levels when performing the sampling procedure. 5
R ECOVERING DATA BY S OLVING A SSIGNMENT P ROBLEM
In this section, we introduce a novel data recovery approach to reconstruct the data volume for further qualitative analysis and visualization from a subsampled dataset. We transform our data recovery problem to an optimal assignment problem [23], so we first briefly introduce the assignment problem, and then introduce our data recovery approach. 5.1
Assignment Problem and Hungarian Algorithm
Suppose there are a number of agents and a number of tasks and we want to assign the tasks to the agents. An agent can perform any task with different cost depending on how he/she is familiar with the task. A minimum cost assignment problem is to exactly assign one agent to one task and each task is only assigned to one agent such that the total cost of the assignment is minimized. The Hungarian algorithm [18] is the most notable approach that solves the problem in polynomial time. Figure 6a shows an illustration of an assignment problem which has four agents (A1 - A4) and four tasks (T1 - T4). The corresponding cost matrix is shown in Figure 6b, and the final assignment result is shown in Figure 6c. For more details of solving the Hungarian algorithm please refer to Kuhn and Yaw’s article [18]. 5.2
Data Value Assignment
To produce a reconstructed data close to the raw data, we solve the data recovery problem by applying the solution of a general assignment problem. The goal of our data recovery is to generate reconstructed data that have a similar value histogram to that of the raw data locally and globally. In this section, we introduce how to transform our data recovery problem to an assignment problem. From our IGStS sampling approach introduced in Section 4, we are able to keep sample values after binning and their locations at the original full-resolution data volume using bitmap indexing. To reconstruct the full-resolution data volume from the subsampled data, we assign one value within the whole data value range to each location where has no data value (denoted as Precover hereafter). To reduce the problem size, we partition the whole data value range into a number of groups (bins), and assign bin center values to Precover points during the reconstruction. This also matches the data structure of our sampling-based bitmap indexing that one bit vector records the points belong to the corresponding bin. Therefore, a bin center value bi can be referred to as the task and a location of Precover can be
Frequencies of the raw data
Difference of frequency = Number of Precover assigned by this value
Frequencies of the sampled data
Figure 7: An example of determining the number of agents based on the value histograms of the subsampled data and the raw data referred to as the agent to form an assignment problem. To create a cost matrix, the total number of agents should be the same as the total number of tasks. In our case, the number of bins is usually smaller than the number of Precover points, so multiple Precover points are possible to be assigned by the same bi value. Therefore, when creating a cost matrix, we duplicate columns multiple times to generate a square cost matrix. The number of duplication for each bi is determined by the difference of the bin frequency between the the original raw data and the sampled data, f reqdi f f (bi ), which is defined as f reqraw (bi ) − f reqsampled (bi ). The f reqraw (bi ) can be stored as a metadata, which could be a small storage overhead if only the nonzero bin frequencies are stored in each partition. On the other hand, we can also estimate the f reqraw (bi ) by f reqsampled (bi )/s, s is the sampling percentage in each region. Figure 7 shows an illustration of the idea above. The red bars represent f reqsampled (bi ), and the blue bars represent f reqraw (bi ). The yellow bar is f reqdi f f (bi ) for bin i. The total number of the Precover points Ntot is defined as follows: B
Ntot =
B
∑ Nassign
i=1
bi
=
∑ f reqdi f f (bi )
(4)
i=1
where B is the number of bins, Nassigni is the number of Precover points to be assigned by value bi , and the size of the cost matrix is defined as Ntot × Ntot . To determine the cost values in the cost matrix, we collect the samples around each Precover point and estimate the occurrence frequency of each value bi , and assign a weighted value to the corresponding element (Precovery , bi ) in the cost matrix. The detail of creating the cost matrix is introduced in the next section. Our approach then assigns values to all the Precover points by solving the assignment problem. In our work, we transform our problem to a maximum assignment problem. To solve a maximum cost assignment problem using Hungarian algorithm,we can replace a cost value with max(costi ) − costi , i = 1, 2, · · · , Ntot · Ntot . We use dlib library [15] to solve the assignment problem. Since the performance of solving assignment problem could be slow if Ntot is large, we reduce the problem size by partitioning the data space into several blocks and reconstructing the data block by block. This matches our IGStS sampling scheme and also allows our recovery process to be easily parallelized. 5.3
Cost Matrix
To estimate the occurrence frequency of each value bi for a Precover point, we take the value composition around Precover for reference. We collect the samples in the neighborhood region of Precover and count the number of samples’ value belong to bi . The reason is that each element is usually similar to its neighboring points’ values especially for the scientific datasets which have smooth data continuity in general. Through the value composition, we assume a value has a higher frequency of appearance at a Precover point if the value appears frequently around Precover . Furthermore, we weight the occurrence frequencies by the distance between the neighboring points and the Precover point. Instead of counting one for each sample, we weight the count by a Gaussian function centered at the Precover point. More specifically, the samples next to Precover have higher
weight, and the samples faraway from Precover have lower weight when adding the weighted count into the corresponding frequency accumulator (We define the weighted count for bi as wcountbi hereafter). On the other hand, if several points around Precover belong to bi , it implies that the values close to bi should also have higher occurrence frequencies than those values distant from bi . Therefore, we can also add wcounti into the accumulators of the bins close to bi . For such bin bu , the wcountbi is weighted again by the distance between bi and bu . The weighted frequencies for a Precover point are then added to the corresponding elements in the cost matrix. Each cost value Cbj,ki (at the jth row and the kth column in the cost matrix) represents the weighted occurrence frequency of a bin center bi at location j, which is defined as follows: Cbj,ki =
r
∑ e−
1 dist( j,vm ) 2 ) 2( σ
1
× e− 2 (
di f f (bi ,bu ) 2 ) σ
(5)
m=1
Here, vm is the sample point around location j. r is the number of vm points in the processing domain. dist( j, vm ) represents the Euclidean distance between vm and the point at j. bu is the bin center that vm ’s value belongs to. dist(bi , bu ) represents the difference between bin center bi and bu . σ is the standard deviation which can be defined by the user. To avoid high computational overhead of Cbj,ki , we can determine a threshold for filtering out the sample points distant from the point at j and another threshold for filtering out the sample points whose values are much different from bi . 6 C OMPARATIVE S TUDIES We perform comparative studies among different data sampling and recovery schemes to demonstrate the efficacy of the proposed approaches. In this study, we consider the storage cost, sampling rate and the quality of the reconstructed data for comparisons. Signalto-noise ratio (SNR) is commly used to estimate the quality of the reconstructed data, and is defined as the ratio of the power of a signal to the power of the noise in the signal. Higher SNR represents better quality in the signal. Among different sampling approaches, if a sampling approach well preserves the information in the original raw data, it will result in a better quality with a higher SNR value [17]. SNR value is defined as: SNR =
Psignal Pnoise
(6)
where the power of noise is calculated by the error between the original raw data and the reconstructed data. In this work, we use the logarithmic decibel scale for SNR, SNRdb = 10 × log10 (SNR). 6.1 Datasets Four datasets are used in the comparison studies: The Isabel dataset represents Hurricane Isabel from IEEEVIS 2004 Contest, where the Pressure field is used. The data resolution is 500 × 500 × 100 and the raw data size is 95MB. The Combustion dataset is a simulation of combustion phenomena provided by the Sandia National Laboratories, where the mixture fraction field is used. The data resolution is 480 × 720 × 120 and the raw data size is 158MB. The HD(CP)2 dataset is atmospheric simulations over Germany provided by the 2017 IEEE SciVis Contest, where the humidity field is used. The data resolution is 1178 × 1274 × 300 and the raw data size is 1.67 GB. The Turbine dataset is generated from a flow simulation, TURBO [5], which will be discussed in the section of In Situ application study. 6.2 Comparative Studies for IGStS To demonstrate the efficacy of our IGStS sampling approach using bitmap indexing, we compare our approach with StRS and AStRS which are introduced in Section 3.2. For qualitative comparisons, we
20
40
(c)
0
2
4
6
8
IGStS AStRS StRS
40
35
(d)
30 20
SNR vs storage for Turbine data
50
IGStS AStRS StRS
SNR
(b)
30
SNR vs storage for HD(CP)2 data
40
IGStS AStRS StRS
50
SNR
SNR
(a)
40
SNR vs storage for Combustion data
60
IGStS AStRS StRS
SNR
SNR vs storage for Isabel data
50
30 20
0
10
30
20
0
10
100
0
Storage Cost (MB)
Storage Cost (MB)
Storage Cost (MB)
50
10
20
Storage Cost (MB)
Figure 8: The comparison between our data sampling approach IGStS and two other approaches, AStRS and StRS, for different datasets.
RCcost
30
RCnearest
0
20
40
60
20
80
0
Sampling Rate (%) ×106
10
Isabel data
RCmean RCnearest RCcost
2
0
0.2
0.4
0.6
20
0.8
Jensen-Shannon divergence
×105
25
40
0
RCcost
0.2
0.4
RCnearest
0.6
Jensen-Shannon divergence
RCmean
10
×107 RCnearest
0
RCcost
20 10
20
0
Sampling Rate (%)
Combustion data
5
30
RCmean
RCmean
0 0
RCnearest
Sampling Rate (%)
Frequency
Frequency
4
RCcost
RCmean
Frequency
10
35 30
RCnearest
RCmean
40
SNR
RCcost
20
40
SNR vs sampling rate for Turbine data
50
40
SNR
30
SNR vs sampling rate for HD(CP)2 data
45
50
SNR
40
SNR
SNR vs sampling rate for Combustion data
60
×105
HD(CP) 2 data
RCmean
3
RCnearest
2
RCcost
1 0
0
0.2
0.4
50
0.6
100
Sampling Rate (%)
0.8
Jensen-Shannon divergence
Frequency
SNR vs sampling rate for Isabel data
50
Turbine data
15
RCmean
10
RCcost
RCnearest
5 0
0
0.2
0.4
0.6
Jensen-Shannon divergence
Figure 9: The comparison between our data recovery approach RCcost and two other approaches, RCnearest and RCmean , for different datasets.
generate a subsampled data from each approach and reconstruct a full-resolution data volume from the subsampled data. To make a fair comparison, we apply nearest neighbor algorithm to reconstruct data instead of our optimized data recovery since StRS is not designed for preserving the value distribution in a local region. The idea of nearest neighbor-based recovery is to search for the nearest neighboring sample around Precover and assign the sample’s value to Precover . Once the reconstructed data is generated, we compute the SNR value from the reconstructed data and the ground truth for all approaches, and then compare the performance of storage cost vs. SNR between them. To make a fair comparison, all the subsampled data is stored using bitmap indexing data structure with the same compression scheme. In addition, the reordering scheme introduced in Section 4.2 and the zlib compression for further storage reduction are used for all sampling approaches as well. In this experiment, the spatial partition size used in all approaches is 8 × 8 × 8, the number of histogram bins used for generating bitmap indexing is 256. The σ used in Equation 5 for creating the cost matrix is set to 2. Figure 8 compares three sampling approaches for the four test datasets. For our approach, we generate subsampled data with eight distinct sample sizes by adjusting f in Equation 2. We set f value to 0.5, 1, 2, 4, 8, 16, 32, and 64. The final sampling percentage for the whole subsampled data generated from IGStS is taken as the input sample size for StRS and AStRS, to make a fair comparison. From our observation, if the sample size is too small to preserve the characteristics of the raw data in the subsampled data, the quality (SNR value) of the reconstructed data for all the thee approaches are similar. However, if the sample size is large enough, our approach outperforms the other two approaches in terms of SNR value. The reason is that when increasing the total sample size, it will draw more samples in those regions with high complexities, which significantly improves the representatives of the subsampled data in those regions. On the other hand, although the increase of samples may not be that significant in those regions with low complexities, the samples could
still be enough to represent such regions. For AStRS and StRS, increasing the total number of samples will increase samples equally in each region, so the region with high data complexity can still be underrepresented, which results in low-quality data recovery in those regions. Furthermore, when the sampling rate becomes larger and larger, the SNR values for the three methods will converge, which can be observed in Figure 8. Overall, our IGStS can generate subsampled data that provide users more accurate and representative information of the raw data when exploring or visualizing the data. 6.3
Comparative Studies for Data Recovery
In this section, we show the performance of our data recovery method proposed in Section 5. In this experiment, we first generate subsampled data for each test data using the proposed IGStS approach with eight different sampling rates and then reconstruct each subsampled data to a full-resolution data volume. The sampling rates used for this test are the same as the ones we used in Section 6.2. The partition size for sampling procedure is 8 × 8 × 8 and the number of histogram bins for generating bitmap indexes is also set to 256. In this experiment, we compare our proposed data recovery approach (denoted as RCcost hereafter) with two approaches. The first one is a naive approach that assigns the average value of all sample points in the local region to each Precover point (denoted as RCmean hereafter). The second one is to apply nearest neighbor algorithm to reconstruct data (denoted as RCnearest hereafter). For the RCcost approach in this experiment, we store bin frequencies of the original raw data for each partition when sampling is performed, and take this metadata for evaluating the f reqdi f f in Equation 4. The additional storage overhead for the metadata is shown in Table 1. As shown, the storage costs are all less than 1% of the original raw data. For all the approaches, we recover data block by block, and the block size is determined by the one used in the sampling stage. The σ in Equation 5 is set to 2. In this experiment, we compute an SNR value from the raw data
SNR vs sampling rate for Combustion data
70
64 bins 128bins 256 bins 512 bins 1024 bins
sigma1 sigma2 sigma3 sigma4
20
30 20
60
30
0
20
40
10
SNR
block size 12 3
SNR
SNR
block size 8
40
0
20
40
50 40
60
30
0
Sampling Rate (%)
Sampling Rate (%)
(a)
20
Sampling Rate (%)
(b)
Storage cost vs sampling rate for Combustion data
(c)
40
64 bins 128bins 256 bins 512 bins 1024 bins
30 20
60 50
64 bins 128bins 256 bins 512 bins 1024 bins
40
10 0
SNR vs storage cost for Combustion data
70
40
SNR
SNR vs sampling rate for Isabel data
40
block size 4 3 3
Storage Cost (MB)
SNR vs sampling rate for Combustion data
50
0
20
Sampling Rate (%)
(d)
40
30
0
20
40
Storage Cost (MB)
(e)
Figure 10: The performance comparison of our IGStS and RCcost approach with different parameter settings. (a) is the comparison for using different block size. (b) is the comparison for using different σ . (c), (d), and (e) are the comparisons for using different bin size. Table 1: Additional metadata storage overhead for RCcost . size (MB) % of raw data
Isabel 0.48 0.5%
Combustion 1.198 0.76%
HD(CP)2 9.4 0.56%
Turbine 1.17 0.40%
and the reconstructed data for each recovery approach and compare their performance by SNR vs. sampling rate. The comparisons are shown in the upper row in Figure 9. As shown, our approach RCcost recovers data with smaller error than the approach RCmean and RCnearest in most of the cases, which evidences the quality of the reconstructed data is improved. Furthermore, we evaluate the quality of reconstructed data in terms of the local statistical property and show the comparison results in the lower row in Figure 9. We compute the local histogram at each grid point for both raw data and reconstructed data, and compute the error between two histograms by the Jensen−Shannon divergence. We then create a histogram for the error values for all the grid points to evaluate the local statistical property preserved in the reconstructed data. Figure 9 shows the comparison results for all the dataset with the smallest sampling rate used in the previous experiments, which is 1.8% for Isabel, 4% for Combustion, 2% for HD(Cp)2 , and 5.7% for Turbine dataset. As shown, our RCcost approach recovers samples with smaller errors of local histograms compared to the approach RCnearest and RCmean , which evidences the efficacy of RCcost . 6.4 6.4.1
Parameter Study Block Size for IGStS and RCcost
In this section, we compare different cases using different block sizes when applying IGStS sampling and RCcost approach for the Combustion dataset. In this experiment, we set the block size to 4, 8, and 12. The quality of the reconstructed data is also measured by the SNR value, sampling rate vs. SNR is compared between all results, shown in Figure 10a. From the experiment, when the sampling rate is low, larger block size results in greater SNR values. This is because using a large block in the sampling procedure can provide more samples to retain more precise value distribution in each block when the sampling rate is low. On the contrary, the case with a smaller block size has a greater SNR value when the sampling rate is higher. In general, using a smaller block for storing samples can reduce the data complexity in the block. Therefore if the sample size is enough to preserve the value distribution in the block, this results in higher accuracy of estimating the bin frequencies of the raw data in the case of the bin frequencies are not stored as a metadata. Thus the RCcost can recover samples closer to the raw data. 6.4.2 σ for RCcost data recovery In this section, we show different cases using different σ when applying the RCcost data recovery approach. We set the σ value to 1, 2, 3, and 4 to gather results for the Isabel data. The σ value used in Equation 5 is to determine the contribution of a point on its neighboring points when creating a weighted histogram for estimating the value occurrence probabilities. More specifically, when setting
σ to 1, only samples close to the Precover point can contribute large weights for the weighted histogram. On the other hand, when setting σ to 4, points far away from the Precover point can also contribute large weights. In this experiment, we also computed the SNR value from the reconstructed data and the raw data, and compared the SNR vs. sampling rate shown in Figure 10b. From the figures, we observe that cases with large σ have better quality results when the sampling rate is smaller. The reason is that the neighboring samples close to the Precover point could be too few to provide sufficient information for well estimating the occurrence probability, so we prefer to increase the weight for the samples that are far away to enhance the information. On the contrary, when the sampling rate is large, we merely consider the contributions from the neighboring samples close to the Precover points. 6.4.3 Bin Size for IGStS and RCcost In this work, the stratified sampling is applied to preserve the value distribution of the raw data, so the data points are categorized by their values first. Therefore, the value range (or the bin size) has to be defined before performing sampling. In this section, we conduct an experiment to examine the impact of the bin size to our works. We use 64, 128, 256, 512, and 1024 bins for creating the samplingbased bitmap for the Combustion dataset using IGStS. From Figure 10c, we observe that the bin size has little impact to our work when using smaller sampling rate, while it determines the quality of the subsampled data when larger sampling rates are applied. Although it provides better quality of the subsampled data when using larger bin size, the data size is also increased because more bit vectors are stored in the bitmap indexing. Figure 10d, shows the growth of the data size when the sampling rate increases, and Figure 10e shows the comparison of SNR vs. storage cost. From the observations, we recommend the user to set smaller bin size for the case of limited storage requirement; for the case of demanding high quality, larger bin size is preferred. 7 V ISUAL A NALYSIS In this section, we provide visual comparisons between our approach and other sampling and recovery approaches. We apply two different sampling approaches (IGStS, and AStRS) to generate the subsampled data and we reconstruct each sample data by applying RCcost , RCnearest , and RCmean approaches. For each dataset, the parameters used for sampling and reconstruction approaches are the same as the ones we used in the experiment in Section 6. We first visualize the reconstructed field by volume rendering which provides the information of the entire volume. Second, we compare the isosurface rendering results which provides a specific value information across the entire data. In this visual analysis, we use Paraview [12] to visualize all the rendering results. 7.1 Volume Rendering We first apply volume rendering to visually compare the reconstructed data between our approaches and others. Figure 11 shows the volume rendering of the data generated from HD(CP)2 project
(a) IGStS + RCmean (38.3 MB) (b) AStS + RCnearest (34.7 MB) (c) IGStS + RCcost (37.0 MB) (d) Ground Truth (1.67 GB) Figure 11: Visual comparisons for the HD(CP)2 dataset. The figures in the first row are the rendered images for the reconstructed data. The figures in the second row are the error images that show the differences between the raw data and the reconstructed data.
(a) AStRS + RCnearest
(b) IGStS + RCmean
(c) IGStS + RCcost
(d) ground truth
Figure 12: Visual comparisons of isosurfaces 0.42 of Mixture Fraction of Combustion data. The sampling percentage for (a) to (c) are all set to 0.16. The isosurfaces are extracted from the reconstructed fields which are generated from different sampling and recovery approaches.
which is provided by VISContest 2017. Figure 11a shows the rendering result using our IGStS sampling and RCmean recovery approach. Figure 11b shows the rendering result using AStRS sampling and our RCnearest recovery approach. Figure 11c is for the IGStS sampling and RCcost approach, both of which are our proposed approaches, and Figure 11d shows the ground truth. The rendered images for the reconstructed data are shown in the first row, and the error images between the reconstructed data and the raw data are shown in the second row. For the rendered image, we zoom into the region with higher data complexity to demonstrate the performance of the proposed approach. Figure 11a shows the worst rendering result compared to others. We see clear checker-box-like patterns in the rendering, and most of the detail information is missing as well. Figure 11b shows a better quality of rendering compared to Figure 11a. However, some detailed information is missing in the region with higher data complexity. Compared to Figure 11b, our result shown in Figure 11c preserves more detailed information and is closer to the ground truth. In addition, we provide clearer comparisons using error images shown in the second row which are generated by computing the L1 − norm distance between the reconstructed data and the raw data. To have a fair comparison, all the error images use the same color mapping, and the error value ranges are all fixed between 0 to 0.001, where most errors for the three test approaches are resided (the raw data value range is [2.4/times10−6 , 0.0146]). As shown in the error images, the other two approaches have larger errors than ours result, especially in the zoom-in regions. Overall, the rendering image generated by our approaches is closest to the ground truth and the sample data size is only about 2.2% of the raw data size. 7.2
Isosurface Rendering
In this section, we apply isosurface rendering to visually compare the isosurface extracted from the reconstructed data between our approaches and others. Figure 12 shows isosurface rendering of the
mixture fraction variable of the Combustion dataset. The mixture fraction variable represents the fraction of mass in the fuel stream, value 1 represents pure fuel and value 0 represents pure oxidizer. We set the isovalue to 0.42, which is a representation of the flame [1]. The sampling percentages used for Figure 12a to Figure 12c are all 0.16. As shown, Figure 12a has the worst rendering result compared to others. The entire surface is jagged and unsmooth, which implies the low-quality of reconstructed data generated from the AStRS sampling. Figure 12b shows better isosurface rendering compared to Figure 12a. However, when we zoom in to the region circled by red, the structure is broken and the details disappear. Compared to 12b, the structure is maintained and the surface is smoother from RCcost recovery, which can be seen in Figure 12c.
7.3
Surface Rendering
In this section, we visually compare the surface rendering of the Turbine dataset generated from TURBO simulations [5]. Figure 13 shows the comparisons between different approaches, where the Pressure value is used. As shown, our approach produces a higher quality reconstruction with smaller storage overhead shown in Figure 13c compared to the other methods. The rendering results generated from the other two approaches show more artifacts highlighted by black circles in Figure 13a and 13b. From the visualizations shown in this section, we demonstrate that our sampling approach can improve AStRS approach to better representing the raw data. We also prove that a proper data recovery approach is required to provide a qualitative post-hoc analysis and visualization from the subsampled dataset. In the next section, we will present the performance of the sampling approaches in the in situ simulations and the performance of the data recovery.
(a) AStRS + RCcost (15.86 MB)
(b) IGStS + RCmean (14.94 MB)
(c) IGStS + RCcost (14.94 MB)
(d) ground truth (about 290 MB)
Figure 13: Visual comparisons of Pressure field of Turbine dataset.
169.27 mins
8 8.1
Simulation raw I/O 3.67 mins
P ERFORMANCE S TUDY OF I N LINE DATA R ECOVERY
In situ sampling 2.273 mins
In situ I/O 1.45 mins
S ITU S AMPLING
AND
O FF -
Isabel Combustion
6
HD(CP) Turbine
2
4 2 0
0
0.5
1
Data recovering time vs block size
60
Isabel Combustion HD(CP) 2
40 20 0
4
Sampling Rate (%)
6
8
10
Block Size
In situ Sampling Performance
To demonstrate the in situ performance, we applied IGStS to a large scale flow simulation, TURBO [5], for data summarization. TURBO was developed at NASA and is used for studying the flow behavior in jet engine compressors. The simulation domain consists of a rotor with 36 blade passages and the spatial resolution of each passage is 151 × 71 × 56. The simulation outputs 5 variables in plot3d format and they are density, momentum in x direction, momentum in y direction, momentum in z direction, and energy. The in situ experiment was done in a cluster Oakley [3], which contains 694 nodes with Intel Xeon x5650 CPUs (12 cores per node), and 48 GB of memory per node. The simulation was run for 1800 time steps and the in situ call was made at every 10th time step. This required us to summarize data of 180 time steps. The in situ performance of our method is depicted in Table 2. It is observed that the in situ sampling takes significantly less time compared to the simulation run and is only a small fraction. Hence, our method does not overburden the simulation run. Furthermore, in our experiment, we have summarized all 5 variables produced by the simulation which will allow recovery of any user queried variable in the post-analysis phase. The raw data size for the rotor is 690 MB per time step, i.e., 124.2 GB for 180 time steps. In the absence of in situ summarization, we would have to store 124.2 GB data into disks for post-hoc analysis. However, using our in situ data summarization, the size of the output is reduced to only 19.79 GB which is much smaller compared to the raw data. Therefore, from the above discussion, it is evident that the proposed method is suitable for an in situ environment and can be a practical solution for efficient large scale data reduction which preserves important data properties and is able to recover data with smaller errors. 8.2
Data recovering time vs sampling rate
8
Computation Time (ms)
Simulation
Computation Time (ms)
Table 2: In situ timings of the proposed sampling method.
Off-Line Data Recovery Performance
Here we discuss the computation time of our RCcost recovery approach. In this work, we apply the Hungarian algorithm to solve our data reconstruction problem. Although the time complexity of the Hungarian algorithm was improved by Munkres [23] that achieved O(n3 ) time complexity, still, the computation time can be slow when the number of tasks n is significantly large. To avoid this problem, we reconstruct data block by block to reduce the problem size and perform the recovery process in parallel using nVidia CUDA and OpenMP. To evaluate the performance, we ran the recovery algorithm on a machine with an Intel Core i7-4770 CPU and 16GB of system memory, and an nVidia GeForce GTX 660 GPU with 2GB of texture memory. In the test, we stored the subsampled data using the compressed bitmap indexing with the reordering scheme, and
Figure 14: Performance comparisons for RCcost . Left: computation time for each block. Right: computation time vs. block size. the σ used in RCcost data recovery was set to 2. The performance test result of RCcost is shown in Figure 14. As shown in the left figure, the recovery computation time for each block is less than 0.008 second for all the dataset. When setting the block size to 83 , the total number of blocks in the test for Isabel (500 × 500 × 100), Combustion (480 × 720 × 120), HD(CP)2 (589 × 637 × 150), and Turbine dataset (151 × 71 × 56 × 36) is 51597, 81000, 112480, and 43092 respectively. When the sampling rate is large, the number of points to be recovered is little and the size of the cost matrix is small, which results in less recovery computation time. From the figure, the recovery computation overhead for the Combustion dataset is relative small. This is because the dataset has many homogeneous blocks where only one sample is stored, and we simply assign the stored sample’s value to all the points, without performing the Hungarian algorithm. Furthermore, we compare the computation time of RCcost vs. block size for the Isabel and Combustion dataset. As we can see, the computation time grows rapidly when using a larger block size in the recovery procedure. Therefore, we recommend to set block size to 103 or smaller for data recover using RCcost . 9
C ONCLUSION
AND
F UTURE
WORK
In this work, we proposed two approaches to tackle the potential limitations for data analysis and visualization when using bitmap indexing-based data representation. We first introduce a new information guided stratified sampling (IGStS) technique to adaptively determine sample size for each spatial partition according to its information entropy, and then draw samples evenly from each partition’s value range to preserve the characteristics of the raw data. Through this adaptive sampling approach, the proposed bitmap indexingbased data representation allows superior quality of data analysis and visualization while keeping the storage overhead low. Furthermore, we proposed an optimized data recovery algorithm that incorporates the sample’s spatial information and value distribution, preserved in each spatial partition. We transform the data recovery problem to the optimal assignment problem and solve it by the Hungarian algorithm. Our experimental results showed the quantitative and visual efficacy of our two approaches. The in situ application study also demonstrated that our sampling approach is applicable in an in situ environment. Currently, we use regular spatial partitioning for data sampling and recovery. In the future, we wish to study the influence of different irregular partitioning schemes, hoping that it
will allow us to preserve the value distribution of the raw data more accurately leading to further improvement in quality during data reconstruction. ACKNOWLEDGMENTS This work was supported in part by NSF grants IIS- 1250752, IIS1065025, and US Department of Energy grants DE- SC0007444, DEDC0012495, program manager Lucy Nowell. R EFERENCES [1] H. Akiba, K.-L. Ma, J. H. Chen, and E. R. Hawkes. Visualizing multivariate volume data from turbulent combustion simulations. Computing in Science and Engineering, 9(2):76–83, 2007. [2] G. Antoshenkov. Byte-aligned bitmap compression. In Proceedings of the Conference on Data Compression, DCC ’95, pp. 476–. IEEE Computer Society, Washington, DC, USA, 1995. [3] O. S. Center. Oakley supercomputer. http://osc.edu/ark: /19495/hpc0cvqn, 2012. [4] A. Chaudhuri, T.-H. Wei, T.-Y. Lee, H.-W. Shen, and T. Peterka. Efficient range distribution query for visualizing scientific data. In Proceedings of the 2014 IEEE Pacific Visualization Symposium (PacificVis), pp. 201–208, 2014. [5] J.-P. Chen, M. D. Hathaway, and G. P. Herrick. Prestall behavior of a transonic axial compressor stage via time-accurate numerical simulation. Journal of Turbomachinery, 130(4):041014, 2008. doi: 10. 1115/1.2812968 [6] W. Cochran. Sampling Techniques. Wiley, third ed., 1977. [7] S. Dutta, C. Chen, G. Heinlein, H. Shen, and J. Chen. In situ distribution guided analysis and visualization of transonic jet engine simulations. IEEE Trans. Vis. Comput. Graph., 23(1):811–820, 2017. doi: 10.1109/ TVCG.2016.2598604 [8] S. Dutta, J. Woodring, H. W. Shen, J. P. Chen, and J. Ahrens. Homogeneity guided probabilistic data summaries for analysis and visualization of large-scale data sets. In 2017 IEEE Pacific Visualization Symposium (PacificVis), pp. 111–120, April 2017. doi: 10.1109/PACIFICVIS. 2017.8031585 [9] L. J. Gosink, C. Garth, J. C. Anderson, E. W. Bethel, and K. I. Joy. An application of multivariate statistical analysis for query-driven visualization. IEEE Trans. Vis. Comput. Graph., 17(3):264–275, 2011. [10] Y. Gu and C. Wang. Transgraph: Hierarchical exploration of transition relationships in time-varying volumetric data. IEEE Trans. Vis. Comput. Graph., 17(12):2015–2024, 2011. [11] H. Guo, W. He, T. Peterka, H.-W. Shen, S. M. Collis, J. J. Helmus, undefined, undefined, undefined, and undefined. Finite-time Lyapunov exponents and Lagrangian coherent structures in uncertain unsteady flows. IEEE Transactions on Visualization and Computer Graphics, 22(6):1672–1682, 2016. doi: doi.ieeecomputersociety.org/10.1109/ TVCG.2016.2534560 [12] A. Henderson. Paraview guide, a parallel visualization application. 2007. [13] H. Jaenicke and M. Chen. An information-theoretic framework for visualization. IEEE Transactions on Visualization & Computer Graphics, 16:1206–1215, 2010. doi: doi.ieeecomputersociety.org/10.1109/ TVCG.2010.132 [14] C. R. Johnson and J. Huang. Distribution-driven visualization of volume data. IEEE Transactions on Visualization and Computer Graphics, 15(5):734–746, 2009. [15] D. E. King. Dlib-ml: A Machine Learning Toolkit. Journal of Machine Learning Research, 10:1755–1758, 2009. [16] J. M. Kniss, R. V. Uitert, A. Stephens, G.-S. Li, T. Tasdizen, and C. Hansen. Statistically quantitative volume visualization. In Proceedings of IEEE Visualization 2005, pp. 287–294, 2005. [17] U. Kohler and F. Kreuter. Data Analysis using Stata, 2nd Edition. StataCorp LP, 2009. [18] H. W. Kuhn and B. Yaw. The Hungarian method for the assignment problem. Naval Res. Logist. Quart, pp. 83–97, 1955. [19] T.-Y. Lee and H.-W. Shen. Efficient local statistical analysis via integral histograms with discrete wavelet transform. IEEE Transactions on Visualization and Computer Graphics, 19(12):2693–2702, 2013.
[20] S. Liu, J. Levine, P.-T. Bremer, and V. Pascucci. Gaussian mixture model based volume visualization. In Proceedings of the IEEE LargeScale Data Analysis and Visualization Symposium 2012, pp. 73–77, 2012. Received Best Paper Award. doi: 10.1109/LDAV.2012.6378978 [21] S. L. Lohr. Sampling: Design and Analysis, Advanced (Cengage Learning), Advanced series. Cengage Learning. [22] C. Lundstrom, P. Ljung, and A. Ynnerman. Local histograms for design of transfer functions in direct volume rendering. IEEE Transactions on Visualization and Computer Graphics, 12(6):1570–1579, Nov. 2006. doi: 10.1109/TVCG.2006.100 [23] J. Munkres. Algorithms for the assignment and transportation problems. Journal of the Society of Industrial and Applied Mathematics, 5(1):32– 38, March 1957. [24] C. Petz, K. P¨othkow, and H.-C. Hege. Probabilistic local features in uncertain vector fields with spatial correlation. Computer Graphics Forum, 31(3):1045 – 1054, 2012. [25] C. E. Shannon. Prediction and entropy of printed english. Bell Systems Technical Journal, 30:50–64, 1951. [26] Y. Su, G. Agrawal, and J. Woodring. Indexing and parallel query processing support for visualizing climate datasets. In ICPP, pp. 249– 258. IEEE Computer Society, 2012. [27] Y. Su, G. Agrawal, J. Woodring, K. Myers, J. Wendelberger, and J. Ahrens. Taming massive distributed datasets: Data sampling using bitmap indices. In Proceedings of the 22nd International Symposium on High-performance Parallel and Distributed Computing, HPDC ’13, pp. 13–24. ACM, New York, NY, USA, 2013. [28] Y. Su, G. Agrawal, J. Woodring, K. Myers, J. Wendelberger, and J. Ahrens. Effective and efficient data sampling using bitmap indices. Cluster Computing, pp. 1–20, 2014. doi: 10.1007/s10586-014-0360-5 [29] Y. Su, Y. Wang, and G. Agrawal. In-situ bitmaps generation and efficient data analysis based on bitmaps. In Proceedings of the 24th International Symposium on High-Performance Parallel and Distributed Computing, HPDC ’15, pp. 61–72. ACM, New York, NY, USA, 2015. [30] D. Thompson, J. Levine, J. Bennett, P.-T. Bremer, A. Gyulassy, V. Pascucci, and P. Pebay. Analysis of large-scale scalar data using hixels. In Proceedings of the 2011 IEEE Symposium on Large-Scale Data Analysis and Visualization (LDAV), pp. 23–30, 2011. doi: 10.1109/LDAV. 2011.6092313 [31] K. C. Wang, K. Lu, T. H. Wei, N. Shareef, and H. W. Shen. Statistical visualization and analysis of large data using a value-based spatial distribution. In 2017 IEEE Pacific Visualization Symposium (PacificVis), pp. 161–170, April 2017. doi: 10.1109/PACIFICVIS.2017.8031590 [32] T. Wei, C. Chen, J. Woodring, H. Zhang, and H. Shen. Efficient distribution-based feature search in multi-field datasets. In 2017 IEEE Pacific Visualization Symposium, PacificVis 2017, Seoul, South Korea, April 18-21, 2017, pp. 121–130, 2017. doi: 10.1109/PACIFICVIS. 2017.8031586 [33] T.-H. Wei, C.-M. Chen, and A. Biswas. Efficient local histogram searching via bitmap indexing. In Computer Graphics Forum, vol. 34, pp. 81–90, 2015. [34] J. Woodring, J. P. Ahrens, J. Figg, J. Wendelberger, S. Habib, and K. Heitmann. In-situ sampling of a large-scale particle simulation for interactive visualization and analysis. Comput. Graph. Forum, 30(3):1151–1160, 2011. [35] J. Woodring, S. M. Mniszewski, C. M. Brislawn, D. E. DeMarle, and J. P. Ahrens. Revisiting wavelet compression for large-scale climate data using JPEG 2000 and ensuring data precision. In IEEE Symposium on Large Data Analysis and Visualization, LDAV 2011, Providence, Rhode Island, USA, 23-24 October, 2011, pp. 31–38, 2011. doi: 10. 1109/LDAV.2011.6092314 [36] K. Wu, E. J. Otoo, and A. Shoshani. Compressing bitmap indexes for faster search operations. In SSDBM, pp. 99–108, 2002.