ARTICLE International Journal of Engineering Business Management
Information Management and Valuation Regular Paper
Sabah Al-Fedaghi1,* 1 Computer Engineering Department, Kuwait University, Safat, Kuwait * Corresponding author E-mail:
[email protected]
Received 5 August 2012; Accepted 27 August 2012 DOI: 10.5772/52800 © 2013 Al-Fedaghi; licensee InTech. This is an open access article distributed under the terms of the Creative Commons Attribution License (http://creativecommons.org/licenses/by/3.0), which permits unrestricted use, distribution, and reproduction in any medium, provided the original work is properly cited.
Abstract The aim of information lifecycle management is to develop a cost‐effective strategy for maintaining information assets, balancing the cost of maintaining information against business value. This paper contributes to development of theoretical information value based on a classification scheme that does not consider operational factors (e.g., storage, access). It concentrates on valuing information in terms of its type, organizational level and the extent of its effects. An information flow model provides the foundation for such categorisation. Keywords Information Lifecycle Management, Valuing Information, Information Flow
1. Introduction Many enterprises maintain huge amounts of information, often stored in various applications. In 2006, 161 million gigabytes of digital information was created, captured, and replicated [1]. It is predicted that “while nearly 70% of the digital universe will be created by individuals, organizations (businesses of all sizes, agencies, governments, associations, etc.) will be responsible for the security, privacy, reliability and compliance of at least 85% of that same digital universe” [1]. Growing even faster than the digital universe as a whole is the subset created and replicated by organizations. In www.intechopen.com
2006, about 25% of the bits in the digital universe were created or replicated in the workplace; by 2010 that proportion will rise closer to 30%. (The rest of the universe will be mostly music, videos, digital TV signals and pictures.) [1] This growth of information in organizations is caused by increased computerisation, regulation of archiving and privacy standards and an increase in industry applications, for example imaging and e‐commerce, sensor networks and customer support applications [1]. The implications for organizations of this growth in information include the need for more sophisticated techniques for information management to meet the increased demand for privacy, security and intellectual property protection. A comprehensive approach to managing information based on its value is one means to reducing the costs associated with the information explosion [1]. Information lifecycle management aims to find a cost‐effective strategy for maintaining information assets in terms of balancing the cost of maintaining information against its business value. “Valuing” information refers to determining which information is worth more than other information. This problem is difficult in practice. Many techniques have been used, including hardware and software tools and solutions such as content management, storage resource Sabah Al-Fedaghi: Information Management and5,Valuation Int. j. eng. bus. manag., 2013, Vol. 01:2013
1
2. Information lifecycle and research problems
2
Int. j. eng. bus. manag., 2013, Vol. 5, 01:2013
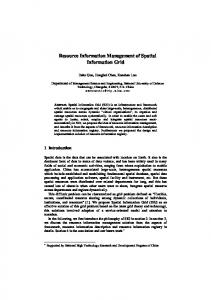
3. Information flow We are interested in states through which information passes in its lifecycle. These states will provide us with methods for evaluating information. The value comes from investment in nurturing information from a lower stage to a higher stage. Accordingly, a piece of information has five states: collected/received (CL), processed (PR), created (CR), released/disclosed (RE), and transferred (TR), shown in figure 1. RECEIVED
RELEASED
TRANSVERRED
Information lifecycle management is the process of deciding the value of information. Information management in this context is based on assigning a time‐ dependent value to information to facilitate storing the information according to its value, and deleting it at the appropriate time. Research in this area includes “policies, processes, practices, services and tools used to align the business value of information with the most appropriate and cost‐effective infrastructure from the time information is created through its final disposition” (SNIA association [4]). A typical approach in this area is to view the main problem as matching storage capacity with active or operational processing such as access times and frequency of access and policies such as retention rules and audit capability. The primary goal of this paper is to develop resource allocation criteria by assigning values to information. More highly valued information is more privileged when it is time either to preserve or to destroy it; thus, the fundamental problem in such an approach is how to assign values to different types of information. In order to solve such a problem, we need to classify information according to some set of criteria. To examine the information lifecycle, we envision it as the lifecycle of materials in a supply chain where raw materials, intermediate and finished products finished products are acquired, processed, stored, and exported, while flowing through transportation links connecting facilities. A holistic view such as this assigns value to products as they pass through the supply chain. Information can be classified according to its status in the supply chain. Thus, information lifecycle management involves the following tasks: 1. Identifying pieces of information (the items that flow in the supply chain). 2. Classifying information according to its status in the supply chain. 3. Assigning business value to information.
4. Determining a policy for information maintenance. We propose use of an information flow model (FM) with five stages of information flow: acquiring/receiving, processing, creating, releasing, and communicating/transferring information. Each of these stages may involve storage of information. Such a model has been applied in several areas, including communication and software requirements [5, 6, 7]. The fundamental difference between a traditional supply chain and our flow chain is the nature of materials involved in the flow. The flow in a traditional supply chain is a linear process in which materials arrive in the system, progress through different stages and then exit. Raw materials, intermediate products and finished products can be stored along this path from entrance to exit. Information, on the other hand, can appear and vanish at any point in the flow chain (deduced information), be multiplied, erased, etc. In FM, as in the supply‐chain method, the cost is sensitive to the stage of the chain. A finished product has more value than an intermediate product, which in turn has more value than the raw materials used in it. In this paper we apply the same evaluation scheme to information. Additional criteria are applied according to the organizational level, and the extent of the effects of information handing.
PROCESSED
management, backup and recovery, storage, archival policies and data warehousing [2, 3]. This paper develops a theoretical foundation for information lifecycle management. Information values are developed based on a classification scheme that does not consider operational factors (e.g., storage and access). An informational flow model provides the foundation for such categorisation in terms of collected/received, processed, created, released/disclosed and transferred/communicated information.
CREATED
Figure 1. Transition states of information.
The environment in which information exists is called its infosphere (e.g., computer, human mind, organization information system, department information system, www.intechopen.com
etc.). In each infosphere, information may go through five stages that correspond to different states of information: collection, processing, creation, release/disclosure, and transmission. The collection stage contains only the collected pieces of information; the processing stage contains the processed pieces of information etc. The states shown in figure 1 are exclusive in the sense that if information is in one state, then it is not in any of the other four states. Consider a piece of information, then is in one of the following states: 1. Has just been collected from some source (sent by an agency, from the Web, etc.), has just been stored and is waiting to be used. It is collected /received (CL) information that has not yet been processed in the infosphere. The infosphere refers to the environment of the information flow (e.g., organization, department, process etc.). 2. Has been processed in some way, converted to another form (e.g., digital), translated, compressed, revised etc. It can also be stored in the information system as processed data waiting for a use. 3. Has actually been created in the infosphere as the result of processing (e.g., in hospital, doctor’s diagnoses, lab tests, data mining etc.) Thus, is in the possession of the infosphere as created data to be used. We use the term create in this paper in the strict sense of generate. Thus, making a new file or document, copying files or documents and importing data are not creation of information. Creating information refers to “inventing” new facts. For example, after comparing data about Smith we reach the conclusion that Smith is a risk with respect to insurance. Smith is a risk is new information that never existed before the deduction that created it. 4. Is released from the infosphere. It is designated released information ready for transfer. In a factory environment, is analogous to materials designated ready to ship outside the factory. It can actually be stored for some period waiting to be transported; nevertheless, its designation “for export” keeps it in such a state. Released information may return to received, processed, or created states (bi‐directional arrows in figure 1) in case a channel is not operable. 5. Is in a transferred state, where it is being transferred between two infospheres. It has left the released state and will enter the collected/received state in a new infosphere. It is not possible for processed information to go directly to a state of collected/received in the same infosphere. Processed information can become collected information in another infosphere by first becoming disclosed information and then transferred information, in order to arrive in the other environment. The sequence of possible consecutive states is shown in figure 1. Released and transferred information is www.intechopen.com
usually not stored, because release and transfer indicate the transmission of information to outsiders. Storage in these two states is temporary, and occurs while the information is “travelling.” Consequently, we concentrate on the collection, processing and creation stages. We use FM to classify information into generic theoretical categories that can be applied in any infosphere. 4. Stages of FM “Handling information” involves following the information from its arrival at the infosphere, observing its progress through the various information stages (states) until it exits or disappears from the information circulation system. The flow model makes a piece of information visible as soon as it enters the circulation system of FM. In most cases, the piece of information then moves repeatedly between and among the stages of the model. Creation stage The creation stage has flow links (bi‐directional arrow) to the processing stage, where special types of processing generate new information (e.g., data mining). The creation stage is an internal source of information in the infosphere. The created information is used in some way (e.g., decision making), stored, or immediately moved to the processing or release stages. As an example, suppose that a physician reaches a new diagnosis of a disease (creates new information), such as John Smith has AIDS. Such new information may be generated by examining (mining) some data. John Smith has AIDS is then released to an expert, or processed further (cycling processing‐ creating‐processing) to verify the medical judgment. The information might be used outside the informational ontological world. For example, when an organization reaches the conclusion that Smith is a risk, actual steps are taken such as refusing his application. When a physician reaches the conclusion that John Smith has AIDS, he or she then uses this information to perform non‐informational acts such medical treatment. “Administering medical treatment” is a triggered action outside the information world. As we will see later, actions in the form of information are flowthings. Flowthings are things that are susceptible or capable of being received, processed, created, released and transferred according to FM state transformations. Collection/receiving stage The collecting/receiving stage is the information‐ acquisition stage; it accepts information from external suppliers and feeds it into the FM circulation system. This stage includes the possibility of using the arriving Sabah Al-Fedaghi: Information Management and Valuation
3
(unprocessed) information; hence, the collection stage has its own outside, a way for information to exit the system (e.g., arriving information generates the action of physical treatment, without further propagation in FM). It also includes the possibility of storing the collected/received information and destroying it.
Accordingly, Loshin [8] suggested that building a Business Process Model has some major benefits. These include understanding that an information flow provides logical documentation for the business process exposes potential for adding value, and in communicating user requirements to the implementation team. An information flow as part of a business development and operational road maps for tracking development against the original requirements and maps workflow and control back to information use [8]. Loshin [8] looked at a number of different kinds of processing paradigms including Transaction Processing, where an example is given of the use of an automated teller machine (ATM). The information flow “follows the thread of control as it passes through the individual interaction associated with each transaction” as shown in figure 2.
Processing stage The processing stage involves acting on information (e.g., anonymizing, data mining, summarizing, revising, etc.). The processing is performed on acquired information from the collection stage or the creation stage (bi‐ directional arrows in figure 1). Processing does not generate new information, but only changes the appearance of information, including comparing, compressing, translating and revising. Release and transfer stages
5. Money is disbursed
The release stage involves releasing information to outside the infosphere. It relies on the transfer stage to carry information from the current infosphere to the collection stage in another infosphere. When information is in the transfer state, it is flowing between two infospheres.
ATM
8. Receipt is printed 1. Does the 2. Yes account have sufficient funds for withdrawal?
5. Example
Transfer
2 Request from customer
Money
11
Receive
Process 3
Transfer
Transfer
Account information
Figure 2. A transaction‐based information flow (from [5])
Such a method of information flow specification gives us the opportunity to contrast it with its corresponding FM description that is shown in figure 3.
12
Release
17
Disbursement confirm Create
Release
Receive
Transfer
Transfer
Process OK?
9 4 from
Transfer
5 Receive
Process
Response
8 Create
Release
Account
Process 6
13
Release
16
Transfer
Receipt
Debit confirmation Process
Receive
Transfer
15
Debit
Transfer
confirmation
Transfer
5
INFORMATION SYSTEM
Create
10
Response
ATM
customer
7. Debit is confirmed
Customer
1
Request
6. Money is disbursed; confirm debit
4. Account is debited pending disbursement
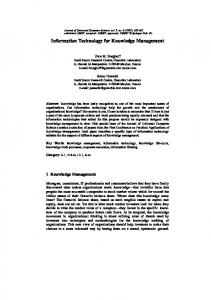
According to Loshin [8], business application has a distinct understanding of what business problem the application is meant to solve. Unfortunately in practice, as applications are modified, merged, and expanded, the high‐level understanding of the business problem gives way to dependence on implementation details and decisions that impose artificial constraints on the system. By virtue of the structured algorithm design…, we impose a control structure on the way that information flows through the processing. But this control structure does not always reflect the true dependencies inherent within the original application.
3. Debit the account
OK? Debit
7
Process
13
Receive
Transfer
Disbursement confirm
14
Release Create
Figure 3. FM description of the ATM transaction‐based information flow.
4
Int. j. eng. bus. manag., 2013, Vol. 5, 01:2013
www.intechopen.com
The process in figure 3 starts when the customer sends a request to withdraw money (circle 1 in the figure). Different methods can activate this request, however, the example does not include this portion of the transaction. The ATM includes several flowsystems including “request by the customer” (2). The request is received and processed (3) and flows to the bank’s operating system (4). In the request flowsystem of the information system sphere, it is processed (dashed arrow ‐ 5) to trigger processing the corresponding account for sufficient funds (6). If the account is OK (7), then this triggers the creation of a response (8) that flows (9) to the ATM, which in turn triggers releasing (10) money to the customer (11). Releasing money triggers (12) sending disbursement confirmation to the information system (13) that, in turn, triggers debiting the account (14). This triggers the creation of debit confirmation (14) that flows to the ATM (15) to create a receipt (16) that is transferred to the customer (17). Contrasting figure 2 with figure 3, the difference can be noticed in the continuity of events in the FM representation, while figure 3 depicts a discontinuous series of heterogeneous elements of processes, decisions, and questions. 6. Classification of information Classification of data is the first step in creating policies for information lifecycle management. Recent related work is creating the ʺsemantic Web,ʺ which would use automated tagging of data. Some systems semi‐automate the determination of business value. Consider the classification in ACE [9], which is achieved by mining the metadata attributes of the data and providing business value to the data based on policies. Prepackaged policies are constructed in consultation with experts. Policies consist of observable attributes of the data, the corresponding attribute values and a business value for the data that matches these attribute values. Some of the metadata attributes used for data classification in ACE include owner, access rights, application usage, file size, file type, last read time, last write time, create time, extension, access frequency, growth of file, and number of applications using a file. Each data/storage object is compared with all the policies to determine which one suits it best. Such a classification scheme is based on an active and operationally (e.g., access and retention rules) oriented method. Our approach complements such schemes with systematic valuation of information regardless of storage, activity and operational considerations. An important feature of the FM is that classification of information is performed by the system, not the creator or the author of information. Consider factors such as type www.intechopen.com
of information or content of files used in document content management systems. Such classifications as medical images, photographic images and surveillance images are determined by the content author, who may not be proficient in information management techniques. Conversely, our approach is to value information based on its status as CR, CL, or PR information; hence, information value is defined in informational aspects, not in terms of other factors such as application factors (e.g., medical information, financial information), temporal factors (e.g., time since creation, time since last used), etc. 7. Information value according to information flow In this section, we provide a series of propositions to be used in evaluating pieces of information. CL, PR and CR information are first valued relative to each other. Rules are then developed to give values to information within each stage. For simplicity, we use the names of the information states (CR, CL, and PR) to also denote the set of pieces of information in the corresponding stage. For a piece of information , let () denote its value.
Proposition 1: Suppose that 1, 2, and 3 are three pieces of information such that 1 CR, 2 PR, and 3 CL. Then (1) > (2) > (3). Discussion: The proposition states simply that the created information is more valuable than processed information, which in turn is more valuable than collected information, as shown in figure 4.
Created Information
Processed Information
Collected Information Figure 4. Value pyramid
In general, when deciding which information is to be destroyed, CR information or PR (processed) information used in deducing the CR information, the decision is in favour of the CR information. Such a decision attaches value to information in terms of effort invested in generating that information. For example, for the author of a research paper, the paper is more valuable than its references, because it embeds the effort of processing in addition to facts imported from references. Such an approach is based on a common belief in a data‐ Sabah Al-Fedaghi: Information Management and Valuation
5
information‐knowledge‐wisdom hierarchy, where knowledge is ranked higher than data and information. Consider the collected information in the form of a picture Z collected from the Web. Suppose that Z reaches the processing stage, where it is then processed using steganography to hide some information in the picture to produce picture Z. It is reasonable to suggest that the processed picture is more valuable than the downloaded picture. The steganographic effort has added more value to the picture. We assume here that the resultant picture is not faulty and that the processing achieves the objective of the processing agent; otherwise the result is destroyed immediately. For example, suppose that an automated translation program produces a faulty translation. There is no point in this case of keeping the result to the point of deciding either to scrap it or scrap the original information. It is reasonable to claim that created information is more valuable than processed information that generates it. The verdict that Smith has AIDS has more value than data about his disease symptoms. Cryptic military information is more valuable than its plain text because the cryptic information has involved processing of the original data. While proposition 1 seems generally compelling, other factors may affect the final judgment. If there is sufficient doubt about the statement that Smith has AIDS, then the data about his disease symptoms is more valuable. Other factors may supplement the FM‐based evaluation of information. Proposition 1 is built on neutralizing the effects of other considerations. Proposition 2: Let ├ denote the fact that is created (e.g., logically deduced) from . Suppose that 1, 2 CR and 3 PR such that, a) 1 is created from ├ 1 where represents an empty set of pieces of information. b) 3 is created from 2 ├ 1. Then (1) > (2). Discussion: Information created de novo (e.g., a writer writes an article, a manager evaluates his/her employees, a person writes his/her memoir) has more value than information derived from another type of information. This seems a common sense approach in which novelty is appreciated more than duplication or a modified product. For example, a picture (e.g., developed from scratch using some software) is more valuable than the same picture based on processing that modifies a Web image. Proposition 3: Suppose that 1 and 2 are two versions of the same piece of information. 6
Int. j. eng. bus. manag., 2013, Vol. 5, 01:2013
a) b) c)
If 1 is a more processed version of 2, then (1) > (2). If 1 is a more recently collected version of 2, then (1) > (2). If 1 is a more recently created version of 2, then (1) > (2).
Discussion: a) Such a proposition is based on the notion that processing efforts have value. A more refined (processed) version of a research paper has, in general, more value than older versions. In the processing stage, we can construct the chain of processing relationships for different versions of each processed document as shown in Fig. 5. 1
2
3
4 5
Figure 5. Chain of processing that produces different versions of the same information.
b)
c)
According to proposition 3(a), (4) > (3), (5) > (3), (3) > (2), and (2) > (1). 4 and 5 cannot be compared because neither is derived from the other. We can make a similar claim for collected information. Several criteria may be declared for such a decision. If 2 and 1 are the same information downloaded at different times, then the most recent version is more valuable. Similarly, if the same information is delivered from two different sources, then the version collected from the more reliable source has more value than the other version. It is more difficult to apply these same criteria in the creation stage. How can different levels of creation be measured? It is possible to develop a chain of relationships among versions of information as we did for processed documents. In figure 6, information 2 is sent back to the processing stage as 3, which is processed to create 4. For example, from medical information 1, it is concluded that 2: Smith has AIDS. This information is further processed as 3 to determine the reliability of such a conclusion, say by another consultant in the same organization. The processing of 3 generates 4. Proposition 3(c) declares that the value of 4 is greater than 2. This makes sense since, if we have to destroy either 2 or 4, we will ordinarily elect to save the more reliable information. www.intechopen.com
Processing
1
Creation 2
3
4
Figure 6. Created information that creates new information.
Proposition 4: Information that is used to collect, process, or create information has more value than the collected, processed, or created information, respectively. Discussion: Again, such a proposition is based on common sense. Preserving what led to information is more valuable than the resulting information, because it can be used repeatedly to obtain the same information. Proposition 5: Let SIZE represent the size of a certain type of information, then SIZE(CL) >> (SIZE(PR) + SIZE(CR)). Discussion: That is, the total size of collected information is far greater than the size of the combined processed and created information. Such a claim needs to be supported by empirical data. The proposition appears plausible, especially with regard to the type of information that accounts for most growth: film to digital image capture, analogue to digital voice and analogue to digital TV. According to a 2007 report [1], IDC estimates that of the 161 exabytes of information created [created here means collected in FM] or replicated in 2006, about 75% was created by consumers – taking pictures, talking on the phone, working at home computers, uploading songs and so on. So enterprises only have to worry about 25% of the digital universe, right? Not at all. Most user‐generated content will be touched by an organization along the way – on a network, in the data centre, at a hosting site, in a PBX, at an Internet switch, or a back‐up system. Consequently, we propose that most of the potential for reducing information is present in the collected information stage. Proposition 1 gives more value to created and processed information; thus collected information endorses targeting the lower part of figure 7, where information is abundant and less valuable. Each stage in the FM may gather its own metadata about its type of information. Such types of metadata complemented with the FM‐based evaluation rules can be used to develop a comprehensive information management. 8. Multi‐level information values The method used to evaluate pieces of information in the previous section involves assigning values according to the stages of information flow in a single infosphere. In www.intechopen.com
contrast, the multi‐level method assigns values in a multi‐ level organization of infospheres, as in the case of two‐ level organization of a company and its two departments, as illustrated in Figure 8. Value of information can be related to the level of its flow. In practice, higher organizational levels (e.g., executives) have more importance than lower subordinates. The flow of information through the vertical line of operating management is an important factor in valuing of information. Consider the conceptualization of information flow shown in figure 9 [10], that illustrates “how process information flows and is utilized.” In that figure, processes P1, P2, …, Pn are “local” processing of information, while warehouse, analysis, and reviewing are global processes.
Created Information Processed Information
Collected Information
Value
Size
Figure 7. Types of information in terms of value and size.
Company Level 1
Level 2
Departmen t B
Departme nt A
Figure 8. Two‐level organization of infospheres.
Previously, we assigned value to information according to its state (e.g., created information is more valuable than received information). Additionally, information is received, processed, created, released and transferred at the local and global levels; however, figure 9 mixes lower level processes (P1, P2, … Pn) with global processes such as warehouse, analysis and reviewing. Sabah Al-Fedaghi: Information Management and Valuation
7
P1
P1
Process
Pn
Outside Processing: Warehouse, Analysis
Data warehouse
Creation: Review, Conclusions
Release
Receiving
Transfer
A2
A3
R1
R2
R3
Analysis and report
Process
Review
Review and recommendations
Creation
Transfer
A1
Release
Transfer
Process 1
Receive
Creation
Process 2
Release
Process
Receive
Figure 9. Conceptualization of information flow in a conventional company (simplified from [10]).
Outside
This blurs the value differences among organizational levels. Such a conceptualization as the one in Figure 9 does not recognise the hierarchical differences that influence information valuing. FM distinguishes structurally between these levels. Figure 10 shows the FM conceptualization of the information flow in figure 9.
Figure 10. Two‐level information flow.
The upper area in the figure represents the global level of the organization. We assume two processes that receive, process, create, release and transfer information. We have also added the possibility of flow of information to and from outside the organization.
Outside Processing: Review Creation: Conclusions
Release
Receiving
Review
Transfer Processing: Analysis
Release
Receiving
Processing: Warehouse
Analysis
Transfer Release
Receiving
Warehouse Transfer
Process 1
Process 2
Figure 11. Information flow, assuming the sequence: warehouse, analysis, and review.
The global processes of warehouse, analysis and reviewing may also be conceptualized according to their interdependence. Figure 11 shows the FM‐based conceptualization of information flow assuming the sequence (1) warehouse, (2) analysis and (3) reviewing, 8
Int. j. eng. bus. manag., 2013, Vol. 5, 01:2013
with the interiors of the lower level processes not shown. We also assume that warehouse (e.g., conversion to standard units) and analysis (e.g., categorization) do not create new information. www.intechopen.com
Accordingly, we can apply our methodology of categorisation of values while taking into consideration the organizational levels shown in figure 12. In general, collected information at level i (e.g., executive level) is more valuable than created information at level i‐1. Let L represent the infosphere level, H a ranking of states (created, processed, received) and C and Di, constants. The index in Di can be used to attribute different important factors of processes at the same level (e.g., information from P1 is more valuable than information from P2). The value of a piece of information, V, can be calculated as Equation I:V = C * L + Di * H
Created Processed Information
Level 1 Value
Collected
Information
Created
Processed Information
Level 2
Collected Information
Size
Figure 12. Types of information in terms of value and size at two level infospheres.
The method used to evaluate pieces of information in the previous sections involves assigning values according to the stages of information flow in single and multi‐level infospheres; however, a third dimension of information valuing exists, related to the extent of the effect of information handling. This dimension will be illustrated by applying it to the known PDCA (plan‐do‐check‐act) cycle. The PDCA cycle is an iterative four‐step problem‐ solving process that includes the four stages plan‐do‐ check‐act, as shown in figure 13.
ACT
PLAN CHECK
DO
Figure 13. PDCA cycle
According to HCi (2009), these stages are described as follows: www.intechopen.com
1. 2.
3.
4.
Plan: identifying and developing plans to solve problems. Do: first solving the problem on a small or experimental scale to test whether the changes will work. Check: assessing whether experimental changes are achieving the desired result. Also checking key activities (regardless of any experimentation occurring) to identify any new problems caused by changes. Act: implementing changes on a larger scale if the experiment is successful.
From the FM point of view, Plan and Check are infospheres, while Do and Act are action spheres. Actions in action spheres are flowthings that can be received, processed, created, released, and transferred. Figure 14 is the FM representation of the PDCA cycle. In the plan stage, plans, a type of information, are created and processed. Processed in this context means discussed, analysed, scrutinized, and revised; hence it may involve iterations if creation and processing are required (two dark‐edged boxes in PLAN in figure 14). The finished plan then triggers (dotted arrow from PLAN to DO) the creation and processing of experimental actions. Processing here means execution of the plan. Execution of the plan triggers the creation of (data) information in CHECK. This information is processed and, in turn, triggers (dotted arrow from CHECK to ACT) the creation of actions in DO. The actions in DO trigger the creation of new plans in PLAN (dotted arrow from ACT to PLAN). Note that we use open‐headed arrows to represent flows of actions and solid‐headed arrows to represent flow of information. The FM representation of the PDCA cycle (figure 14) uncovers flow of information from PLAN to CHECK represented as an arrow from Transfer in PLAN to Transfer in CHECK. The original plan developed in PLAN is used in CHECK to evaluate that experimental test of the changes. Furthermore, the FM representation raises several issues regarding the interior of each PDCA cycle. For example, to whom the plan is released in PLAN, the possibility of receiving (importing) the initial version of the plan, the possibility of exchanging information and actions with the outside etc. As an illustration, figure 15 shows the propagation of plans from the top organizational level (level 1) to lower levels. Such a map of flow can be used as an extension of the PDCA cycle for such purposes as monitoring and auditing (leakage investigation) of the subunits that participate in implementing the plans. Note that all arrows in figure 15 are of the same type since the flowthing is the same in all infospheres involved. Sabah Al-Fedaghi: Information Management and Valuation
9
PLAN: Information sphere Process
Receive
Transfer
Creation
Release
Creation
Transfer
Release
Process
Created Information
Receiving
Transfer
Release
Receive
Release
Create
CHECK: Information sphere
CHECK
Created Information
Process
Processed Information
Figure 14. FM representation of the PDCA cycle.
Process Creation
Release
Collected Information
PLAN: information sphere
Level 2 Created Information
Receiving
Transfer
Transfer
Collected Information
Transfer Receive
Receive
PLAN: Information sphere
PLAN
Processed Information
Level 1 Level 2
Release
Level 1
Collected Information
Creation
ACT: Action sphere
PLAN
Processed Information
Transfer
Receiving
Process
Value
DO: Action sphere
Created Information
Release
CHECK
Processed Information
PLAN: Information sphere
Collected Information Subordinate processes
Level 3
Subordinate processes
Figure 15. FM representation of the PDCA cycle can be extended to map the communication of plans to subordinate processes or departments.
Returning to the issue of valuing information, we propose ranking the value of information according to the width of its effect on the organization. In general, information in CHECK has more value than information in PLAN because it affects the entire organization, while information in PLAN has limited effect because it is applied at an experimental scale. This general view is shown in figure 16. Consequently, equation I can be rewritten as V = C*L + Di* H + E*S, where S is a scale factor of the extent of effect (e.g., number of affected departments) assigned to information in PLAN and CHECK, and E is a constant. We notice that actions (in DO and ACT) are flowthings; hence, most of our analysis can be applied to actions in addition to information.
10 Int. j. eng. bus. manag., 2013, Vol. 5, 01:2013
Size
Figure 16. PLAN and CHECK in terms of information value in two‐level infospheres.
9. Conclusion We have shown that it is possible to develop a theory for information lifecycle management independent of operational considerations such as storage and access information. A flow model is applied for representing different conceptualization of processes related to valuing information. First, information value is related to the type of information: received, processed and created information. The value of information is also tied to organizational level. A framework for valuing information according to its extent of effect is then introduced. These concepts are developed systematically in the context of flow model.
www.intechopen.com
The contribution in this paper points to a promising research field in information lifecycle management with a focus and practical benefits. This area has recently received a great deal of attention; however, the “relative lack of research studies on [information lifecycle management] … suggests the need for an exploratory focus” [12]. According to a 2005 Sun white paper, “Information lifecycle management’s stated value is compelling, but clear steps toward implementation are required” [13]. 10. References [1] Reinsel, D., Chute, C., Schlichting, W., McArthur, J., Xheneti, I., Toncheva, A., & Manfrediz, A. (2007). A forecast of worldwide information growth through 2010: an IDC White Paper. http://www.emc.com/about/destination/digital_univ erse/pdf/Expanding_Digital_Universe_IDC_WhitePa per_022507.pdf [2] IBM (2008 – access date). Tivoli Storage Manager. http://www.ibm.com/software/tivoli/products/storag e‐mgr/. [3] Shepard, L. (2004). SGI Infinite Storage Data Migration Facility (DMF). A White Paper. http://www.sgi.com/pdfs/3631.pdf [4] Peterson, M., St. Pierre, E. Snias vision for ILM, In: Computerworld: Storage Network World, 2004. [5] Al‐Fedaghi, S. (2008a). Modeling communication: one more piece falling into place. The 26th ACM International Conference on Design of Communication , Lisboa, Portugal, Sept. 22‐24.
[6] Al‐Fedaghi, S. (2008b). Software engineering interpretation of information processing regulations. IEEE 32nd Annual International Computer Software and Applications Conference (IEEE COMPSAC 2008), Turku, Finland, July 28‐August 1. [7] Sabah Al‐Fedaghi, “Awareness Of Context and Privacy”, The American Society for Information Science & Technology (ASIS&T) Bulletin, Vol. 38, No. 2, 2011. [8] David Loshin, Business Intelligence: The Savvy Managerʹs Guide, Morgan Kaufmann, 1st edition 2003, 2nd Edition 2012. [9] Shah, G., Voruganti, K., Shivam, P., & Rohena, M. (2008). ACE: classification for information lifecycle management. IBM Almaden Research Center. http://www.cs.duke.edu/~shivam/msst_06.pdf [10] Dymond and Associates. (2005). Real time enterprise. White paper. http://www.dymondassoc.com/rte.htm [11] HCi. (2009 – access date). From problem‐faced to problem‐solved. http://www.hci.com.au/hcisite2/toolkit/pdcacycl.htm [12] Short, J. E. (2006). Information lifecycle management: an analysis of end user perspectives. Working Paper 06‐01. The Information Storage Industry Center, University of California. http://isic.ucsd.edu/pdf/ISIC_ILM_WP_06‐01.pdf [13] Sun Microsystems. (2005). Information lifecycle management maturity model. White paper, April 2005. http://www.sun.com/storagetek/white‐ papers/ILM_Maturity_Model.pdf
www.intechopen.com
Sabah Al-Fedaghi: Information Management and Valuation
11