strong constraints actually operate on the possible universe of complex networks. The ... R.V. Solé and S. Valverde, Information Theory of Complex Networks: On ...
Information Theory of Complex Networks: On Evolution and Architectural Constraints Ricard V. Sol´e and Sergi Valverde 1
2
Complex Systems Lab-ICREA, Universitat Pompeu Fabra (GRIB), Dr Aiguader 80, 08003 Barcelona, Spain Santa Fe Institute, 1399 Hyde Park Road, Santa Fe NM 87501, USA
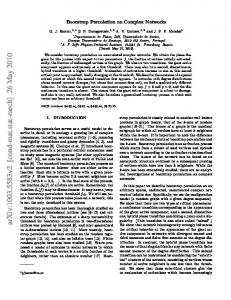
Abstract. Complex networks are characterized by highly heterogeneous distributions of links, often pervading the presence of key properties such as robustness under node removal. Several correlation measures have been defined in order to characterize the structure of these nets. Here we show that mutual information, noise and joint entropies can be properly defined on a static graph. These measures are computed for a number of real networks and analytically estimated for some simple standard models. It is shown that real networks are clustered in a well-defined domain of the entropynoise space. By using simulated annealing optimization, it is shown that optimally heterogeneous nets actually cluster around the same narrow domain, suggesting that strong constraints actually operate on the possible universe of complex networks. The evolutionary implications are discussed.
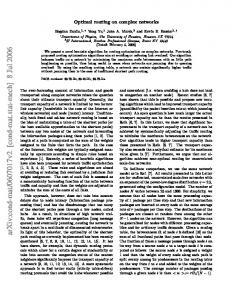
1 Introduction Many complex systems are to some extent describable by the network of interactions among its components. Beyond the specific features displayed by each net, it has been shown that a number of widespread properties are common to most of them. One is the presence of the small-world phenomenon and the second the observation that in many cases they are highly heterogeneous in their connectivity patterns [1-4]. Heterogeneity can be easily identified by looking at the so called degree distribution Pk , which gives the probability of having a node with k links. Most complex networks (both natural and artificial) can be described by a degree distribution Pk ∼ k −γ φ(k/ξ) where φ(k/ξ) introduces a cut-off at some characteristic scale ξ [5]. An example of such scale-free networks is provided by the architecture of digital electronic circuits (Fig. 1). It has been shown [6] that these systems exhibit long tail distributions of links, where the nodes are electronic components and the links are physical wires between units. Most elements are connected to a few others (for circuits this usually means nearest neighbors) but some are connected to many others. In Fig. 2 several examples of the observed distributions for both analog (a-b) and digital (c-d) systems are shown. Although analog systems are closer to an exponential distribution (i. e. ξ small) digital, large-scale systems3 exhibit scaling behavior, with γ ∼ 3. 3
Similar results have been obtained by looking at large-scale systems, such as VLSI networks. See for example: http://citeseer.nj.nec.com/450707.html
R.V. Sol´ e and S. Valverde, Information Theory of Complex Networks: On Evolution and Architectural Constraints, Lect. Notes Phys. 650, 189–207 (2004) c Springer-Verlag Berlin Heidelberg 2004 http://www.springerlink.com/ �
190
R.V. Sol´e and S. Valverde
Fig. 1. Heterogeneity is a widespread feature of most (but not all) complex networks. An example from technology graphs are electronic circuits (upper plot) which have been shown to display scale-free distributions of links.
0
0
Cumulative distribution
10
10
-1 -1
10 10
-2
-2
10
10
10
-3
-4
-3
0
5
10
15
20
25
30
-2.05
0
10
Cumulative distribution
B
A 10
10
10
0
10
1
2
10
0
10
D
C 10
10
-1
10
-2
10
10
-1
-2.1
-2
10
-3
-3
10
-4
-4
0
10
20
30
k
40
50
10
10
0
10
1
2
10
k
Fig. 2. Cumulative degree distributions for several examples of analogic (a-b) and digital (c-d). Although the analogic systems are less heterogeneous, analogic circuits (particularly large systems) display scaling in their degree distributions (Left plots are linear-log and right plots are in log-log scale).
Information Theory of Complex Networks
191
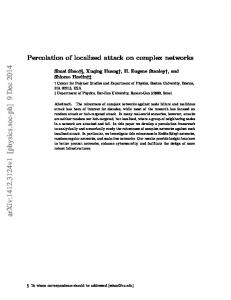
Scale-free nets have been shown to be obtainable through a number of mechanisms, including preferential attachment [2,3,7,8], optimization [9,10], duplication and divergence [11,12] or fitness-dependent, rich-gets-richer mechanisms [13] or the “copying” model [14]. Beyond the common qualitative architecture shared by these systems, the dynamical patterns and their time scales that take place on top of these webs differs from system to system, although in a way or another deals with information propagation and/or processing. Moreover, the response to node removal differs from system to system. Although genetic and metabolic networks seem to be fairly robust against perturbations of different types, a totally different situation arises in electronic circuits. In biological nets failure of highly connected components will typically end in system’s failure (for example, at the cellular level). But failure (by mutation or transient change) of a gene is often buffered by the rest of the system. This is not the case for electronic circuits and, to a similar extent, by software networks. Failure of any component typically leads to system’s failure, no matter how much linked is the given unit. Several quantitative measures can be used in order to characterize a given network. The first step is to define an appropriate representation in terms of a graph Ω, defined by a pair Ω = (W, E), where W = {si }, (i = 1, ..., N ) is the set of N nodes (species, proteins, neurons, etc) and E = {{si , sj }} is the set of edges/connections between nodes. The adjacency matrix ξij indicates that an interaction exists between two nodes si , sj ∈ Ωp (ξij = 1) or that the interaction is absent (ξij = 0). Several statistical properties, such as average degree, clustering or diameter can be defined from the adjacency matrix. But the universe of possible networks (Fig. 3), although not arbitrarily diverse, displays a number of structural variations that cannot be compressed by the previous average quantities. Real networks are not only typically heterogeneous, but they also involve other types of features, such as hierarchical organization [15]. In Fig. 3 we qualitatively summarize the basic types of network organization by using a generic, qualitative parameter space. Here heterogeneity, modularity and randomness define three axes. Assuming that such three parameters can be properly defined, different real and model graphs can be located at different locations. The current knowledge of network architecture in many different systems strongly indicates that the domain of random networks with long tailed degree distributions and some amount of modular structure are rather densely occupied. In spite that the evolutionary process leading to these different systems are rather diverse, it is interesting to see that there is a strong convergence towards this type of architectures. Here we will explore this problem by using information-based statistical measures.
2 Measuring Correlations Beyond the degree distribution and average statistical measures, correlation measures offer considerable insight into the structural properties displayed by com-
192
R.V. Sol´e and S. Valverde
Semantic nets
Heterogeneity
SF−like networks
Internet metabolic maps
food webs
ndo
b
mesh
hierarchical modular Mutualistic webs
Ra
a
Electronic circuits
software graphs proteome
regular trees
mn
ess
cortical maps
y
arit
dul
Mo
c
modular ER graph
ER graph
Fig. 3. A zoo of complex networks. In this qualitative space, three relevant characteristics are included: randomness, heterogeneity and modularity. The first introduces the amount of randomness involved in the process of network’s building. The second measures how diverse is the link distribution and the third would measure how modular is the architecture. The position of different examples are only a visual guide. The domain of highly heterogeneous, random hierarchical networks appears much more occupied than others. Scale-free like networks belong to this domain.
plex networks. One particularly interesting is network asortativeness [16]. Some networks show assortative mixing (AM): high degree vertices tend to attach to other high-degree vertices. At the other extreme there are graphs displaying dissortative mixing (DM), thus involving anticorrelation. The later are common in most biological nets, whereas the former are common in social and collaboration networks. It has been suggested that the presence and sign of assortativeness in this nets can have deep implications to their resilience under node removal or disease propagation. Following a previous analysis [16] we will be interested here not in the degree distribution Pk but instead in the remaining degree: the number of edges leaving the vertex other than the one we arrived along (Fig. 4). This new distribution q(k) is obtained from: q(k) =
(k + 1)Pk+1 �k�
(1)
� where �k� = k kPk . In a network with no assortative (or disassortative) mixing qc (j, k) takes the value q(j)q(k). If there is assortative mixing, qc (j, k) will differ from this value and the amount of assortative mixing can be quantified by the
Information Theory of Complex Networks
Si
Sj
k i =4
k j =3 q j =2
q i =3
193
Fig. 4. Computing correlations in a network. Here two given, connected nodes si , sj are shown, displaying different degrees ki , kj . Since we are interested in the remaining degrees, a different value needs to be considered (here indicated as qi , qj ).
connected degree-degree correlation function �jk� − �j� �k� =
� jk
jkqc (j, k) −
�
2 jq(j)
(2)
j
where �. . . � indicates an average over edges. The correlation function is zero for no assortative mixing and positive or negative for assortative or disassortative mixing respectively. In order to compare different networks, normalization is obtained by dividing it with by its maximal value, which it achieves on a perfectly assortative network, � i.e., one with qc (j, k) = q(k)δjk . This value is equal to the variance σq2 = k k 2 q(k) − �� 2 of the distribution q(k), and hence the normalized correlation funck kq(k) tion is 2 � � 1 (3) r= 2 jkqc (j, k) − jq(j) σq j jk
As defined from the previous equation, we have −1 < r < 0 for DM and 0 < r < 1 for AM. Both biological ad technological nets tend to display DM, whereas social webs are clearly assortative. Correlation functions have been widely used both in statistical physics [17] and nonlinear dynamics [18]. A closely related, and more general approach involves the use of information-based measures [19-21]. One specially important quantity is the so called mutual information, which is a general measure of dependence between two variables [19,22]. Correlation functions measure linear relations, whereas mutual information measures the general dependence and is thus a less biased statistic. The relevance of this difference is illustrated by the analysis of chaotic dynamical systems: the second allows to determine the independent variables for (re-) constructing phase trajectories [23]. This cannot be done from linear correlation functions. Additionally, the definition of mutual information within the context of communication channels implies additional statistical quantities (such as channel entropy and noise) that provide a detailed characterization of system’s complexity. Here we show how these quantities can be properly defined for complex networks, how they correlate with other statistical measures and what is their meaning and implications.
194
R.V. Sol´e and S. Valverde
3 Entropy and Information By using the previous distribution q = (q(1), ..., q(i), ..., q(N )), an entropy measure H(q) can be defined: H(q) = −
N �
q(k) log(q(k))
(4)
k=1
The entropy of a network will be a measure of uncertainty [19]. Within the context of complex nets, it provides an average measure of network’s heterogeneity, since it measures the diversity of the link distribution. The maximum is Hmax (q) = log N is obtained for q(i) = 1/N (∀i = 1, ..., N ) and Hmin (q) = 0 which occurs when q = (1, 0., , , 0). In an information channel, there is a distinction between source and destination. Given the symmetric character of our system, no such distinction is made here. In Fig. 5 we can see the impact of heterogeneity on entropy. Specifically, we computed the entropy H(q; γ, ξ) for γ ∈ (2, 3) and ξ ∈ (0, 50) for a distribution Pk ∼ k −γ φ(k/ξ) using different scaling exponents γ and cut-offs ξ. The impact of diversity (long tails) is obvious, increasing the uncertainty. As the scaling exponent increases or the cut-off decreases, the network becomes less heterogeneous and as a result a lower entropy is observed. Similarly, the joint entropy can be computed by using the previous joint probabilities: H(q, q� ) = −
N � N �
qc (k, k � ) log qc (k, k � )
(5)
k=1 k� =1
1 0.9
Entropy H(q)
0.8 0.7 0.6 0.5 0.4 0.3 2 0.2 0
2.5 10
20
ξ
30
40
50
3
γ
Fig. 5. Entropy of the remaining degree distribution obtained from a network with degree distribution Pk ∼ k−γ φ(k/ξ). Here H(q) = − Pk log Pk dk is shown against the scaling exponent γ and the cut off ξ. Here we have used an exponential cut-off, i. e. φ(k/ξ) = exp(−k/ξ) As expected, the entropy becomes larger for smaller γ and decreases as ξ is reduced.
Information Theory of Complex Networks
195
Here qc (k, k � ) is the joint probability, and it is normalized, i. e.: N � N �
qc (k, k � ) = 1
(6)
k=1 k� =1
Since it considers all possible pairs of edges, this entropy provides a measure of the average uncertainty of the network. As before, it can be understood in terms of a measure of the diversity of linked pairs with given remaining degrees. The mutual information I({qk }) of a given system is defined by means of the difference: I(q) = H(q) − Hc (q|q� )
(7)
where the last term Hc (q|q� ) is the conditional entropy that involves a different set of conditional probabilities π(k|k � ) [19]. They give the probability of observing a vertex with k edges leaving it provided that the vertex at the other end of the chosen edge has k � leaving edges. This entropy (the “noise” in our graph) is defined as: Hc (q|q� ) = −
N � N � k=1
q(k)π(k|k � ) log π(k|k � )
(8)
k� =1
Since the conditional and joint probabilities are related through: π(k|k � ) =
qc (k, k � ) q(k � )
(9)
the conditional entropy can actually be computed in terms of the two previous distributions: Hc (q|q� ) = −
N � N �
qc (k, k � ) log
k=1 k� =1
qc (k, k � ) q(k � )
(10)
we thus have, from the previous expressions, I(q) = H(q) − Hc (q|q� ) =−
N � N � k=1
=−
qc (k, k � ) log q(k) +
k� =1
N � N � k=1 k� =1
(11) N � N � k=1
qc (k, k � ) log
qc (k, k � ) log π(k|k � )
k� =1
q(k) π(k|k � )
which gives a final form for the information transfer function4 : 4
The previous measures can be extended (with some care) into continuous distributions. In this case, we must assume that the continuous counterparts of the pre-
196
R.V. Sol´e and S. Valverde
I(q) =
N � N � k=1 k� =1
qc (k, k � ) log
qc (k, k � ) q(k)q(k � )
(12)
Some limit cases are of interest here. The first corresponds to the maximum information transfer, which is obtained, for a given {qk }, when Hc (q|q� ) = 0, i. e. when the conditional probabilities are such that π(k|k � ) = 1 or 0 for all k, k � = 1, ..., N . Another is given by π(k|k � ) = δk,k� . This case corresponds to a deterministic channel in standard information theory [19]. This implies that qc (k, k � ) = q(k � )δk,k� which is precisely the case of perfectly assortative network [16]. In analogy with information channels, we can find a maximum value of the information, which we call the network’s capacity C = max{qk } I(q). There is no general method to compute C for an arbitrary channel. It can only be computed in some specific cases. By using the previous functions, we will measure three key quantities: (a) the amount of correlation between nodes in the graph, as measured by the information; (b) the noise level, as defined by the conditional entropy, which will provide a measure of assortativeness and (c) the entropy of the q(k) distribution. Since the total information involves the two last terms in a linear fashion, a noise-entropy space will be constructed and the distribution of real nets on this space will be analysed.
4 Model Networks In the following sub-sections some simple, limit cases will be considered. Different types of architectures are represented by some standard networks exhibiting different degrees of heterogeneity and randomness. The list is far from exhaustive but provides an idea of what are the effects of each ingredient on information transfer and entropies. 4.1 Lattices and Trees Lattice-like networks are common in some man-made architectures, particularly parallel computers [24-26]. These nets represent the highest degree of homogeneity and have no randomness. For a lattice, we have Pk = δk,z , where z is a fixed number of links per node and δij the Kronecker’s delta function. For this ordered graph ΩL , we have vious degree distributions can be defined. The new are such that distributions the normalization conditions: q(k)dk = 1 and qc (k, k� )dkdk� = 1 are at work. Provided that the distributions are well behaved, the information trans� qc (k,k� ) � . Accordingly, entropy dkdk fer is now given by I(q) = qc (k, k� ) log q(k)q(k � ) and be obtained from: H(q) = − q(k) log(q(k))dk and Hc (q|q� ) = noise would � − qc (k, k ) log π(k|k� )dkdk�
Information Theory of Complex Networks a
b
197
c
Fig. 6. Homogeneous networks: here two examples of a lattice (a) and a regular tree (b) are shown as examples of deterministic nets. In both cases each node has the same degree and thus both the entropy and the noise are zero. In (c) a random, Erd¨ osRenyi graph is shown. Here some amount of heterogeneity is at work, but the variance equals the mean and both noise and entropy are very close, giving as a result a small information i. e. no correlations (in the N → ∞ limit).
q(k) = δk,z−1
(13)
qc (k, k � ) = δk,z−1 δk� ,z−1
(14)
I(q) = H(q) = Hc (q|q� ) = 0
(15)
and thus
This is a trivial case, since the homogeneous character of the degree distribution implies zero uncertainty. The same situation arises for a Cayley tree (Bethe lattice), where each node has exactly the same degree. Tree-like architectures are also common in designed systems, such as small-sized software graphs [27] and communication networks. 4.2 Erd¨ os-Renyi Graphs Erd¨ os-Renyi graphs ΩN,p are random graphs such that two nodes are joined with some probability p. These types of graphs have been widely used as the backbone of null models of genetic [28] ecological [29] and neural [30] networks. It seems also appropriate in describing the topology of species-poor ecosystems [31]. The distributions are single-scaled and thus low uncertainty and high randomness are at work. The average degree will be �k� ≈ pN , and it can be easily shown that the probability Pk that a vertex has a degree k follows a Poisson distribution Pk = e�k� �k�−k /k!, and thus q(k) =
(k + 1)e�k� �k�(k+1) = Pk �k�(k + 1)!
(16)
For this random graph, the independence associated to the link assignment implies (for N large) qc (k, k � ) = q(k)q(k � ) and thus information transfer is zero. An interesting extension of the standard ER graph allows to introduce modularity into the graph structure [15]. In general, the graph Ω is partitioned into m subgraphs {Ωi }, (i = 1, ..., m) of relative size ηi = |Ωi | such that
198
R.V. Sol´e and S. Valverde
W =
m 2
(Wj ∩ Wk = ∅)
Wi
(17)
i=1
and such that
�
ηi = 1
(18)
i
All nodes sj ∈ Ωi are connected with probability q and additionally we have a probability p of connecting two nodes belonging to different modules. The average degree of this system is < k >= pN/m + (m − 1)N q/m. Given the random wiring, it is not difficult to show that for large N information will be typically very small. 4.3 Star Graph Star graphs define another extreme within the universe of complex nets. Although no real network is likely to be described in terms of a pure star graph, it is certainly a common motif in many graphs. They are largely responsible for the short distances achieved in SF networks. Besides, a star graph can be shown to be optimal for low-cost communication [32]. This graph Ω∗ is characterized by a degree distribution: p(k) =
n−1 1 δk,1 + δk,n−1 n n
(19)
The corresponding distribution q(k) is: q(k) =
1 [δk,0 + δk,N −1 ] 2
(20)
and the joint probabilities are reduced to: qc (k, k � ) = δk,N −2 δk� ,0
(21)
The entropy is maximal, given by: H(q) = −q(0) log q(0) − q(N − 1) log q(N − 1)
(22)
which gives H(q) = log 2. The noise term is Hc (q|q� ) = 0, since π(k|k � ) = δkk� . The information is thus maximal, with I(q) = H(q) = log 2. The star graph displays maximum information, as expected given the deterministic character of the conditional probabilities.
5 Real Networks In this section we present some analysis of the information measures as applied to real networks. A large set of both technological and biological graphs has been studied. Specifically, three groups of data sets were used in our analysis, all of them known to be highly heterogeneous displaying scale-free architecture:
Information Theory of Complex Networks
199
Assortativeness r
0.2
0
-0.2
-0.4
0
0.2
0.4
0.6
0.8
1
1.2
Information I(q) Fig. 7. Information transfer and assortativeness appear to be roughly correlated in a negative way. Here several systems have been used (all those analysed in this paper) and a linear interpolation has been displayed. Although the trend is clear, considerable variance can be appreciated, probably due to the underlying nonlinear mapping between both measures.
1. Metabolic networks: a graph theoretic representation of the biochemical reactions taking place in a given metabolic network can be easily constructed. In this representation, a metabolic network is built up of nodes, the substrates, that are connected to one another through links, which are the actual metabolic reactions [33]. 2. Software class diagrams: Nodes are software components and links are relationships between software components. Class diagrams constitute a wellknown example of such graphs [34,35]. 3. Electronic circuits: they can be viewed as networks in which vertices (or nodes) are electronic components (e.g. logic gates in digital circuits and resistors, capacitors, diodes and so on in analogic circuits) and connections (or edges) are wires in a broad sense [6]. In Table 1 we also show a list of selected networks obtained from very different systems and ordered from the higher to the lower information. The system’s size N , average connectivity < k >, information measures and the assortative mixing coefficient r are provided. We can see that most nets are disassortative, as predicted in [16]. Actually, information and r appear to be negatively correlated. This is shown in Fig. 7, where r is shown against I(q) for different systems. It is important to see that, in spite of the roughly negative correlation (a linear interpolation has been used) a large variance is observable, and a range of r values is associated to each information transfer. Such a variable plot is likely
200
R.V. Sol´e and S. Valverde 5.0
a
Software
4.0
H(q|q’)
Metabolism
3.0
2.0
b
Electronic circuits
1.0 Homogeneous graphs
0.0 0.0
1.0
Star graph
2.0
3.0
4.0
5.0
6.0
H(q) Fig. 8. Noise-entropy plot for different real networks, both natural and artificial. Here electronic circuits (open circles), metabolic (triangles) and software maps (squares) are shown to be close to the zero-information line, i. e. when entropy equals to noise. An example of a software graph that significantly deviates from the H = Hc . The network is small and has a rather particular shape, involving a large hub plus another cluster of connected classes.
to be the result of the nonlinear character of the information transfer, not shared by the (linear) correlation defined by assortative mixing measures. By displaying noise against entropy, the general picture that emerges is that the set of complex networks analysed here displays typically uncorrelated structure. This is clear from the strongly linear dependence shown between noise and entropy (Fig. 8). If two given, randomly chosen nodes with remaining degrees k, k � are typically connected with some probability, roughly irrespective of their mutual degree (i. e. low assortativeness is present) we should expect: qc (k, k � ) ≈ q(k)q(k � )
(23)
π(k|k � ) ≈ q(k)
(24)
and thus we would have
in this case, the noise will be given by: Hc (q|q� ) = −
N � N �
q(k, k � ) log π(k|k � )
(25)
q(k, k � ) log q(k) = H(q)
(26)
k=1 k� =1
=−
N � N � k=1
k� =1
Statistical independence among node degree thus gives a predicted straight line Hc (q|q� ) = H(q) which seems to be suggested by our data. One first conclu-
Information Theory of Complex Networks
201
Table 1. Information-based measures computed for different real and theoretical systems. For each subset the list is ordered from higher to lower information transfer. Network type
N
< k > I(q) H(q) Hc (q|q� ) r
168 159 3200 1993 320 899 5285 4941
2.81 4.19 3.56 5.00 3.17 4.14 4.29 2.67
1.19 1.03 0.50 0.30 0.23 0.15 0.12 0.06
3.04 3.99 4.77 4.82 1.37 2.98 4.47 3.01
1.85 2.97 4.27 4.51 1.14 2.82 4.35 2.95
-0.39 -0.41 -0.22 -0.08 0.010 -0.15 -0.06 0.003
154 134 139 1173 297 821 5916 1458
4.75 8.67 5.09 4.84 14.5 4.76 5.65 2.67
0.94 0.53 0.46 0.39 0.37 0.37 0.31 0.24
4.09 4.74 4.00 3.58 5.12 3.46 5.45 3.85
3.14 4.21 3.54 3.19 4.74 3.09 5.14 3.61
-0.31 -0.24 -0.24 -0.17 -0.16 -0.18 -0.18 -0.21
17 3000 300 500
1.88 3.98 6.82 10.3
1.00 0.25 0.06 0.04
1.00 4.12 3.31 3.67
0.00 3.85 3.25 3.62
-1.00 -0.078 -0.005 -0.001
Technological networks Software 1 Software 2 Internet AS Software 3 Circuit TV Circuit EC05 Software linux Powergrid Biological networks Silwood park Ythan estuary p53 subnetwork Metabolic map Neural net (C.elegans) Metabolic map Romanian syntax Proteome map Theoretical systems Star graph Barab´ asi-Albert Erd¨ os-Renyi Modular E-R
sion from this analysis is that network correlations in real graphs are small, being the diversity of pairs of linked nodes a direct consequence of the heterogeneous character of the degree distribution and nothing else. In spite that the cloud of points deviates from the straight line, these deviations might result from finitesize effects. Actually, if we plot information measures I(q; N ) against system’s size N , it can be shown that they follow a scaling I(q; N ) ∼ N −1 . Two points clearly deviate from the general pattern displayed by the majority of networks analysed here. Both are small systems and correspond to software graphs, and one of them is shown in Fig. 8b. As we can see this is a rather peculiar system, involving a large hub connected to a small module. It is thus a small structure dominated by the star graph component together with a homogeneous component. Such a nonuniform structure is likely to result from an process dealing with engineered, small-sized systems but unlikely to result from
202
R.V. Sol´e and S. Valverde
a natural process or from artificial evolution when some complexity thresholds are reached. One possible explanation for the previous result is that correlations simply do not play any particular role in shaping network architecture5 . However, it could be also argued that such a lack of correlation has been either chosen or selected for some underlying reason. But there’s also another (more likely) scenario: that the observed structures are actually the only possible choices, at least when some complexity threshold is reached.
6 Simulated Annealing Search The spread of real networks close to the zero-information boundary suggests that the possible structures allowed to occur (with a given heterogeneity and a given correlation) is rather constrained. This might be a consequence of the irrelevance of correlations for these systems but it would also be the case that some selective pressure is made towards heterogeneous networks with small correlations (i. e. no assortativeness). In order to test the previous idea we can perform a Monte Carlo search in network space. Specifically, we explore the space of possible pairs entropy-noise available to candidate graphs Ω, i. e. Γ = {H(q), Hc (q|q� )}, which is constrained by two well-defined boundaries6 : ∂1 Γ = {(H(Ω), Hc (Ω)) | Hc (Ω) = 0}
(27)
∂2 Γ = {(H(Ω), Hc (Ω)) | H(Ω) = Hc (Ω)}
(28)
where H(Ω) and Hc (Ω) indicate the entropy and noise associated to a given graph Ω. It is not difficult to show that only two points occupy the lower boundary, i. e. ∂1 Γ = {(0, 0), (log 2, 0)}. These correspond to purely homogeneous graphs and the star graph. The second boundary has already been studied. For every random sample point (H, Hc ), an optimizing searching process looks for candidate networks that minimize the error term or potential function U (Ω): U (Ω) =
& 2 2 (H − H(Ω)) + (Hc − Hc (Ω))
(29)
Here, we use the Boltzmann strategy presented in [36,37]. The algorithm explores the search space defined by all possible networks of N nodes. We assume that every possible state visited by the search process can be properly characterized by the scalar Ui . In the stationary limit (for a large number of searchers) 5
6
This conclusion is reached under our specific, quasi-local definition of remaining degree. Other approaches, considering instead shortest paths among nodes might reveal important differences Strictly speaking, we are considering the entropies associated to the remaining degree distribution of a graph sampled from some graph ensemble by a stochastic process
Information Theory of Complex Networks
203
define the occupation probability pi (t) of certain state i at time t. We require the optimization process to increase the occupation probability for the state of minimal potential. In general, many local minima exist and the search could be trapped in one of these states, which is undesirable. A dynamics that finds the minimum is given by: dpi (t) � = Aij pi (t)−Aji pj (t) dt
(30)
i =j
where � Aij =
A0ij
∗
; Ui < Uj 1 exp (−(Ui − Uj )/T (t)) ; Ui ≥ Uj
(31)
is the transition probability for the searcher to move from state i to state j. The term A0ij is 1 if and only if the state j can be reached by a little change or mutation and 0 otherwise. Here, the valid changes involve edge addition, edge removal and edge rewire, which are all equally selected with the same probability. The number of nodes of the network is always fixed. Transitions to lower energy states are always accepted but local minima is avoided because thermal fluctuations like in simulated annealing . As the search progresses, the temperature T (t) is decreased following a power law rule: T (t) =
T0 1 + at
(32)
where T0 is the initial temperature (or starting degree of disorder) and a is the cooling rate. This allows the optimization process to perform a smooth transition from coarse to detailed search. The process starts from a random graph of N nodes with a given connectivity < k > and lasts a given number of simulation steps. By measuring the final error ε(Ω) = U (Ω) for a large number of Monte Carlo samples it is possible to approximate the likelihood of a particular candidate network. Here we have used = 0.003 and the optimization parameters are: N = 500, < k >= 3, T0 = 0.01, a = 0.002 and 350000 steps. Our results indicate that the potential is effectively minimized only for a domain of pairs (H, Hc ) along the second boundary ∂2 Γ . In Fig. 9a the (smoothed) probability density P(H, Hc ) of optimized networks is shown (for the upper part of the parameter space, P(H, Hc ) = 0). The distribution is peaked around a domain of Γ that fits very well the range of values satisfied by most real networks (compare with Fig. 8). There is also a clearly empty zone outside this domain, indicating that networks are difficult or simply impossible to find. An example of the optimized graphs is shown in Fig. 9b. This particular graph is scale-free, with an exponent γ ≈ 2.26 and a cut-off at ξ ∼ 50. The other networks in this domain are also SF, with an average scaling exponent < γ >∼ 2.5. By searching candidate networks that simultaneously fit the two requirements of given entropy and noise, the only possible solutions to be found are scale-free graphs with small levels of
204
R.V. Sol´e and S. Valverde
a
6 5
0.1 4 0.05 0 2 0.5
1
1.5
2
2.5
Entropy
3
1 3.5
H(q)
4
4.5
5
5.5
6
No ise
3
H(q |q’)
P(H,Hc )
0.2 0.15
0
Fig. 9. (a) Noise-entropy probability plot obtained by exploring the Γ space using a Monte Carlo sampling. Different pairs of noise and entropy are generated and a simulated annealing search is performed looking for candidate networks. Here the smoothed probability distribution obtained from this algorithm is shown in (a). The highest density of observed networks appears to be close to the same domain observed for real networks. In (b) an example of a small sized network (N = 142, < k >= 2.64) is shown, together with its degree distribution (c). The cumulative degree distribution follows power law with exponent −1.26 (i. e. γ = 2.26). The graph has been obtained close to the boundary H = Hc (with H(q) = 3.69, H(q|q� ) = 3.09).
correlations. Interestingly, software networks deviate from this rule and are to be found along the upper region of the boundary (H > 4), where potential is not minimum. This might be a signature of frustrated optimization in software design processes [10].
7 Discussion Complex networks display heterogeneous structures that result from different mechanisms of evolution [38]. Some are created through multiplicative processes (such as preferential attachment) while others seem to be well described in terms of optimization mechanisms [9]. Our study indicates that the possible universe of complex networks is actually rather constrained. Networks display scale-free architecture but also small assortativeness. The search algorithm, instead of assuming the presence of a given predefined mechanism of network growth, simply searches for candidate solutions to an optimization algorithm trying to approach simultaneously some amount of network heterogeneity and correlations. The result is that indeed networks are scale-free and involve low degree of correlations, but such situation is constrained to a well-defined domain. This domain is remarkably similar to the one inhabited by real graphs. Outside this domain, it is not feasible to find graphs simultaneously satisfying the two requirements.
Information Theory of Complex Networks
205
The impact of SF architecture on biological and artificial networks is clearly different. Although the first can take advantage of the high homeostasis provided by scaling laws the second are completely dependent on the correct functioning of all units. Failure of a single diode in a circuit or of a single component in a software system leads to system collapse. Thus, homeostasis can not be a general explanation for scaling. We have conjectured that the leading force here is an optimization process where reliable communication at low cost shapes network architecture in first place [38]. The need of a sparse graph can be a consequence of different requirements. In an electronic circuit, saving wire is a strong constraint. In metabolic or genetic networks, it might be important in order to reduce the impact of unstable positive feedbacks. This can be satisfied by means of sparse graphs displaying scale-free architecture. What is the role of correlations? For the systems analysed here correlations don’t seem to be of relevance to network performance. But what is more important: the lack of networks outside the densely populated domain is not due to some relevant, perhaps adaptive trait. It is actually a consequence of higher-level limitations imposed to network architecture. Such a constrained set of possibilities fits very well the view of evolution as strongly dominated by intrinsic constraints [39-41] (see also [42] for a critical discussion). Under this view, the outcome of evolutionary searches would be not any possible architecture from the set of possible patterns but a choice from a narrow subset of attainable structures. Acknowledgments The authors thank the members of the Complex Systems Lab for useful discussions and to an anonymous referee for valuable comments. This work was supported by a grant BFM2001-2154, FET Open Project IST DELIS and by the Santa Fe Institute.
References 1. R. Albert and A.-L. Barab´ asi. Statistical Mechanics of Complex Networks. Rev. Mod. Phys. 74, 47-97 (2002a). 2. S. N. Dorogovtsev andJ. F. F. Mendes. Evolution of networks. Adv. Phys. 51, 1079-1187 (2002). 3. S. N. Dorogovtsev andJ. F. F. Mendes. Evolution of Networks: from biological nets to the Internet and WWW Oxford U. Press, Oxford (2003). 4. S. Bornholdt and H. G. Schuster, eds. Handbook of Graphs and Networks: From the Genome to the Internet. Springer, Berlin (2002). 5. L. A. N. Amaral, A. Scala, M. Barth´elemy and H. E. Stanley. Classes of behavior of small-world networks. Proc. Nat. Acad. Sci. USA 97, 11149-11152 (2000). 6. R. Ferrer, C. Janssen and R. V. Sol´e. Topology of Technology Graphs: Small World Patterns in Electronic Circuits Physical Review E 64, 32767 (2001). 7. A.-L. Barab´ asi and R. Albert. Emergence of scaling in random networks. Science 286, 509-512 (1999).
206
R.V. Sol´e and S. Valverde
8. S. N. Dorogovtsev andJ. F. F. Mendes. Accelerated growth of networks, in: Handbook of Graphs and Networks: From the Genome to the Internet, eds. S. Bornholdt and H.G. Schuster. pp. 320-343 Wiley-VCH, Berlin (2002). 9. R. Ferrer and R. V. Sol´e. Optimization in Complex Networks, Lect. Notes Phys. 625, 114–125 (2003). 10. S. Valverde, R. Ferrer and R. V. Sol´e. Scale free networks from optimal design Europhys. Lett. 60, 512-517 (2002). 11. R. V. Sol´e, R. Pastor-Satorras, R., Smith, E.D. and Kepler, T. A model of largescale proteome evolution. Adv. Complex Systems 5, 43-54 (2002). 12. A. Vazquez, A. Flammini, A. Maritan and A. Vespignani. Modeling of protein interaction networks. Complexus, 1, 38-44 (2002). 13. G. Caldarelli, A. Capocci, P. De Los Rios and M. A. Mu˜ noz. Scale-free networks from varying vertex intrinsic fitness. Phys. Rev. Lett. 89, 258702 (2002). 14. F. Menczer. Growing and navigating the small world web by local content. Proc. Nat. Acad. Sci. USA 99, 14014-14019 (2002). 15. E. Ravasz, A. L. Somera, D. A. Mongru, Z. N. Oltvai and A.-L. Barab´ asi. Hierarchical Organization of Modularity in Metabolic Networks. Science 297, 1551-1555 (2002). 16. M. E. J. Newman. Assortative mixing in networks. Phys. Rev. Lett. 89, 208701 (2002). 17. E. H. Stanley, S. V. Buldyrev, A. L. Goldberger, Z. D. Goldberger, S. Havlin, R. N. Mantegna, S. M. Ossadnik, C. K. Peng and M. Simon, Statistical mechanics in biology: how ubiquitous are long-range correlations? Physica A205, 214-253 (1996). 18. H. D. Abarbanel, R. Brown, J. L. Sidorowich and L. S. Tsimring. The analysis of observed chaotic data in physical systems. Rev. Mod. Phys. 65, 1331-1392 (1993). 19. R. B. Ash. Information Theory, Dover, London (1965). 20. C. Adami. Introduction to Artificial Life. Springer, New York (1998). 21. W. Li. Mutual information versus correlation functions. J. Stat. Phys. 60, 823-837 (1990). 22. W. Li. On the relationship between complexity and entropy for Markov chains and regular languages. Complex Syst. 5, 381-399 (1991). 23. A. Fraser and H. Swinney. Independent coordinates for strange attractors from mutual information. Phys. Rev. A33, 1134-1140 (1986). 24. C. Germain-Renaud and J. P. Sansonnet. Ordinateurs massivement paralleles, Armand Colin, Paris (1991). 25. V. M. Milutinovic. Computer Architecture, North Holland, Elsevier (1988). 26. W. D. Hillis. The Connection Machine, MIT Press (Cambridge, MA, 1985). 27. S. Valverde, R. Ferrer and R. V. Sol´e, Scale-free networks from optimal design. Europhys. Lett. 60, 512-517 (2002). 28. S. A. Kauffman. Origins of Order. Oxford U. Press, New York (1993). 29. R. M. May. Stability and complexity in model ecosystems. Princeton U. Press, New York (1973). 30. S. Amari. Characteristics of random nets of analog neuron-like elements. IEEE Trans. Man and Cybernetics 2, 643-657 (1972). 31. J. M. Montoya and R. V. Sol´e. Topological properties of food webs: from real data to community assembly models Oikos 102, 614-622 (2003). 32. R. Ferrer and R. V. Sol´e, Optimization in Complex Networks, Lect. Notes Phys. 625, 114–125 (2003). 33. H. Jeong, S. Mason, A.-L. Barab´ asi and Z. N. Oltvai. Lethality and centrality in protein networks Nature 411, 41 (2001).
Information Theory of Complex Networks
207
34. S. Valverde and R. V. Sol´e. Hierarchical small worlds in sotfware architecture. Santa Fe Institute Working Paper 03-07-044. 35. C. R. Myers. Software systems as complex networks: structure, function, and evolvability of software collaboration graphs, Phys. Rev. E 68, 046116 (2003). 36. F. Schweitzer, W. Ebeling, H. Rose and O. Weiss. Network Optimization Using Evolutionary Strategies, in: Parallel Problem Solving from Nature - PPSN IV, (Eds. H.-M. Voigt, W. Ebeling, I. Rechenberg, H.-P. Schwefel), Lecture Notes in Computer Science, vol. 1141, Springer, Berlin (1996) pp. 940-949. 37. F. Schweitzer. Brownian Agents and Active Particles. Springer, Berlin (2002). 38. R. V. Sol´e, R. Ferrer-Cancho, J. M. Montoya and S. Valverde. Selection, tinkering and emergence in complex networks. Complexity 8(1), 20-33 (2002). 39. F. Jacob. Evolution as tinkering. Science 196, 1161-1166 (1976). 40. P. Alberch. The logic of monsters: evidence for internal constraint in development and evolution. Geobios 19, 21-57 (1989). 41. B. C. Goodwin. How the Leopard Changed Its Spots: the Evolution of Complexity. Charles Scribner’s Sons, New York (1994). 42. S. J. Gould. The structure of evolutionary theory. Belknap, Harvard (2003).