INITIAL DELAY VS. INTERRUPTIONS: BETWEEN THE DEVIL AND THE DEEP BLUE SEA T. Hossfeld1 , S. Egger2 , R. Schatz2 , M. Fiedler3 , K. Masuch2 , C. Lorentzen3 1
University of W¨urzburg, Institute of Computer Science, W¨urzburg, Germany Email:
[email protected] 2
Telecommunications Research Center Vienna (ftw), Vienna, Austria Email: {egger,schatz,masuch}@ftw.at 3
Blekinge Institute of Technology, Karlskrona, Sweden Email: {markus.fiedler,charlott.lorentzen}@bth.se ABSTRACT End user quality perception in the context of Internet applications and services is often characterized by waiting times before service consumption as well as interruptions during service consumption. In particular in case of bad network conditions, network and service providers have to trade off between these two impairment types, i.e. between the devil and the deep blue sea. In this paper we investigate this trade-off in order to guide the design and development of Internet applications and network management approaches. The contribution of this paper is twofold. Firstly, we quantify the impact of initial delays on the user perceived Quality of Experience (QoE) for different application scenarios by means of subjective laboratory and crowdsourcing studies. We show that QoE for a given waiting time strongly depends on the concrete application at hand but that rating diversity remains fairly application-invariant. Secondly, using the example of YouTube video streaming we compare the influence of initial delays and interruptions (stallings) during watching. Our results demonstrate that users are extremely sensitive to interruptions and that services should be designed accordingly e.g. by increasing initial delay for prebuffering to overcome lack of resources. 1. INTRODUCTION Being caught between the devil and the deep blue sea phrases a dilemma situation involving only two options, with both options causing frustration. Applications and services delivered over the Internet to the end user induce this dilemma for various stakeholders. Insufficient resources (e.g. low transmission capacity), network problems (e.g. high latency), or time-consuming operations (e.g. user authentication, Internet connection setup) open a plethora of design options how to deal with these QoE impairments – typically translated into waiting times for the end user. In this context we identify two different dilemmas. On one hand, service and network providers face the dilemma between necessary investments in improving QoE and economic constraints in order to remain profitable. However, unacceptable waiting times may directly translate into user annoyance and churn. From a QoE research perspective, the question arises to which extent waiting times influence QoE for common Internet applications and services. On the other hand, if waiting times are inevitable, the service or network provider has to implement QoE management strategies for QoEoptimal service delivery. The impact of provisioned resources such as link capacity on QoE differs substantially from the impact of
‘failure in delivery’ [1] e.g. due to congestion. The QoE research challenge is to quantitatively relate QoE to waiting times (a) before service consumption, referred to as initial delay in this paper, and (b) during service consumption, i.e. a service interruption for a certain time period. The answer will also guide developers towards QoE-optimal design of applications and interfaces. In this paper, we consider three subjective user studies to analyze the impact of initial delays on QoE across applications: (a) social networking web sites with authentication [2] e.g. when a user logs in to Facebook.com, (b) setting up a 3G Mobile Internet connection [3], (c) YouTube video streaming with initial delays to fill up the video buffer. Especially the transition to HTTP media streaming in the Internet e.g. implemented by YouTube.com or Netflix.com has extended the relevance of waiting times to the domain of online video services. The usage of TCP guarantees the delivery of unaltered video content. Hence, initial delays and interruptions such as rebuffering during watching the video – denoted as stalling – are the only impairments visible to the user. Hence, video quality estimation metrics are confronted with a new paradigm. The contribution of this paper is two-fold. Contribution I: We conduct subjective user studies on initial delays for YouTube video streaming to investigate the influence of video durations on waiting times, and compare QoE results for initial delays across applications by utilizing previously conducted user studies [2, 3]. The subjective measurement studies for YouTube QoE are carried out in a laboratory and via crowdsourcing, and subsequently compared. Contribution II is an evaluation of the user perception differences regarding intial delays and interruptions on the example of YouTube. Amongst others, this paper completes the picture on YouTube QoE [4] with regard to initial delays and different video durations. In particular, the following questions are answered by the two contributions: 1. Do initial delays impact user perceived quality for different interactive data services in similar ways? 2. Are initial delays less harmful to QoE than stalling events for online video services? The remainder of this paper is organized as follows. Section 2 explains the experimental setup and subjective studies. The influence of initial delays on QoE across applications is discussed in Section 3 with a closer look at mean opinion scores and user diversity. Section 4 compares the QoE impact of initial delays and stalling for YouTube. Related work and existing models for temporal impairments for other applications are revisited in Section 5. Finally, Section 6 concludes this work and provides an outlook on future work regarding the temporal dimension of QoE.
2. EXPERIMENTAL SETUP AND SUBJECTIVE STUDIES For analyzing the QoE impact of initial delays of different applications, we utilize subjective results from previous studies on a) social networking web sites with authentication [2, 5] and b) setting up a 3G Mobile Broadband Internet connection [3, 6]. For c) YouTube video streaming encountering initial delays to fill up the video buffer, we conducted a laboratory study as well as a crowdsourcing study. To assess the differences in user perception between initial delays and stalling, we additionally conducted some stalling tests (complementing our previous YouTube study [4]). We consider videos of 30 s and 60 s duration and assume a single stalling event occuring in the middle of the video according to the YouTube application-layer traffic measurement results in [7]. Table 1 gives an overview on the tested initial delays T0 and stalling times T1 in the YouTube experiments. The YouTube laboratory study and the crowdsourcing study are described in Section 2.1 and Section 2.2, respectively. Before that, we review briefly the studies previously conducted. Authentication in Social Networks [2, 5]. The user experiments on user perceived QoE for web-based login times were tested using a laptop with a browser. The web page of the social network in the experiment used a remote OpenID server for authenticating users. A shaper provoked pre-determined response times for the authentication procedure when the user logged in. After perceiving a response time for login, the user rated the experience on a continuous scale (from 0 to 100) mapped to a 5-point absolute category rating (ACR) scale. The users were asked how they experienced the login with regard to the response time. Wireless 3G Internet Connection Setup [3,6]. For the 3G connection setup study, test users were sitting in front of a laptop. A network emulator was customized in order to delay the time span from pressing the ”Connect” button to successful connection establishment for a defined time period. After task completion, subjects were prompted for their satisfaction with the performance of the connection on a 5-point ACR scale. Technical details can be found in [3,6]. 2.1. YouTube Laboratory Test For quantifying the influence of initial delay and stalling on YouTube QoE, we conducted a lab experiment containing 41 conditions. The experiment had a total duration of 1.5 h, with an active QoE testing part of about 1 h. Test duration also included a 5 min break in-between the tests and a comprehensive briefing phase at the beginning of the test. Additionally, subjects had to fill out questionnaires about their background, technical experience as well as the current condition, fatigue and cognitive load. After the active testing part, each test was finalized with a debriefing interview and a demographic questionnaire. The QoE testing part consisted of short video clips with a duration of 30 s and 60 s. We used clips out of 5 different content classes: action trailer, music, animation, documentation and news. After each clip participants were asked to rate the perceived overall quality, including video quality and loading performance, using a 5-point ACR scale on an electronic questionnaire. In order to gather the user preference between initial delay and stalling directly we used a modified double stimulus approach. For each pair of stimuli, one video was impaired by initial delay of x seconds while the other video was impaired by one equivalent stalling event of x seconds. After each pair we asked the users on a dichotomy scale which video they preferred over the other. In total we collected data from 36 Austrian adults (19 male, 17 female) aged between 20 and 72 years (mean 39.16, median 36.5), recruited by public anouncements.
Env. Lab
Crowd Crowd Crowd Crowd [4]
Type init init stall init init stall stall
Video Dur. 60 s 30 s 30 s 60 s 30 s 60 s 30 s
Waiting Time (s) 1, 8, 16 0, 1, 8, 16 0, 0.5, 1, 2, 4, 8 0, 1, 4, 8, 16, 32 0, 1, 4, 8, 16, 32 0, 0.5, 1, 2, 4, 8 0, 0.5, 1, 2, 4, 8
Subjects 36
40 32 48 44
Table 1. Waiting time parameters for the YouTube inital delay and stalling experiments in laboratory (’Lab’) and crowdsourcing (’Crowd’) environment for video durations of 30 s and 60 s.
2.2. YouTube Crowdsourcing Test Within the QoE research community, crowdsourcing attracts increasing attention as a novel methodology for conducting subjective user study. In essence, the subjective test is outsourced to a large anonymous crowd of subjects, who remotely complete the test at their own computers. To this end, participants launch a web-based application in their browser and click through the subjective test. The main advantage of crowdsourcing are low costs and especially the speed at which tasks and test campaigns are completed. However, since the users are conducting the test remotely without direct supervision, reliability of test participants is not guaranteed. This is the major challenge for crowdsourcing QoE assessment. As a consequence, crowdsourcing-based QoE tests require proper detection and filtering of unreliable users. In our previous YouTube QoE stalling studies [4], we introduced various filtering options to identify unreliable users. (1) “Gold” data: A video clip is played out without any impairments. Then, the user is asked whether she noticed any impairments. (2) Consistency questions: The user is asked the same question twice (but slightly varied), e.g. country and later, continent of origin.(3) Content questions: The subject is asked simple questions about the content of the clip presented, e.g. “What kind of animals have you seen? a) Zebras b) Elephants c) Fishes”. This allows easily identifying unreliable users. (4) Application layer monitoring: Browser events like window focus time are monitored to check if users browsed other web pages in parallel. Furthermore, YouTube player events are monitored to ensure that the user has been presented the desired test conditions. In this work, we used the Microworkers.com crowdsourcing platform. Microworkers.com supports workers internationally in a controlled fashion, resulting in a realistic user diversity well-suited for QoE assessment. In order to ensure that the users experience the desired test conditions, the videos were completely downloaded in the background before start watching the video. The stalling patterns were then simulated locally at the end users local host using Javascript and available commands from the YouTube API. During the download of the first video, a personal data questionnaire including consistency questions was completed by the participant. After that, the user had to click a button for starting the test, which appeared upon successful download of the first video. The user then sequentially viewed six different YouTube video clips with predefined waiting times before or during service consumption, while the next video was downloaded in the background. After the streaming of the video, the user was asked to submit his current personal satisfaction rating during the video streaming. In addition, we included gold standard and content questions to identify reliable subjective ratings. The workers were not aware of these checks and were not informed about the results of their reliability evaluation. Users had
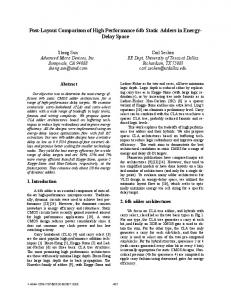
to rate the impact of waiting times on a 5-point ACR scale. For deriving the impact of various influence factors, we conducted individual crowdsourcing tests in which only a single parameter was varied, while the others were kept constant. An overview on the conducted test parameters (initial delay vs. stalling, video duration 30 s/60 s, injected delay) as well as the number of reliable subjects after filtering in the different campaigns is summarized in Table 1. 3. INFLUENCE OF INITIAL DELAYS ACROSS SERVICES The scope of this section is on the impact of initial delays for different application scenarios that comprise 1) YouTube video streaming, 2) authentication in social networks, 3) 3G Internet connection setup. Section 3.1 analyzes the mean opinion scores over the users to show that the initial delay is diverging perceived across the application scenarios. In contrast to the averaging process, Section 3.2 takes a closer look at the rating behavior of individual users to demonstrate that the diversity in user rating is similar for the different services. We conclude that the inderdependency between waiting times and Quality of Experience follows the same fundamental psychophysical model of time perception for different kinds of applications (see [3]). 3.1. Mean Opinion Scores Figure 1 shows the mean opinion scores for the different application scenarios depending on the duration T0 of the initial delay, together with errorbars representing the 95 % confidence interval over the M user ratings for the corresponding initial delay of the considered service. The number M of user ratings can be taken from Table 1. In addition, the MOS values of the subjective studies are fitted with a logarithmic function according to the WQL hypothesis [3]. This hypothesis is based on the fundamental Weber-Fechner law from psychophysics and applied to waiting times. It assumes that the relationship between ‘W’aiting time and its ‘Q’oE evaluation on a linear ACR scale is ‘L’ogarithmic. As a first observation, we find that the logarithmic function well fits the measurement results. In particular, we use a logarithmic function of the form f (T0 ) = −a log (T0 + b) + 5 to cope with zero values (T0 = 0 s) if no initial delay is present. The parameters a and b are determined by solving a non-linear minimization problem of the least-square errors between the MOS values at T0 and the model function value f (T0 ). The goodness-of-fit is expressed in terms of the coefficient of determination D which ranges from 0 (worst match) to 1 (perfect match). D can be interpreted as the fraction of variance which cannot be explained by the model, i.e., which is not correctly predicted by the model function f . Table 2 shows the model functions for the different applications which map the initial delay to MOS. Furthermore, the coefficient of determination of the curve fitting is denoted. It can be seen that for all measurement studies D is close to a perfect match. Thus, the WQL hypothesis cannot be rejected. The second observation addresses the results for YouTube video streaming. Figure 1 shows the MOS values and the fitted logarithmic functions for the results from (a) the laboratory test (solid line) and (b) the crowdsourcing test (dashed line), when the users are watching a video of duration V = 30 s. The initial delay is varied from 0 s to 32 s, see Table 1. For the sake of readability, we omit the results for the YouTube videos of duration V = 60 s in Figure 1 which are later discussed in Section 4. It can be seen that the differences between the MOS values from the lab test and the crowdsourcing test are not statistically significant. In particular, the MOS values
Fig. 1. Influence of initial delay on MOS across different services. Service Youtube (Crowd) YouTube (Lab) Social Networks 3G Setup
Mapping Function f (T0 ) −0.963 log(T0 + 5.381) + 5 −0.862 log(T0 + 6.718) + 5 −2.816 log(T0 + 1.378) + 5 −1.577 log(T0 + 0.742) + 5
G.o.F. D 0.9619 0.9983 0.9925 0.9889
Table 2. Mapping functions between initial delay T0 (in seconds) and MOS for different service scenarios as well as the corresponding goodness-of-fit in terms of coefficient of determination D.
for both experiments lie within the bounds of the confidence intervals. For readability reasons, we have also omitted the confidence intervals for the crowdsourcing test, since they anyway overlap with corresponding confidence intervals of the lab test. Thirdly, we observe that the curves for the different services strongly diverge. This means that initial delays are perceived differently for different services. For example, an initial delay of T0 = 8 s leads to the following MOS values: (A) 4.00 for YouTube (lab and crowdsourcing). (B) 3.30 for 3G Internet connection setup. (C) 2.51 for authentication in social networks. These considerable differences across services for the same stimuli (i.e. initial waiting times) may be caused by the different application contexts and resulting user expectations. In particular, users learn from everyday interaction with an application how much waiting time is expected e.g. when logging in to a social network. Furthermore, the duration of the task itself may also influence the experience, cf. the impact of video durations in Section 4. 3.2. User Rating Diversity We now take a close look at the diversity in user ratings. Here, diversity is expressed as cumulative distribution function (CDF) of the user ratings for a certain application and one dedicated test condition, i.e. the results of all user ratings for the same initial delay T0 . Exemplary, we consider the user ratings (a) from the YouTube lab study for the 30 s video for T0 ∈ {1, 8} seconds and (b) for the authentication in online social networks (OSN) for T0 ∈ {1, 4, 8} seconds. Figure 2 shows the corresponding CDF of the user ratings. We observe that for those scenarios that lead to the same MOS values1 similiar CDF shapes are observed — independent of the type of service. In particular, the CDFs for YouTube with initial delays of 1 s or 8 s reveal similar distributions as for the authentication in social networks with 1 s. This means that the user 1 MOS of 4.0 and 4.2 for YouTube streaming with T = 1 s and T = 8 s, 0 0 respectively. MOS of 4.1 for authentication in OSN with T0 = 1 s.
Fig. 2. User diversity as CDF of the user ratings for same initial delay conditions T0 for YouTube video streaming (T0 ∈ {1, 8} s) and authentication in online social networks (T0 ∈ {1, 4, 8} s).
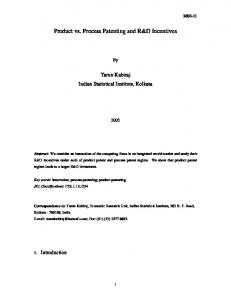
Fig. 3. User preference regarding initial delays and stallings according to (1) user survey in crowdsourcing tests ’I’, ’II’ and (2) double stimulus comparison in laboratory test with contents ’A’, ’B’.
rating diversity is comparable for those cases. Larger initial delays for authentication however are perceived worse than for YouTube (see Section 3.1) and shift the CDF to the left accordingly, making direct comparison difficult. To conclude, the individual expectations regarding the quality level are determined by the type of application and thus strongly influence how much initial delay will lead to a certain absolute MOS. However, user diversity in the context of time perception seems to be independent of the application type and may be more influenced by psychological influence factors such as type of user and sensitivity to impairments (i.e. found to be similiar across applications), uncertainty how to rate the quality absolutely for a certain test condition, etc. However, further studies are required to investigate these dependencies.
’B’) of duration 30 s each. In addition, we asked directly the participants of two different crowdsourcing tests (labeled ’I’ and ’II’) in the final interview, which type of impairment they prefer:
4. INITIAL DELAYS VS. INTERRUPTIONS: EXAMPLE ON YOUTUBE QOE As second major contribution, we compare the influence of initial delays and interruptions for a certain time during watching on the user perceived quality. For this, we consider YouTube video streaming as application, since it easily allows to design and implement appropriate user studies for comparing the different influence factors, i.e. initial delay vs. stalling. First, Section 4.1 investigates the user’s preference regarding initial delay and stalling by using a double stimulus approach in the laboratory and by asking directly the crowdsourcing participants. Then, Section 4.2 compares the user perceived quality of YouTube video streaming in presence of a certain amount of waiting time. However, the waiting time materializes either as initial delay before service consumption or as stalling with an interruption of video watching. The results from both sections clearly show that interruptions have to be avoided in any case, even at costs of increased initial delays for filling up the video buffers. 4.1. Comparison on Preference of Users As mentioned in Section 2, we used a modified double stimulus approach to evaluate the user preference between initial delay and stalling directly. For each stimulus pair, one video was impaired by initial delay of x seconds, while the other video was impaired by one equivalent stalling event of x seconds. After each pair we asked the users on a dichotomy scale which video they preferred over the other. To this end, we used two different video clips (labeled ’A’ and
“In this user survey, you have seen two different download behaviors for video streaming over the Internet. (1) Initial delays are waiting times in the beginning to pre-download the video before watching. (2) Stalling results into waiting times and stops during the video to download data. If you have to choose between one of these two options, which option would you prefer? (1) Initial delay without any stops during watching the video. (2) Stalling, but with initial delays in the beginning of the video.” Figure 3 depicts the users’ preferences for the crowdsourcing test and the laboratory test. In particular, we calculate the ratio of users which prefer initial delays and which prefer stalling. Furthermore, we calculate the exact Clopper-Pearson 95 % confidence interval. As a result, we observe a clear preference of initial delays instead of stalling in both crowdsourcing tests and for both content types in the laboratory test – as expected by the authors. However, it is interesting to see that simply asking the users (crowdsourcing) leads to roughly the same results as compared to the methodologically required, but time-consuming double stimulus comparison (laboratory). Another interesting observation is that about 10 % of the users do in fact prefer stalling. A possible explanation may be uncertainty and discomfort whether the service is working or not, while service interruptions give a clear feedback. Nevertheless, almost all users prefer uninterrupted service. 4.2. QoE Results: Initial Delay vs. Stalling Going beyond the user’s preference, we quantify the influence of the type of waiting time on the user perception as next step. To this end, we analyze the subjective user ratings for the initial delay laboratory tests for YouTube videos of duration 30 s and 60 s. Regarding stalling, we executed a laboratory study for 30 s video clips and a crowdsourcing campaign for 60 s video clips. The injected waiting times, either in terms of initial delay or in terms of one stalling event, ranging from 0 s until 32 s as given in Table 1. Figure 4 shows the MOS and the corresponding 95 % confidence intervals depending on the introduced delay. In addition, the measurement results were fitted with appropriate functions. The results yield a set of interesting insights how temporal stimuli influence Quality of Experience.
Fig. 4. One stalling vs. initial delay for YouTube QoE for videos of duration V = 30 s and V = 60 s, respectively. Video Length 60 s 30 s
Mapping Function f (T1 ) −0.334T1
1.175e + 3.190 1.710e−0.860T1 + 2.561
Fig. 5. Comparison of our model derived from subjective tests (’subjective test model’) with temporal model specified for freezing in ITU-T J.247 [15] and the piecewise linear model for HTTP streaming [11].
G.o.F. D 0.9726 0.9939
Table 3. Mapping functions between duration of stalling T1 and MOS for YouTube video streaming as well as the corresponding goodness-of-fit in terms of coefficient of determination D.
Firstly, there is no statistical difference for video clips of 30 s and 60 s regarding the MOS in dependence of initial delays. This result seems counterintuitive, given the plausible presence of the recency effect. This effect means that e.g. if a drop to “bad quality” happens close to the end of service consumption, the overall MOS is stronger influenced than if the quality drop had occured earlier [8]. Thus for longer video durations, the inital “bad quality” event happened longer time ago which should lead to more positive ratings. However, recency effects cannot be expected in this case, since initial waiting times are considered here which are not clearly perceivable impairments such as stallings that visibly interrupt the service consumption and better match the concept of a ”bad quality” event. Secondly, for stalling the video duration matters. In contrast to initial delays, stalling invokes a service interruption by definition. This leads to clearly noticeable disturbance, i.e. a “bad quality” event, to which the recency effect applies. As a result, the MOS for the same stalling duration shows significant differences for 60 s and 30 s YouTube video clips which is e.g. 3.30 and 2.51 for a stalling event of length 8 s respectively. Thirdly, the WQL hypothesis that suggests logarithmic dependencies between waiting times and QoE has to be rejected for the case of stalling. Instead, an exponential relationship leads to very good matchings2 as postulated by the IQX hypothesis [9] which relates QoE and QoS impairments. Finally, the results in Figure 4 clearly show again that service interruptions have to be avoided in any case from a user-centric point of view. Even very short stalling events of a few seconds already decrease user perceived quality significantly.
2 Coefficient of determination is 0.973 and 0.994 for exponential fittings instead of 0.945 and 0.817 for logarithmic fittings (for 60 s and 30 s videos).
5. RELATED WORK The topic of waiting times before service consumption has been studied for several decades in the domain of market research where relations between initial delay, purchase decisions and discontent have been studied. In the domain of internet services the topic is rather recent and only little work has been published so far. Results from [3, 10] relate initial delays for web browsing and connection setup with QoE, whereas [5] has studied user perception of web logins and its related waiting times. For HTTP video streaming the authors in [11] have studied the impact of initial delays and integrated results from objective tests in their piecewise linear model. For IPTV services, which are affected by initial delays in the form of waiting times in channel zapping as well [12] have studied its impact on user perceived quality. What is missing from these results is a comparison of the initial delay impact on QoE across different services as we have shown in Sec. 3. Regarding service interruptions in video services most of the current work has focused on frame freezing caused by bursty packet losses. The authors in [13] and [14] have studied users’ reactions to different disturbance patterns including frame freezing and skipping at the beginning, in the middle and at the end of the video. Their results correspond to each other in terms of the finding that the average ratings of disturbances in the middle of the video are perceived worse than those in the beginning and at the end. Additionally, [14] concludes that “viewers prefer a scenario in which a single but long freeze occurs to a scenario in which frequent short freezes occur.” Also the current ITU-T recommendation on a objective multimedia quality model [15] considers frame freezing and frame skipping jointly. Contrary, the studies reported in [16] and [17] do neglect impairments from frame skipping and concentrate solely on the impact of frame freezing itself. For HTTP video streaming, where frame skipping does not take place either, [4] and [11] have studied the impact of stalling events on user perceived video quality. Out of this overview, only the latter two studies have studied interruptions with rebuffering indication (stalling) as it takes place in HTTP streaming. However, none of these studies has sufficiently studied the trade off between initial delays and interruptions. Next, we revisit models found in literature and compare them with our model functions describing the impact of stalling on YouTube QoE as provided in Table 3. In particular, we consider
the piecewise linear model for HTTP streaming [11] taking into account stalling events. Figure 5 shows the MOS depending on the stalling length D normalized by the video duration V , i.e. D∗ = D/V . Although [11] converges to similar MOS values for long stalling events, the model fails in predicting accurately MOS for shorter stalling events below 4 s emerging in bandwidth limited scenarios for YouTube [7]. Furthermore, we apply the temporal model specified for freezing with skipping in ITU-T J.247 [15]. This model considers only relative delays. However, the comparison in Figure 5 shows that the freezing model is not applicable to stalling and completely neglects the influence of video duration. 6. CONCLUSIONS AND FUTURE WORK In this paper we showed that temporal stimuli are key features to many diverging Internet applications and services. These temporal stimuli can be classified into waiting times before and interruption during service consumption. We answered the first research question on the QoE impact of initial delays by conducting a series of subjective studies on the user perception of different applications comprising YouTube video streaming, wireless Internet connection setup, and authentication in social networks. As a major result, we found that QoE of a given waiting time strongly depends on the concrete application, but that the user rating diversity remains remarkably application-invariant. We conclude that the interdependence between waiting times as stimuli and QoE follows the same fundamental psychophysical principles of time perception for all different kinds of applications. Likewise, the individual expectations regarding the quality level are determined by the specific type of application and thus influence a user’s QoE sensitivity to waiting times. In contrast, user opinion diversity in the context of time perception remains independent of the type of application or service consumed. As second key contribution we analyzed the impact of service interruptions in the context of waiting times. Using the example of YouTube video streaming, we answered the question whether initial delays are less harmful to QoE than stalling events for online video services. In case of bad network conditions, providers have to trade off between these two impairment types, between the devil and the deep blue sea. Our results clearly show that service interruptions have to be avoided in any case, even at costs of increased initial delays for filling up the video buffers. This understanding allows QoE management e.g. for HTTP video streaming clouds [18], monitoring and estimating QoE [19], and finally adapting and controlling QoE [20, 21]. As a further result, we found fundamental differences between both kinds of temporal stimuli, i.e. initial delays and stalling, when studying their impact for different video durations. Regarding initial delays, users learn from everyday usage of applications how much waiting time can be expected, independent of the duration of the service consumption period afterwards. In contrast to initial delays, stalling invokes a sudden, unexpected service interruption. Hence, recency effects apply and impact QoE. Future QoE research directions need to address expectations as key influence factor, long duration stimuli tests e.g. for video [22] and temporal stimuli in general. 7. ACKNOWLEDGMENTS This work was funded by the European FP7 Network of Excellence “Euro-NF” through the Specific Joint Research Project “PRUNO: Prospects for Realizing User-centric Network Orchestration” and the and the strategic project U-0 at FTW funded within the program COMET - Competence Centers for Excellent Technologies. The authors would like to thank Christian Sieber for his tremendous efforts in implementing the YouTube crowdsourcing tests and Matthias Hirth for taking care of the crowdsourcing campaigns at any time.
8. REFERENCES [1] T. Hoßfeld, M. Fiedler, and T. Zinner, “The QoE Provisioning-Delivery-Hysteresis and Its Importance for Service Provisioning in the Future Internet ,” in Proceedings of the 7th Conference on Next Generation Internet Networks (NGI), (Kaiserslautern, Germany), June 2011. [2] C. Lorentzen, M. Fiedler, and H. Johnson, “On user perception of safety in online social networks,” IJCNDS Special Issue on “Modelling of Emerging Internet Services: Social Networks and Crowdsourcing”, 2012. [3] S. Egger, P. Reichl, T. Hossfeld, and R. Schatz, “ ’Time is Bandwidth’? Narrowing the Gap between Subjective Time Perception and Quality of Experience,” in IEEE ICC 2012 - Communication QoS, Reliability and Modeling Symposium (ICC’12 CQRM), (Ottawa, Ontario, Canada), June 2012. [4] T. Hoßfeld, R. Schatz, M. Seufert, M. Hirth, T. Zinner, and P. Tran-Gia, “Quantification of YouTube QoE via Crowdsourcing,” in IEEE International Workshop on Multimedia Quality of Experience - Modeling, Evaluation, and Directions (MQoE 2011), (Dana Point, CA, USA), Dec. 2011. [5] C. Lorentzen, M. Fiedler, H. Johnson, J. Shaikh, and I. Jø rstad, “On User Perception of Web Login - A Study on QoE in the Context of Security,” in In: Proceedings of Australasian Telecommunication Networks and Applications Conference, (Auckland, New Zealand), pp. 84–89, November 2010. [6] P. Reichl, S. Egger, R. Schatz, and A. D’Alconzo, “The Logarithmic Nature of QoE and the Role of the Weber-Fechner Law in QoE Assessment,” in Proceedings of the 2010 IEEE International Conference on Communications, pp. 1 –5, May 2010. [7] T. Hoßfeld, T. Zinner, R. Schatz, M. Seufert, and P. Tran-Gia, “Transport Protocol Influences on YouTube QoE ,” Tech. Rep. 482, University of W¨urzburg, July 2011. [8] A. Watson and M. A. Sasse, “Measuring perceived quality of speech and video in multimedia conferencing applications,” in Proceedings of the sixth ACM international conference on Multimedia, MULTIMEDIA ’98, (New York, NY, USA), pp. 55–60, ACM, 1998. [9] M. Fiedler, T. Hossfeld, and P. Tran-Gia, “A generic quantitative relationship between quality of experience and quality of service,” Netwrk. Mag. of Global Internetwkg., vol. 24, pp. 36–41, March 2010. [10] International Telecommunication Union, “Estimating end-to-end performance in ip networks for data applications,” ITU-T Recommendation G.1030, November 2005. [11] R. Mok, E. Chan, and R. Chang, “Measuring the Quality of Experience of HTTP video streaming,” in Proc. 12th IFIP/IEEE Int. Symp. on Integrated Network Management, pp. 485–492, 2011. [12] R. E. Kooij, A. Kamal, and K. Brunnstr¨om, “Perceived quality of channel zapping,” in Communication Systems and Networks, pp. 156–159, 2006. [13] T. Minhas and M. Fiedler, “Impact of disturbance locations on video Quality of Experience,” in Proc. Euro-ITV, Workshop on Quality of Experience for Multimedia Content Sharing, June 2011. [14] Y. Qi and D. Mingyuan, “The effect of frame freezing and frame skipping on video quality,” in Proc. Int. Conf. on Intelligent Information Hiding and Multimedia Signal Processing (IIH-MSP06), pp. 423–426, Dec. 2006. [15] International Telecommunication Union, “Objective perceptual multimedia video quality measurement in the presence of a full reference,” ITU-T Recommendation J.247, August 2008. [16] J. You, M. Hannuksela, and M. Gabbouj, “An objecive video quality metric based on spatiotemporal distortion,” in Proc. 16th IEEE Int. Conf. in Image Processing (ICIP), pp. 2229–2232, Nov. 2009. [17] Q. Huynh-Thu and M. Ghanbari, “No-reference temporal quality metric for video impaired by frame freezing artefacts,” in Proc. 16th IEEE Int. Conf. in Image Processing (ICIP), pp. 2221–2224, Nov. 2009. [18] T. Hoßfeld, R. Schatz, M. Varela, and C. Timmerer, “Challenges of QoE Management for Cloud Applications,” IEEE Communications Magazine, Apr. 2012. [19] R. Schatz, T. Hoßfeld, and P. Casas, “Passive YouTube QoE Monitoring for ISPs,” in Workshop on Future Internet and Next Generation Networks (FINGNet-2012), (Palermo, Italy), July 2012. [20] T. Hoßfeld, F. Liers, T. Volkert, and R. Schatz, “FoG and Clouds: Optimizing QoE for YouTube,” in KuVS 5thGI/ITG KuVS Fachgespr¨ach NG Service Delivery Platforms, (Munich, Germany), Oct. 2011. [21] B. Staehle, F. Wamser, M. Hirth, D. Stezenbach, and D. Staehle, “AquareYoum: Application and Quality of Experience-Aware Resource Management for YouTube in Wireless Mesh Networks,” PIK - Praxis der Informationsverarbeitung und Kommunikation, 2011. [22] U. Reiter, “Quality of experience: a buzzword or the key to successful multimedia delivery across networks?,” in Proceedings of the 6th Latin America Networking Conference, LANC ’11, (New York, NY, USA), pp. 20–24, ACM, 2011.