setts; Nevada Cancer Institute (H.M.G.), University of Nevada, Las Vegas, ... This work was supported by funds from the National Institute of Aging to O.L.L. ...
ORIGINAL RESEARCH C.A. Raji C. Lee O.L. Lopez J. Tsay J.F. Boardman E.D. Schwartz W.S. Bartynski H.M. Hefzy H.M. Gach W. Dai J.T. Becker
Initial Experience in Using Continuous Arterial Spin-Labeled MR Imaging for Early Detection of Alzheimer Disease BACKGROUND AND PURPOSE: MR imaging of the brain has significant potential in the early detection
of neurodegenerative disorders such as AD. The purpose of this work was to determine if perfusion MR imaging can be used to separate AD from normal cognition in individual subjects. We investigated the diagnostic utility of perfusion MR imaging for early detection of AD compared with structural imaging. MATERIALS AND METHODS: Data were analyzed from 32 participants in the institutional review
board⫺approved CHS-CS: 19 cognitively healthy individuals and 13 with clinically adjudicated AD. All subjects underwent structural T1-weighted SGPR and CASL MR imaging. Four readers with varying experience separately rated each CASL and SPGR scan finding as normal or abnormal on the basis of standardized qualitative diagnostic criteria for observed perfusion abnormalities on CASL or volume loss on SPGR and rated the confidence in their evaluation. RESULTS: Inter-rater reliability was superior in CASL ( ⫽ 0.7 in experienced readers) compared with
SPGR ( ⫽ 0.17). CASL MR imaging had the highest sensitivity (85%) and accuracy (70%). Frontal lobe CASL findings increased sensitivity to 88% and accuracy to 79%. Fifty-seven percent of false-positive readings with CASL were in controls with cognitive decline or instability within 5 years. Three of the 4 readers revealed a statistically significant relationship between confidence and correct classification when using CASL. CONCLUSIONS: Readers were able to separate individuals with mild AD from those with normal cognition with high sensitivity by using CASL but not volumetric MR imaging. This initial experience suggests that CASL MR imaging may be a useful technique for detecting AD. ABBREVIATIONS: AA ⫽ African American; AD ⫽ Alzheimer Disease; CASL ⫽ continuous arterial
lzheimer Disease is the most common cause of dementia in the elderly and is expected to affect 13.5 million individuals by 2050.1 As preventive and treatment innovations are developed, there is a critical need to identify subjects with AD as early as possible. One drawback of conventional clinical evaluations is that subjects with frank dementia symptoms are Received August 6, 2009; accepted after revision October 8. From the Departments of Pathology (C.A.R.), Radiology (C.A.R., J.T., J.F.B., W.S.B., H.M.G.), Neurology (O.L.L., J.T.B.), Psychiatry (J.T.B.), and Psychology (J.T.B.), University of Pittsburgh School of Medicine, Pittsburgh, Pennsylvania; Department of Radiology (C.L.), University of Cincinnati Hospital, Cincinnati, Ohio; Department of Neurology (H.M.H.), Henry Ford Hospital, Detroit, Michigan; Shields Health Care Group (E.D.S.), Brockton, Massachusetts; Nevada Cancer Institute (H.M.G.), University of Nevada, Las Vegas, Nevada; University of Nevada School of Medicine (H.M.G.), Reno, Nevada; and Beth Israel Deaconess Medical Center (W.D.), Harvard Medical School, Boston, Massachusetts. This work was supported by funds from the National Institute of Aging to O.L.L. (AG20098; AG05133) and a Radiologic Society of North America Medical Student Research Grant to C.A.R. (RMS0717). C.A.R. was also supported in his training by a pre-doctoral grant from the American Heart Association (0815465D). Please address correspondence to Cyrus A. Raji, PhD, University of Pittsburgh School of Medicine, 3501 Forbes Ave, Ste 830, Pittsburgh, PA 15213-2582; e-mail: cyrusraji@ gmail.com Indicates open access to non-subscribers at www.ajnr.org DOI 10.3174/ajnr.A1955
often too advanced in their disease to be effectively treated. Neuroimaging methods hold much promise for detecting early AD or before its clinical symptoms fully develop. Such methods would be most clinically useful if they classified an individual as either having AD or being a healthy control. While voxel-based methods exist, they are limited in that they provide information on a group and not on an individual subject level.2,3 Visual classification of images, however, can readily separate individuals into diagnostic categories. Multiple brain imaging modalities are currently used in clinical and research settings to attempt to better diagnose and study neurodegenerative disorders, particularly AD. Structural MR imaging is commonly part of the work-up for dementia,4 and volumetric studies have been effective in identifying specific regional atrophy at a group level.5 FDG-PET6 and SPECT7 have shown some utility for the diagnosis of AD. However, these require the injection of tracers that increase radiation exposure. A more widely available and inexpensive technique than PET that produces better spatial resolution than SPECT without ionizing radiation would be valuable. One such potential method is CASL MR imaging, which generates an endogenous contrast by the application of radiofrequency pulses to “label” water proton spins in blood flowAJNR Am J Neuroradiol 31:847–55 兩 May 2010 兩 www.ajnr.org
847
ORIGINAL RESEARCH
A
BRAIN
spin-labeled; CHS ⫽ Cardiovascular Health Study; CHS-CS ⫽ Cardiovascular Health Study Cognition Study; FDG-PET ⫽ fluorodeoxyglucose–positron-emission tomography; L ⫽ left; MCI ⫽ mild cognitive impairment; MMSE ⫽ Mini-Mental State Examination; MRI ⫽ MR imaging; PET ⫽ positron-emission tomography; R ⫽ right; rCBF ⫽ regional cerebral blood flow; ROC ⫽ receiver operating characteristic; SPECT ⫽ single-photon emission computed tomography; SPGR ⫽ spoiled gradient-recalled echo
Table 1: Subject characteristics
Number Age (SD and range) Male/female Caucasian/AA Education (beyond 12th grade/12th grade) Modified MMSE Hypertension (⫾) Heart disease Type II diabetes mellitus MRI infarcts (⫾) Small vessel ischemic disease a
Normal Cognition 19 82.31 ⫾ 3.87 (76.17–93.34) 8/11 18/1 11/8 94.73 ⫾ 4.44 (85–99) 11/8 17/2 17/2 12/7 11/8
Probable AD 13 83.1 ⫾ 3.35 (77.22–88.32) 8/5 13/0 8/5 88.9 ⫾ 6.31 (76–97) 10/3 10/3 10/2 9/4 8/5
2/T Test Valuea
P Value, Cohen D or
⫺.63
.53, .23
1.17 .71 .04 3.08
.47, .28 .59, .41 .56, .84 ⬍.01, 1.11
1.23 .92 .25 .13 .04
.23, .27 .32, .34 .63, .09 .53, .72 .57, .84
df ⫽ 30.
ing through the carotid and vertebral arteries.8,9 These labeled spins exchange with unlabeled spins in brain tissue to yield a quantifiable map of rCBF. CASL MR imaging does not require any exogenous contrast agents. Perfusion imaging with arterial spin-labeled MR imaging has been validated against quantitative techniques such as 15O PET10 and has been used to show that perfusion abnormalities can occur very early in the course of neurodegeneration.11-14 These findings motivated the present study to assess the diagnostic utility of perfusion MR imaging versus structural imaging in the classification of AD versus normal cognition. We hypothesized that perfusion CASL MR imaging would have superior utility over 3D volumetric SPGR for the diagnostic separation of AD from normal cognition. Quantitative rCBF measurements were available for this work but were not used because there is no consensus regarding what perfusion cutoff value distinguishes AD from normal cognition. In the absence of such a consensus, investigators typically use an arbitrary criterion of a perfusion value being 2 SDs below the mean for the control group,15 and this approach has yielded limited success. A SPECT perfusion imaging study that used a perfusion cutoff 2 SDs below the control group mean yielded a specificity of 87% but a relatively poor sensitivity of 63%.16 A PET study that used rCBF levels of the temporal lobe with a consensus diagnosis yielded a specificity of 88% but a poor sensitivity of 38%.17 Were we to apply a 2-SD cutoff for CASLmeasured hippocampal perfusion, for instance, we would not find that any of our 32 subjects (healthy or with dementia) were below this arbitrary cutoff. Our work, therefore, focused on qualitative evaluations of both CASL and SPGR MR imaging scans. Materials and Methods Subjects Each subject provided informed consent to participate in the institutional review board⫺approved CHS-CS. Retrospective data were analyzed from a subset of participants in this community-based longitudinal cohort study.18,19 The CHS-CS is a branch of the larger Cardiovascular Health Study, initiated in 1988 with recruitment based on Medicare eligibility lists.20 The purpose of the CHS-CS is to identify risk factors for and to track the longitudinal progression of dementias such as AD. CHS-CS inclusion and exclusion criteria have 848
Raji 兩 AJNR 31 兩 May 2010 兩 www.ajnr.org
been carefully documented in prior studies.21,22 Perfusion and structural MR imaging scans of the brain were obtained in the CHS-CS as previously described.23 From this group, we selected 32 individuals: 19 cognitively normal elderly subjects and 13 subjects with an adjudicated research-level diagnosis21 of probable AD by using the criteria of the National Institute of Neurological and Communicative Disorders and Stroke–Alzheimer’s Disease and Related Disorders Association.24 At the time of scanning, AD subjects had neither been identified by their primary care physician with a cognitive disorder nor were they taking any cholinesterase inhibitors. Inclusion criteria for the 32 subjects in the present study were the following: 1) clinical classification of either normal cognition or AD by using standard CHS criteria,21 2) availability of both structural and perfusion MR imaging scans obtained as part of the CHS-CS, 3) 5-year longitudinal evaluation of cognitive status. Exclusion criteria for CASL data imaging and/or analysis were the following: 1) a history of clinical stroke or carotid stenosis as assessed with standard CHS criteria25,26; 2) radiologic evidence of structural brain lesions (eg, tumors, trauma, or surgery); 3) history of head trauma or encephalitis; 4) consumption of caffeine within 8 hours before examination because this has been linked with lower cerebral perfusion27; 5) inability to segment images by using semiautomated tools; 6) placement of the labeling plane not orthogonal to both carotid arteries and/or the difference between left and right carotid arterial mean velocities exceeding 20% of the mean, which was used as a marker of carotid stenosis; 7) excessive patient motion as evidenced in structural images; or 8) excessive image artifacts (eg, hair oil or dental implant). Table 1 summarizes subject demographics and information on vascular diseases such as hypertension and white matter hyperintensity grade, all determined by using standard CHS criteria.25,28,29 MR imaging⫺identified infarcts were classified as lesions on T2 or proton attenuation sequences of ⬎3 mm in diameter with no associated clinical symptoms of stroke.30,31 A white matter grading of ⱖ3 was defined in the CHS as radiologic evidence for small vessel ischemic disease.32 There were no statistically significant differences between the control and AD groups, except the modified MMSE score.33 The average modified MMSE score of the AD group was approximately 9 points above the standard clinical dementia cutoff of 80,34 meaning that the subjects with AD were very early in their clinical dementia course. None of the patients with AD had been clinically identified with dementia by their primary care physicians nor were any being treated for a dementia by using cholinesterase inhibitors.
Perfusion MR imaging All MR imaging data were acquired by using a 1.5T scanner (Signa Horizon LX; GE Healthcare, Milwaukee, Wisconsin). Multisection CASL was applied as demonstrated in prior work.23,35-37 In summary, our CASL sequence used ramp-sampled echo-planar imaging to acquire 19 contiguous axial sections (64 ⫻ 64 matrix, 2-cm FOV, 5-mm section thickness, 0 spacing, 21-ms TE (ie, minimum full), 76-kHz effective receiver bandwidth, 1-second acquisition time, 700-ms transit delay, 90° flip angle). The alternating single adiabatic inversion label and double adiabatic inversion control labeling planes were positioned near the cervicomedullary junction to acquire images of the entire cerebrum and were repeated 50 times for signal-intensity averaging the pairs of acquisitions. The labeling period or bolus width in time was 3.7 seconds. CASL data were converted into rCBF maps by using previously described kinetic models.23,38 The specific tracer convolution model of CASL used in both the present and prior work had several assumptions, including that tracer decay occurs before exchanging with tissue water and that the endogenous tracer arrival time occurs when the CASL control-label-difference signal intensity reaches its maximum.39 All perfusion images were registered to a common stereotactic space in the standard single-subject Montreal Neurologic Institute template by using a fully deformable registration method.40 This was done to correct CASL images for partial volume effects, which are a substantial source of error in perfusion imaging and can generate inaccurate underestimations of rCBF in the elderly.15,41 Such error can consequently hinder even visual evaluations of perfusion MR imaging, and because of this, we elected to partial volume correct our CASL images. Partial volume correction also addresses lower rCBF due to atrophy and amplifies the likelihood of detecting the earliest perfusion changes associated with AD, which often occur before the onset of significant cerebral atrophy.42
Structural MR Imaging Acquisition Structural imaging methods for the CHS are described in greater detail elsewhere.39,43 Briefly, a 3D volumetric SPGR sequence was performed for the whole brain (TE/TR, 5/25 ms; flip angle, 40°; NEX, 1; section thickness, 1.5 mm/0 mm intersection gap), with an in-plane acquisition matrix of 256 ⫻ 256 ⫻ 124 image elements, 250 ⫻ 250 mm FOV, and an in-plane voxel size of 0.98 mm3.
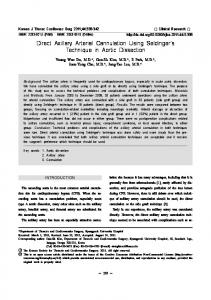
Image Interpretation An experienced board-certified neuroradiologist with Certificate of Added Qualification (C.L., 30 years of experience, United States) developed the CASL reader criteria and a separate set of criteria for grading the structural scans (Appendices A and B). For every CASL scan, each reader (readers 1 and 2: J.F.B. and E.D.S., ⱖ5 years of clinical experience after neuroradiology fellowship; readers 3 and 4: J.T. and H.M.H., ⬍5 years of experience) had to complete the evaluation sheet described in Appendix A. Briefly, for the CASL scans, each reader had to specify whether thinning and focal gaps in perfusion were noted in the cortex on visual inspection of all CASL MR imaging sections. Next, the reader had to visually assess whether rCBF appeared lower in each of 9 brain regions selected for evaluation because they are common targets of AD pathology44-46 (Fig 1).47 Finally, the readers had to classify the scan findings as “normal” or “abnormal” and rate their confidence in that classification on a 5-point Likert scale.48 Visual identification of cortical thinning/focal gaps and lower appearing rCBF in any of the 9 selected regions were essential criteria for rendering an evaluation of abnormal findings with CASL.
Fig 1. Midaxial CASL image shows the regions assessed by the reader: 1, anterior cingulate gyrus; 2, middle frontal lobe; 3. caudate nucleus; 4, putamen and globus pallidus; 5, thalamus; 6, superior and medial temporal lobes; 7, parietal lobes; 8, posterior cingulate gyrus; 9, occipital lobes. Many of these regions, such as the cingulate gyrus, temporal lobes, and thalamus, are common targets of AD pathology. Reproduction of Fig 1 with permission from Lee et al.47
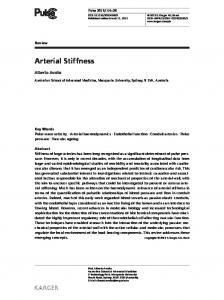
Figure 2 shows 2 axial CASL scans used as instructional examples for distinguishing normal versus abnormal findings in detecting AD. Neither of the 2 images in this figure was evaluated by the readers in the actual study. One scan is from a control subject (Fig 2A), and the other is from a person with AD (Fig 2B). The control scan is characterized by the presence of foci of uniformly robust cortical signal intensity representing areas of normal perfusion (purple arrows). The scan of the subject with AD lacks these foci, and the few that exist are typically reduced in size and intensity (green arrows) compared with those in the control subject. There are also focal gaps in perfusion in the person with AD in the frontal lobe (turquoise arrow). The color bar shows the corresponding perfusion values in milliliters of blood per gram of tissue per minute. For the evaluation of volume loss by using SPGR, each reader had to assess whether brain volume and sulcal width were appropriate for age and to complete the evaluation sheet presented in Appendix B. The reader had to visually judge whether volume loss was noted in 7 specific brain regions and whether there was enlargement of the cerebral ventricles; all 120 image sections were available for inspection. Visual assessment of generalized cortical volume loss greater than that expected for age or focal hippocampal atrophy was an essential criterion in rendering an abnormal evaluation. The regions listed in Appendix B were chosen because they are early targets of AD pathology.49 As with the CASL scans, the readers had to rate their confidence on a Likert scale. CASL and SPGR scans were examined in separate sessions, with neither technique used to inform the evaluation of the other. The 4 readers were blinded to the clinical diagnosis, and each separately evaluated the 32 CASL MR imaging scans and 32 corresponding SPGRs. Before the readings were performed, a group didactic session was conducted by C.L. to detail both CASL and SPGR criteria to the readers. All images were displayed by using the OsiriX Imaging Software (http://www.osirix-viewer.com). All readers had access to the PowerPoint file used in the teaching session for reference, but they could not interact with C.L. or each other in evaluating the scans. The CASL and SPGR images shown in PowerPoint for teaching purposes were not the same scans evaluated by the readers. AJNR Am J Neuroradiol 31:847–55 兩 May 2010 兩 www.ajnr.org
849
Fig 2. Examples of control (A) and AD (B) CASL images. Please refer to text for details.
No reader had access to any clinical history or information about the subjects aside from their age for the SPGR evaluations.
Statistical Analysis All data were analyzed by using standard software (SPSS, Version 16.0; SPSS, Chicago, Illinois), and there were 5 components to the statistical analysis: 1) assessment of inter-reader reliability in the CASL and SPGR modalities by using the statistic50 (the inter-rater reliability analyses were performed by grouping the readers into relatively more experienced, readers 1 and 2, and relatively less experienced, readers 3 and 4, categories); 2) ROC analysis for each reader comparing CASL and SPGR; 3) calculation of sensitivity, specificity, and accuracy by using ROC curve analysis; 4) identification of the 1 brain region out of 9 listed in Appendix A that most consistently had lower appearing rCBF among correct abnormal CASL classifications in the 4 readers and recalculation of sensitivity, specificity, and accuracy values based on that region; and 5) correlation analysis between the correct diagnosis and confidence in each modality.
Longitudinal Evaluation of CASL False-Positives We evaluated CASL false-positives, abnormal image interpretations assigned by readers to 1 of the 19 control subjects in this study, to determine if they occurred in subjects who experienced cognitive decline or instability 5 years later. Each subject was clinically evaluated annually for any signs of cognitive decline as previously described.7,19,51 Cognitive decline was classified as conversion from normal cognition to either AD or MCI—a high risk state for future dementia, in which cognition is reduced but not yet below the clinical cutoffs for dementia.52 We also noted if false-positives occurred in subjects who experienced any instability in their cognitive status. One common example of this would be in subjects who converted to MCI 1 year after their CASL scan but reverted to healthy at the completion of the 5-year follow-up period. We computed the percentage of falsepositive readings in all 4 readers that occurred in subjects who converted as a fraction of the total number of false-positives summed across all 4 readers. We also identified in this exploratory analysis the relative proportion of controls who remained healthy, experienced cognitive fluctuations, converted to MCI, or converted to AD. 850
Raji 兩 AJNR 31 兩 May 2010 兩 www.ajnr.org
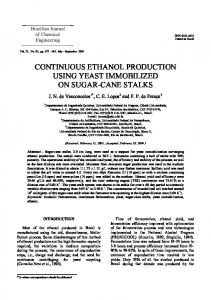
Results Figure 3 shows representative examples of true-negative (normal classified as normal), true-positive, false-negative (abnormal classified as normal), and false-positive CASL images. The true-negative scan in Fig 3A has uniformly high perfusion (60to 90-mL blood/g tissue/min) throughout the cortex. The true-positive scan (Fig 3B) has reduced perfusion globally to approximately 30 mL blood/g tissue/min, and this is especially pronounced in the frontal lobes. The false-negative scan (Fig 3C) has a varied pattern of rCBF. There are some regions of the cortex that appear to have lower perfusion, such as the parietal lobes, but other areas such as the thalamus and posterior cingulate appear to show normal-to-higher perfusion levels. The false-positive scan (Fig 3D) has a mean global perfusion of 50-mL blood/g tissue/min, giving the appearance of lower perfusion in the cortex, when it was actually at the lower end of the normal range of 50- to 54-mL blood/g tissue/min in the brain.53 Table 2 shows individual reader values for sensitivity, specificity, and accuracy for all 4 readers and the average across all readers. CASL MR imaging had higher sensitivity and accuracy than SPGR, which had higher specificity than CASL. Inter-rater agreement with CASL was superior to that with SPGR imaging. For CASL, the inter-rater agreement for the relatively experienced readers (1 and 2) was superior ( ⫽ 0.70, P ⬍ .001) but for SPGR scans the agreement was poor ( ⫽ 0.17, P ⫽ .39). Less experienced readers also had a high agreement when using CASL ( ⫽ 0.54, P ⫽ .002) but not with SPGR ( ⫽ 0.03, P ⫽ .46). In subjects in whom an abnormal classification by a reader on CASL correctly matched a clinical diagnosis of AD (truepositive), the 9 regions from Appendix A were rank ordered to determine which area was most frequently identified as having lower appearing rCBF in these subjects. This process was done in all 4 readers, and the ranks are shown in Table 3. The table values refer to the percentage of true-positive cases in which that region was visually classified on Appendix A as having a lower appearing rCBF to the reader. Three of 4 readers iden-
Fig 3. Axial CASL MR images obtained at the level of the thalamus. A, True-negative. B, True-positive. C, False-negative. D, false-positive. The images are obtained from the OsiriX Imaging Software with a standard Hot Iron scale of 0- to 100-mL blood/g tissue/min, the same scale used by the readers to view the scans shown in Fig 2.
Table 2: Summary of individual and average reader metrics of diagnostic utility
CASL Reader 1 Reader 2 Reader 3 Reader 4 Average (%) SPGR Reader 1 Reader 2 Reader 3 Reader 4 Average (%)
Sensitivity (%)
Specificity (%)
Accuracy (area under ROC curve, %)
69 77 92 100 85
74 53 47 42 54
72 65 70 71 70
77 54 8 85 56
53 79 100 47 70
65 66 54 66 63
tified the frontal lobe as having lower rCBF in 100% of their true-positive cases. Because of this, sensitivity, specificity, and accuracy values were recalculated on the basis of this frontal lobe finding, and these results are shown in Table 4. Compared with classifications using all brain regions, as shown in Table 2, the sensitivity of CASL MR imaging for detecting AD increased from 85% to 88%, specificity increased from 54% to 68%, and accuracy went from 70% to 79%. These results suggest that a regionally specific visual finding of lower frontal lobe rCBF on CASL adds additional diagnostic utility for the classification of individuals with AD versus those with normal cognition. Three of 4 readers were more likely to have a statistically significant correlation between higher confidence and the correct diagnosis, and these results are summarized in Table 5.
Only reader 3 (r ⫽ 0.34, P ⫽ .06) did not show a statistically significant correlation between confidence rating and a CASL image evaluation that matched the clinical diagnosis, though there was a trend toward significance. The CHS-CS is a longitudinal study with clinical data and dementia classifications obtained annually for 5 years after scanning for all 19 controls in this study. In that group, 42% (8/19) remained healthy, 10% (2/19) experienced cognitive fluctuations, 32% (6/19) converted to MCI, and 16% (3/19) converted to AD. Across all 4 readers, there were a total of 35 false-positive errors. There were 20/35 false-positive observations (57%) that occurred in subjects who either converted to MCI after 5 years (n ⫽ 4), converted to AD after 5 years (n ⫽ 2), or experienced a cognitive fluctuation after 5 years (n ⫽ 2). The remaining number of false-positive errors (15/35; 43%) occurred in subjects who remained cognitively healthy after 5 years (n ⫽ 6). We also investigated whether there was a relationship between a false-positive error and the presence of a risk factor for cardio- or cerebrovascular disease. There were no statistically significant correlations between false-positives and the presence of hypertension (2 ⫽ 0.08, P ⫽ .56, df ⫽ 1), MR imaging infarcts (2 ⫽ 0.04, P ⫽ .61, df ⫽ 1), small vessel ischemic disease (2 ⫽ 0.01, P ⫽ .63, df ⫽ 1), heart disease (2 ⫽ 0.84, P ⫽ .37, df ⫽ 1), or type II diabetes mellitus (2 ⫽ 0.01, P ⫽ .67, df ⫽ 1). All subjects were receiving medical treatment for their diabetes, hypertension, and heart disease. Discussion Perfusion CASL MR imaging, a method that uses no radioactive or exogenous contrast agents, has good diagnostic utility in identifying AD compared with structural MR imaging. ViAJNR Am J Neuroradiol 31:847–55 兩 May 2010 兩 www.ajnr.org
851
Table 3: Most commonly identified regions in correct abnormal CASL scan classifications by reader Reader 1 (%) Frontal lobes (100) Caudate (100) Lentiform (100) Thalamus (89) Medial temporal lobe (78) Precuneus (78) Anterior cingulate (67) Posterior cingulate (67) Parietal cortex (67)
Reader 2 (%) Frontal lobes (100) Caudate (100) Thalamus (90) Lentiform (80) Medial temporal lobe (80) Posterior cingulate (60) Parietal cortex (50) Anterior cingulate (40) Precuneus (20)
Table 4: Sensitivity, specificity, and accuracy values across all 4 readers based upon visual identification of lower rCBF in the frontal lobes with CASL
CASL Reader 1 Reader 2 Reader 3 Reader 4 Average (%)
Sensitivity (%) 69 92 92 100 88
Specificity (%) 79 63 68 63 68
Accuracy (area under ROC curve, %) 74 78 80 82 79
sual evaluations of CASL MR imaging can identify subjects with AD regardless of reader experience—though more experienced readers had better inter-rater agreement than less experienced ones. This was not the case with the comparison SPGR technique, which had poor sensitivity, only slight interrater reliability, and poor correlation between confidence and the correct diagnosis. These relationships held regardless of reader experience. Of the brain regions evaluated on CASL, the frontal lobes demonstrated the most effective diagnostic utility for the identification of AD. This study was the first step to test the possible use in clinical practice of a new MR imaging method in early AD detection. The sensitivity, specificity, and accuracy with CASL was similar to those of clinical dementia evaluations without MR imaging that were confirmed with 3 years of follow-up and repeat cognitive testing.54 The sensitivity of the visual ratings for AD was similar, though slightly lower, to that seen in research settings by using FDG-PET.6,55 In the context of these studies, unlike most SPECT and PET images used in clinical practice, CASL MR images are atrophy-corrected. Consequently, the reduced perfusion observed is likely to be a primary hypoperfusion and not secondary to volume loss. In the context of these studies and given the improved safety CASL MR imaging offers relative to PET and SPECT, our results justify further studies comparing CASL with those modalities. Of particular interest is the finding that the frontal lobes were the most diagnostically useful of the 9 regions evaluated by the readers and improved the overall sensitivity, specificity, and accuracy of CASL for the classification of AD versus normal cognition. There are several potential reasons why the frontal lobes were the most diagnostically effective. One possible explanation is that these large brain areas are particularly identifiable on CASL, thus making it easier for readers to determine lower rCBF visually. Additionally, the frontal lobes are often affected in AD as demonstrated in both perfusion11,13,23 and PET amyloid imaging studies.56,57 The fre852
Raji 兩 AJNR 31 兩 May 2010 兩 www.ajnr.org
Reader 3 (%) Parietal cortex (100) Frontal lobes (92) Thalamus (83) Medial temporal lobe (75) Caudate (67) Lentiform (67) Precuneus (33) Anterior cingulate (25) Posterior cingulate (25)
Reader 4 (%) Frontal lobes (100) Caudate (100) Lentiform (100) Thalamus (85) Parietal cortex (85) Precuneus (77) Posterior cingulate (77) Anterior cingulate (69) Medial temporal lobe (38)
quent visual identification on CASL of lower rCBF in the caudate by the readers also mirrors results from prior PET studies showing substantial amyloid deposition in that region.49,58 While it is tempting to speculate that lower rCBF shown with CASL may reflect the consequences of underlying amyloid pathology in the brain, this would have to be confirmed with future work that combined both modalities in the same subjects. It is also notable that the findings of these CASL and PET amyloid imaging studies differ from those of prior FDG-PET work that demonstrated a temporal-parietal pattern of hypometabolism.6 Such technique-specific differences warrant additional investigation. False-positive errors occurred with CASL imaging in our study. Over half of these errors were in subjects who were adjudicated as cognitively normal at the time of scanning but who progressed to an altered cognitive state during the 5-year follow-up period. While it may be possible that CASL can detect presymptomatic AD changes, a definitive conclusion will require additional future studies to confirm this exploratory analysis. There are several reasons why hypoperfusion patterns could appear on CASL neuroimaging that do not involve a neurodegenerative process. Global patterns of hypoperfusion can be secondary to low cardiac output and vasospasm,59 while focal patterns of hypoperfusion can be due to ischemia and leukoaraiosis. Because levels of vascular disease were equivalent between groups and no subjects with carotid stenosis were included in this study, it is unlikely that these factors were the cause of the false-positive errors. Also, there was no association between false-positive readings and hypertension, MR imaging infarcts, heart disease, or type II diabetes mellitus. With differences in rCBF between hypertensive and normotensive subjects identified through CASL MR imaging,39 the use of CASL in the diagnosis of AD would ideally entail knowledge of vascular disease status. Because these are factors that are routinely evaluated during a dementia work-up, close communication between neuroradiologists and other clinicians will be necessary to ensure that such conditions are taken into consideration when evaluating CASL scans. In contrast to CASL, visual assessments of the SPGRs were not useful for the diagnosis of AD due to the poorer sensitivity of SPGR. Average specificity with SPGR would be even lower if reader 3, with a 100% value, was not included. The variation in SPGR sensitivity from 8% to 85% across all readers also makes this technique undesirable for early AD detection. Thus, while SPGR retains usefulness for ruling out other causes of dementia, it remains a less desirable screening tool for identifying subjects who are very early in their disease.
Table 5: Correlation between reader confidence and correct image classification Modality CASL SPGR
Reader 1 r ⫽ 0.46, P ⫽ .008 r ⫽ 0.16, P ⫽ .39
Reader 2 r ⫽ 0.44, P ⫽ .01 r ⫽ 0.32, P ⫽ .07
There are 2 issues to consider regarding visual assessments of structural images. First, our raters were asked to determine the presence of AD on the basis of their best impression of multiple brain areas, which is close to actual clinical practice. This is different from research-level visual rating scales, which have been shown to be useful in differentiating healthy subjects from those with early AD but tend to focus on 1 coronal section of the mesial temporal lobe.60,61 Second, the difference in sensitivity between our structural and perfusion images is likely due to the fact that alterations in brain function— reflected by reduced perfusion— generally precede structural brain changes.42 Given that the subjects in this study had yet to present for a clinical evaluation of their mental status, the extent of structural change may simply have been too mild to be detected by visual ratings. In analyzing our inter-rater agreements, we chose to dichotomize the results in terms of reader experience, with 2 of our readers being relatively more experienced and the other 2 being comparatively less experienced. Prior radiologic studies have shown that the reliability of an imaging study can be affected by reader experience.62,63 By studying inter-rater agreement by experience, we found that the reliability of CASL was statistically significant, regardless of whether the readers were more experienced ( ⫽ 0.70, P ⬍ .001) or less experienced ( ⫽ 0.54, P ⫽ .002). This point has relevance to daily clinical practice and pertinence in any training of novice neuroradiologists in the application of perfusion MR imaging to the identification of AD. Our CASL criteria by using simple visual examinations of the brain regions commonly affected by AD pathology demonstrate good screening test qualities with 85% sensitivity, which increased to 88% when using only the frontal lobe findings. Region-by-region quantification of rCBF values, while desirable and potentially informative, is time-consuming and less feasible in daily clinical practice. The same constraints apply to quantitative morphometry of structural brain scans: No uniform consensus exists regarding hippocampal volume cutoffs for dementia classification and such analyses are timeintensive, computationally demanding, and thus undesirable in clinical practice.64 Future work will further refine the utility and practicality of these automated methods such that they may eventually be used in routine clinical work. The main strength of this study was a well-characterized community cohort with longitudinal follow-up data. By drawing from the community, the CHS-CS minimizes the referral biases that often pervade studies of subjects in specialty memory disorder clinics. However, as with many epidemiologic investigations of the elderly, a survivor bias exists in that subjects with substantial health burdens such as heart disease may not live long enough to be studied. Another disadvantage of this study was the relatively small sample size, which limits the extent to which these results can be generalized to the overall population. Future studies can reduce this drawback by including greater numbers of controls and subjects with AD.
Reader 3 r ⫽ 0.34, P ⫽ .06 r ⫽ ⫺0.14, P ⫽ .45
Reader 4 r ⫽ 0.42, P ⫽ .02 r ⫽ ⫺0.16, P ⫽ .36
Another caveat in using CASL imaging is the substantial intersubject variation of ⱕ20%, which has been reported in prior literature, because this can confound group comparisons of AD and normal cognition.13 While this limitation is typically controlled for in group studies, it was not a focus of our work because we used reader-based visual ratings of individual scans. Overall, this study highlights the diagnostic potential of CASL in identifying AD. Because perfusion abnormalities can precede atrophy in AD,65 CASL MR imaging may permit earlier detection of the disease than would be possible with structural imaging alone. Conclusions CASL MR imaging demonstrated substantial diagnostic utility in the classification of AD-versus-control brains with 85% sensitivity, which increased to 88% when focusing on visual identifications of reduced frontal lobe perfusion. Thus, CASL MR imaging may be a useful addition to the clinical classification of AD. Acknowledgments C.A.R. acknowledges Anne G. Osborn, MD, of the University of Utah for her support and mentorship on this project. A full list of participating CHS investigators and institutions is available at: www.chs-nhlbi.org. Appendix A: CASL Reader Criteria Is the gray matter cortex thinned, Y N (circle 1)? Are there focal gaps in the cortex, Y N (circle 1)? Is there a decrease in size of the basal ganglia (thalamus, caudate, lentiform), Y N (circle 1)? Check off if you observed fewer/absent bright spots in the following areas and answer adjacent laterality questions. If bright spots were noted bilaterally, do not checkmark. ● ● ● ● ● ● ● ● ● ●
Posterior cingulate (bilateral, circle 1: L ⬎ R, L ⬍ R, L ⫽ R). Unilateral: L or R? Anterior cingulate (bilateral, circle 1: L ⬎ R, L ⬍ R, L ⫽ R). Unilateral: L or R? Precuneus (bilateral, circle 1: L ⬎ R, L ⬍ R, L ⫽ R). Unilateral: L or R? Medial temporal lobe (bilateral, circle 1: L ⬎ R, L ⬍ R, L ⫽ R). Unilateral: L or R? Thalamus (bilateral, circle 1: L ⬎ R, L ⬍ R, L ⫽ R). Unilateral: L or R? Caudate (bilateral, circle 1: L ⬎ R, L ⬍ R, L ⫽ R). Unilateral: L or R? Lentiform (bilateral, circle 1: L ⬎ R, L ⬍ R, L ⫽ R). Unilateral: L or R? Parietal cortex (bilateral, circle 1: L ⬎ R, L ⬍ R, L ⫽ R). Unilateral: L or R? Frontal lobes (bilateral, circle 1: L ⬎ R, L ⬍ R, L ⫽ R). Unilateral: L or R? Final classification: normal or abnormal (circle 1) AJNR Am J Neuroradiol 31:847–55 兩 May 2010 兩 www.ajnr.org
853
I am confident in my final classification on the basis of the perfusion CASL MR imaging (circle 1): 1) Strongly disagree. 2) Disagree. 3) Neither agree nor disagree. 4) Agree. 5) Strongly agree. Appendix B: SPGR Volume Loss Reader Criteria Subject Age: Brain volume and sulcal width appropriate for subject age, Y or N (circle 1)? Check off if the following areas showed volume loss and or expansion of ventricles. If volume loss or expansion was not noted in these areas, do not checkmark them.
14. 15. 16.
17.
18.
19. 20. 21. 22.
● ● ● ● ● ● ● ●
Parietal cortex Frontal cortex Temporal cortex Occipital cortex Hippocampus/temporal horns Lateral ventricle Third ventricle Final classification: normal or abnormal (circle 1)
I am confident in my final classification on the basis of the T1 volumetric SPGR scan (circle 1): 1) Strongly disagree. 2) Disagree. 3) Neither agree nor disagree. 4) Agree. 5) Strongly agree.
23.
24.
25.
26.
27.
28.
29.
References 1. Sloane PD, Zimmerman S, Suchindran C, et al. The public health impact of Alzheimer’s disease, 2000 –2050: potential implication of treatment advances. Annu Rev Public Health 2002;23:213–31 2. Frisoni GB, Testa C, Sabattoli F, et al. Structural correlates of early and late onset Alzheimer’s disease: voxel based morphometric study. J Neurol Neurosurg Psychiatry 2005;76:112–14 3. Ohnishi T, Matsuda H, Tabira T, et al. Changes in brain morphology in Alzheimer disease and normal aging: is Alzheimer disease an exaggerated aging process? AJNR Am J Neuroradiol 2001;22:1680 – 85 4. Knopman DS, DeKosky ST, Cummings JL, et al. Practice parameter: diagnosis of dementia (an evidence-based review)—report of the Quality Standards Subcommittee of the American Academy of Neurology. Neurology 2001;56: 1143–53 5. Karas GB, Burton EJ, Rombouts SA, et al. A comprehensive study of gray matter loss in patients with Alzheimer’s disease using optimized voxel-based morphometry. Neuroimage 2003;18:895–907 6. Silverman DH, Small GW, Chang CY, et al. Positron emission tomography in evaluation of dementia: regional brain metabolism and long-term outcome. JAMA 2001;286:2120 –27 7. Jagust WJ, Johnson KA, Holman BL. SPECT perfusion imaging in the diagnosis of dementia. J Neuroimaging 1995;5:S45–S52 8. Detre JA, Leigh JS, Williams DS, et al. Perfusion imaging. Magn Reson Med 1992;23:37– 45 9. Detre JA, Alsop DC, Vives LR, et al. Noninvasive MRI evaluation of cerebral blood flow in cerebrovascular disease. Neurology 1998;50:633– 41 10. Ye FQ, Berman KF. H215O PET validation of steady-state arterial spin tagging cerebral blood flow measurements in humans. Magn Reson Med 2000;44: 450 –56 11. Alsop DC, Detre JA, Grossman M. Assessment of cerebral blood flow in Alzheimer’s disease by spin-labeled magnetic resonance imaging. Ann Neurol 2000;47:93–100 12. Du AT, Jahng GH, Hayasaka S, et al. Hypoperfusion in frontotemporal dementia and Alzheimer disease by arterial spin labeling MRI. Neurology 2006;67: 1215–20 13. Johnson NA, Jahng G-H, Weiner MW, et al. Pattern of cerebral hypoperfusion
854
Raji 兩 AJNR 31 兩 May 2010 兩 www.ajnr.org
30. 31.
32.
33. 34.
35. 36. 37. 38.
39.
40. 41.
42.
43.
in Alzheimer disease and mild cognitive impairment measured with arterial spin-labeling MR imaging: initial experience. Radiology 2005;234:851–59 Alsop DC, Casement M, de Bazelaire C, et al. Hippocampal hyperperfusion in Alzheimer’s disease. Neuroimage 2008;42:1267–74 Jagust WJ. Neuroimaging in dementia. Neurol Clin 2000;18:885–902 Claus JJ, van Harskamp F, Breteler MM, et al. The diagnostic value of SPECT with Tc 99m HMPAO in Alzheimer’s disease: a population-based study. Neurology 1994;44:454 – 61 Powers WJ, Perlmutter JS, Videen TO, et al. Blinded clinical evaluation of positron emission tomography for diagnosis of probable Alzheimer’s disease. Neurology 1992;42:765–70 Lopez OL, Becker JT, Jagust WJ, et al. Neuropsychological characteristics of mild cognitive impairment subgroups. J Neurol Neurosurg Psychiatry 2006;77: 159 – 65 Kuller LH, Lopez OL, Jagust WJ, et al. Determinants of vascular dementia in the Cardiovascular Health Cognition Study. Neurology 2005;64:1548 –52 Fried LP, Borhani NO, Enright P, et al. The Cardiovascular Health Study: design and rationale. Ann Epidemiol 1991;1:263–76 Lopez OL, Kuller LH, Fitzpatrick A, et al. Evaluations of dementia in the Cardiovascular Health Cognition Study. Neuroepidemiology 2003;22:1–12 Lopez OL, Jagust WJ, DeKosky ST, et al. Prevalence and classification of mild cognitive impairment in the Cardiovascular Health Study Cognition Study: part 1. Arch Neurology 2003;60:1385– 89 Dai W, Lopez OL, Carmichael OT, et al. Mild cognitive impairment and Alzheimer disease: patterns of altered cerebral blood flow at MR imaging. Radiology 2009;250:856 – 66 McKhann G, Drachman DA, Folstein MF, et al. Clinical diagnosis of Alzheimer’s disease: report of the NINCDS-ADRDA Work Group under the auspices of the Department of Health and Human Services Task Force on Alzheimer’s disease. Neurology 1984;34:939 – 44 Manolio TA, Kronmal RA, Burke GL, et al. Magnetic resonance abnormalities and cardiovascular disease in older adults: the Cardiovascular Health Study. Stroke 1994;25:318 –27 O’Leary DH, Polak JF, Kronmal RA, et al. Carotid-artery intima and media thickness as a risk factor for myocardial infarction and stroke in older adults: Cardiovascular Health Study Collaborative Research Group. N Engl J Med 1999;340:14 –22 Laurienti PJ, Field AS, Burdette JH, et al. Relationship between caffeine-induced changes in resting cerebral perfusion and blood oxygenation level-dependent signal. AJNR Am J Neuroradiol 2003;24:1607–11 Yue NC, Arnold AM, Longstreth WT, et al. Sulcal, ventricular, and white matter changes at MR imaging in the aging brain: data from the Cardiovascular Health Study. Radiology 1997;202:33–39 Bryan RN, Wells SW, Miller TJ, et al. Infarctlike lesions in the brain: prevalence and anatomic characteristics at MR imaging of the elderly— data from the Cardiovascular Health Study. Radiology 1997;202:47–54 Bernick C, Kuller L, Dulberg C, et al. Silent MRI infarcts and the risk of future stroke: the Cardiovascular Health Study. Neurology 2001;57:1222–29 Longstreth WT, Manolio TA, Arnold A, et al. Clinical correlates of white matter findings on cranial magnetic resonance imaging of 3301 elderly people. Stroke 1996;27:1274 – 82 Longstreth WT, Bernick C, Manolio TA, et al. Lacunar infarcts defined by magnetic resonance imaging of 3660 elderly people. Arch Neurol 1998;55:1217–25 Teng EL, Chui HC. The Modified Mini-Mental State (3MS) examination. J Clin Psychiatry 1987;48:314 –18 Graham JE, Rockwood K, Beattie BL. Prevalence and severity of cognitive impairment with and without dementia in an elderly population. Lancet 1997; 349: 1793–96 Alsop DC, Detre JA. Multisection cerebral blood flow MR imaging with continuous arterial spin labeling. Radiology 1998;208:410 –16 Gach HM, Dai W. Simple model of double adiabatic inversion (DAI) efficiency. Magn Reson Med 2004;52:941– 46 Dai W. Advancements in Quantitative Perfusion Magnetic Resonance Imaging (MRI) of Dementia [dissertation]. Pittsburgh: University of Pittsburgh; 2006 Buxton RB, Frank LR, Wong EC, et al. A general kinetic model for quantitative perfusion imaging with arterial spin labeling. Magn Reson Med 1998;40: 383–96 Dai W, Lopez OL, Carmichael OT, et al. Abnormal regional cerebral blood flow in cognitively normal elderly subjects with hypertension. Stroke 2008;39: 349 –54 Chen M. 3-D Deformable Registration Using a Statistical Atlas with Applications in Medicine [dissertation]. Pittsburgh: Carnegie Mellon University; 1999 Meltzer CC, Cantwell MN, Greer PJ, et al. Does cerebral blood flow decline in healthy aging? A PET study with partial-volume correction. J Nucl Med 2000; 41:1842– 48 Prince SE, Woo S, Doraiswamy PM, et al. Functional MRI in the early diagnosis of Alzheimer’s disease: is it time to refocus? Expert Rev Neurother 2008;8: 169 –75 Bryan RN, Manolio TA, Scertz LD, et al. A method for using MR to evaluate the
44. 45. 46. 47.
48. 49.
50. 51. 52. 53.
54.
55.
effects of cardiovascular disease on the brain: the Cardiovascular Health Study. AJNR Am J Neuroradiol 1994;15:1625–33 Braak H, Braak E. Neuropathological stageing of Alzheimer-related changes. Acta Neuropathol 1991;82:239 –59 Jack CR, Petersen RC, Xu YC, et al. Medial temporal atrophy on MRI in normal aging and very mild Alzheimer’s disease. Neurology 1997;49:786 –94 Jack CR Jr, Petersen RC, Xu Y, et al. Rate of medial temporal lobe atrophy in typical aging and Alzheimer’s disease. Neurology 1998;51:993–99 Lee C, Lopez OL, Becker JT, et al. Imaging cerebral blood flow in the cognitively normal aging brain with arterial spin labeling: implications for imaging of neurodegenerative disease. J Neuroimaging 2009;19:344 –52. Epub 2009 Mar 9 Komorita SS. Attitude content, intensity, and the neutral point on a Likert scale. J Soc Psychol 1963;61:327–34 Jack CR Jr, Lowe VJ, Senjem ML, et al. 11C PiB and structural MRI provide complementary information in imaging of Alzheimer’s disease and amnestic mild cognitive impairment. Brain 2008;131(pt 3):665– 80. Epub 2008 Feb 7 Landis JR, Koch GG. The measurement of observer agreement for categorical data. Biometrics 1977;33:159 –74 Lopez OL, Kuller LH, Becker JT, et al. Incidence of dementia in mild cognitive impairment in the Cardiovascular Health Study. Arch Neurol 2007;64:416 –20 Petersen RC, Smith GE, Waring SC, et al. Mild cognitive impairment: clinical characterization and outcome. Arch Neurol 1999;56:303– 08 Roberts DA, Detre JA, Bolinger L, et al. Quantitative magnetic resonance imaging of human brain perfusion at 1.5T using steady state inversion of arterial water. Proc Natl Acad Sci U S A 1994;91:33–37 Silverman DH, Gambhir SS, Huang HW, et al. Evaluating early dementia with and without assessment of regional cerebral metabolism by PET: a comparison of predicted costs and benefits. J Nucl Med 2002;43:253– 66 McNeill R, Sare GM, Manoharan M, et al. Accuracy of single-photon emission
56. 57.
58.
59.
60.
61. 62.
63.
64.
65.
computed tomography in differentiating frontotemporal dementia from Alzheimer’s disease. J Neurol Neurosurg Psychiatry 2007;78:350 –55 Klunk WE, Engler H, Nordberg A, et al. Imaging brain amyloid in Alzheimer’s disease with Pittsburgh Compond-B. Ann Neurol 2004;55:306 –19 Buckner RL, Snyder AZ, Shannon BJ, et al. Molecular, structural, and functional characterization of Alzheimer’s disease: evidence for a relationship between default activity, amyloid, and memory. J Neurosci 2005;25:7709 –17 Mintun MA, Larossa GN, Sheline YI, et al. [11C]PIB in a nondemented population: potential antecedent marker of Alzheimer disease. Neurology 2006;67:446 –52 Deibler AR, Pollock JM, Kraft RA, et al. Arterial spin-labeling in routine clinical practice. Part 2. Hypoperfusion patterns. AJNR Am J Neuroradiol 2008;29: 1235– 41 Scheltens P, Leys D, Barkhof F, et al. Atrophy of medial temporal lobes on MRI in “probable” Alzheimer’s disease and normal ageing: diagnostic value and neuropsychological correlates. J Neurol Neurosurg Psychiatry 1992;55:967–72 Duara R, Loewenstein DA, Potter E, et al. Medial temporal lobe atrophy on MRI scans and the diagnosis of Alzheimer disease. Neurology 2008;71:1986 –92 Aviv RI, Shelef I, Malam S, et al. Early stroke detection and extent: impact of experience and the role of computed tomography angiography source images. Clin Radiol 2007;62:447–52 Barber PA, Demchuk AM, Zhang J, et al. Validity and reliability of a quantitative computed tomography score in predicting outcome of hyperacute stroke before thrombolytic therapy: ASPECTS Study Group—Alberta Stroke Programme Early CT Score. Lancet 2000;355:1670 –74 Bozzali M, Cercignani M, Caltagirone C. Brain volumetrics to investigate aging and the principal forms of degenerative cognitive decline: a brief review. Magn Reson Imaging 2008;26:1065–70 Bonte FJ, Weiner MF, Bigio EH, et al. Brain blood flow in the dementias: SPECT with histopathologic correlation in 54 patients. Radiology 1997;202: 793–97
AJNR Am J Neuroradiol 31:847–55 兩 May 2010 兩 www.ajnr.org
855