Int. J. Networking and Virtual Organisations, Vol. 4, No. 4, 2007
Innovation team networks: the centrality of innovativeness and efficiency Roger Th.A.J. Leenders*, Jan Kratzer and Jo M.L. van Engelen Department of Innovation Management & Strategy Faculty of Business and Economics University of Groningen Landleven 5, 9747 AD Groningen, the Netherlands Fax: +31 50 3632330 E-mail:
[email protected] E-mail:
[email protected] E-mail:
[email protected] *Corresponding author Abstract: In this article we employ Social Network Analysis (SNA) to study the performance of new product teams that are part of an international innovation network. We are interested in explaining why some teams are exceedingly innovative but not efficient, whereas others excel in efficiency but stumble on innovativeness. We compare two teams that are very similar in task, background and skill. Using SNA we find that both teams are equally present on the shortest communication paths, but the innovative team has a much stronger presence on alternative communication paths as well. This provides it with many different sources and types of knowledge. The highly efficient team is strongly connected to well-connected knowledgeable others. It can thus efficiently tap relevant information. The article shows that SNA techniques are useful in uncovering network positions and in understanding the differential levels of performance of otherwise comparable teams. Keywords: innovativeness; efficiency; performance; teams; R&D; Social Network Analysis; SNA; centrality; betweenness; knowledge sharing; communication. Reference to this paper should be made as follows: Leenders, R.Th.A.J., Kratzer, J. and van Engelen, J.M.L. (2007) ‘Innovation team networks: the centrality of innovativeness and efficiency’, Int. J. Networking and Virtual Organisations, Vol. 4, No. 4, pp.459–478. Biographical notes: Dr. Roger Th.A.J. Leenders is a Professor of Networks in Market and Product Innovation at the Faculty of Business and Economics of the University of Groningen, the Netherlands. Much of his research centres on various aspects of the performance of NPD teams and NPD organisation, with a special interest in the effects of virtuality. In addition, he has two further active lines of research on social capital and on the modelling of social influence in networks. His recent work has appeared in, among others, the Journal of Product Innovation Management, Social Networks, Creativity and Innovation Management, Journal of Engineering and Technology Management, PDMA Toolbook for New Product Development, and Team Performance Management. He has also (co-)authored and edited four books.
Copyright © 2007 Inderscience Enterprises Ltd.
459
460
R.Th.A.J. Leenders, J. Kratzer and J.M.L. van Engelen Dr. Jan Kratzer is an Associate Professor of Business Development at the Faculty of Business and Economics of the University of Groningen, the Netherlands. His research is mainly on the communication patterns within NPD teams, the effects of virtuality and the development of social network measures. He also studies organisational innovation networks and communities of practice. Jan has (co-)authored two books. Professor Jo M.L. van Engelen is a Professor of Business Development and Professor of Business Research Methods at the Faculty of Business and Economics of the University of Groningen, the Netherlands. He is also a member of the executive board of ANWB (Dutch Automobile Club). His research focuses on the performance of NPD teams, on the implementation of market orientation in companies and on sustainability in NPD. One of his recent books is Knowledge Creation and Sustainable Innovation (2004), with René Jorna.
1
Introduction
Companies spend considerable effort on developing new product and service offerings. It is not uncommon for companies to spend 20% (or more) of the overall budget on innovative endeavours. Shortening life cycles, increased competition, increased customer requirements, developing technology and globalisation of markets are often put forward as (interrelated) reasons for the need to continuously innovate the products and services companies bring to the market (Belliveau et al., 2002; Rosenau et al., 1996; Belliveau et al., 2004). Regardless of the various innovation drivers, companies invest heavily in innovative activity. As a consequence, its success – or lack thereof – can have a great effect on company achievement. While there are many factors driving the innovative performance of firms, perhaps the foremost factor is the functioning of the new product team. By and large, companies organise their product innovation endeavours in multidisciplinary teams (Griffin, 1997; Van Engelen et al., 2001). Such cross-functional teams are indispensable because modern product development requires both increasingly deepening technical knowledge (depth) and the combination of different kinds of expertise (breadth). In this article we study the effects of network position on teams in an international innovation network. While the strength of a new product team is in combining, integrating and organising varied sets of knowledge, this is also its weakness. If communication between knowledge bearers does not flow smoothly, the innovative performance of the team likely falters. To date, little work has been conducted addressing the kinds and patterns of communication that make new product teams more or less innovative. Existing research specifically focusing on communication effects on the innovative performance of new product teams includes the work by Allen (1969; 1971; 1977), Katz (1997), Kratzer (2001), Kratzer et al. (2005a), Leenders et al. (2002; 2003; 2007b) and Nemiro (2000; 2002). There is a large body of empirical work that deals with the question of what makes individuals more innovative. Although these studies can be very informative, they do not address the question of what makes teams innovative. Since recent research shows that the innovative performance of individuals does not necessarily aggregate to the
Innovation team networks: the centrality of innovativeness and efficiency
461
innovative performance of teams (Kratzer et al., 2005a; Gilson and Shalley, 2004; Pirola-Merlo and Mann, 2004; Shalley et al., 2004; Taggar, 2002), it is unclear to what extent such literature can be used to guide the study of new product teams. In this article we take a social network approach to understanding how new product teams perform. In particular, we will study teams that are part of an international innovation network. The teams in the network together are developing a highly advanced high-tech instrument to be used in space research. Each team has its own task, but the overall task is finished only when all teams are finished and the product as a whole functions according to specifications. As a result, together the teams form a network organisation. In this network, it is largely knowledge and information that are shared. Teams keep each other abreast of technological developments, advances and changes in the project as a whole, and discuss technical problems. The flow of knowledge and information is sometimes unidirectional (one team providing another team with knowledge) and sometimes reciprocal (both teams exchanging knowledge and information with each other – although not necessarily on the same topics). Moreover, some teams send more information than they receive, either in volume or frequency. Since each team in the network has a clearly defined task of its own, it is possible to assess the performance of individual teams. Some teams are clearly more creative and innovative than others. At the same time, some teams clearly outperform in efficiency: being able to stay within time and budget easily, while developing solutions that fit predefined specifications. In this article, we will contrast the knowledge ties of a highly creative team with that of a highly efficient team. Although some literature suggests that the network structures that support teams in their innovative endeavour are different from those supportive of highly efficient teams, the literature does not offer much guidance as to exactly how these networks differ. In this article we will therefore embark on an exploratory analysis, contrasting the network positions of two teams that widely differ on the basis of their performance: one very innovative, one very efficient. Such an analysis should support the development of appropriate theory, allowing researchers to improve extant theory on the effect of social networks on team-level performance. The article is structured as follows. First, we will briefly discuss the importance of knowledge networks to the performance of new product teams. Then we will give a brief description of the data that will be used in this exploratory study. The main part of the paper will contain a description of several measures of network structure; these will be introduced and then applied to the two teams central in our study. In particular, we will focus on four measures of network centrality. These measures are well suited for capturing the differential positions of the teams in the network’s flow of knowledge and information. Finally, we will draw conclusions and provide a discussion of the findings. As a caveat, note that it is beyond the purpose of this article to discuss the intricacies of the concepts of ‘knowledge’ and ‘information’. We will simply talk about the exchange of ‘knowledge and information’ and will sometimes only mention either ‘knowledge’ or ‘information’ in order for the sentences not to become overly repetitive. In addition, we will frequently use the terms ‘innovativeness’ and ‘creativity’ interchangeably, as they are closely related (West and Farr, 1990a–b) and we want to avoid long-winded sentences.
462
2
R.Th.A.J. Leenders, J. Kratzer and J.M.L. van Engelen
Communication and the performance of new product teams
Teams have become the building block of modern new product activity. Several reasons underlie this development. First, the development of new products often involves the concerted input of professionals with various areas and levels of expertise. New products may also involve in-depth knowledge of specific technical issues; for example, it is immediately clear that in the development of a new plane, satellite, photo camera, or a hard disk drive, many engineers with widely different specialisations are involved. Teams are put together for a good reason: they are required when no one person possesses all of the required knowledge, skill, time, influence and oversight to develop the new product alone. As the development task grows, the project is generally decomposed into smaller tasks; such smaller tasks can be performed relatively separately from the others (Leenders et al., 2002; 2007b; Simon, 1969; Dym, 1994; Dym and Little, 2000). Resulting from such decomposition is a network of teams – each responsible for its own task and together responsible for the new product task as a whole. The core product in new product development is knowledge, and teams create knowledge through interaction. Through effective communication, building on the knowledge of others, teams exchange information and create new knowledge and insight (Csikszentmihalyi and Sawyer, 1995; DeMeyer, 1985; Moenaert et al., 2000; Sethia, 1995; Bakker et al., 2006). Communication can therefore be considered the vessel by which teams manage knowledge and information. In order for the team to be creative and to devise novel and useable solutions to technical and commercial problems, cross-fertilisation of ideas is essential; this happens through interaction (Mumford and Gustafson, 1988). Through consultation and interaction, teams are likely to anticipate and prevent potential weaknesses in technical and marketing solutions. In other words, interteam communication provides the logistics through which knowledge is accessed, travels between teams, and can be combined into new knowledge and insight. The innovative performance of a new product team thus depends on the team’s communication effectiveness; new product teams that do not communicate effectively are unlikely to be able to generate novel and feasible solutions to the multifaceted complex problems they are faced with. New product project teams face pressure to reduce cycle time and development costs, without sacrificing innovation (McDonough et al., 1999). On the one hand, teams that are part of a new product effort that has the objective of developing a radically new product – or where the design of the new product requires the development of largely new knowledge and currently nonexisting technical solutions – are required to both be able to come up with novel solutions (displaying creativity) and stay within budget and time as well (displaying efficiency). Regardless, these novel solutions should all be within the predefined specification. The requirement of, on the one hand, developing something entirely new and feasible and, on the other hand, staying within budget and tight time schedules requires teams to do the splits. In its true form, creative performance requires free thinking, divergent thinking processes, lack of deadlines, the consideration of a large solution space, freedom, and being unbound by previous decisions, solutions and direction (Leenders et al., 2004; 2007b; Csikszentmihalyi and Sawyer, 1995; Amabile, 1983; 1988; 1996; Hennessey et al., 1990; Kratzer et al., 2005b; Agrell et al., 1996; Andriopoulis, 2001; Andriopoulis and Lowe, 2000; Barrett, 1998; Csikszentmihalyi, 1996). On the other hand, staying within budget and time requires much more systematic
Innovation team networks: the centrality of innovativeness and efficiency
463
thinking, convergent thinking processes, tight planning, the consideration of a small and clearly demarcated solution space, conformity and adherence to previous decisions (Leenders et al., 2007b; Cooper, 1990; 1995; 1996; Gersick, 1994; Adler et al., 1999; Edwards, 2000; Wheelwright and Clarke, 1992). Even without discussing specific network structures, it is immediately clear that exceptional innovative performance is supported by different structures of communication more than extraordinary accomplishment on efficiency is. Below we will describe some of the network structures maintained by two teams – one exceptionally able at developing novel solutions (but below average at staying within time and budget), the other extraordinarily apt at easily and consistently performing within time and budget constraints (but below average in the creative level of its output).
3
Dataset
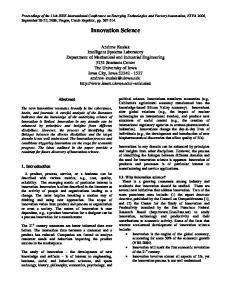
In this article we study two teams that are part of an international innovation network. In this network new technology for space research is developed. Although the teams work on different – but related – development tasks, the teams share important characteristics. They are both involved in precision engineering, allowing for only exceptionally small tolerances, involving cryogenic technology and high-resolution optics. They have in common that their output has to conform to exceedingly deeply specified requirements. The teams each developed a small part of a satellite. Most of the requirements the teams work with are considered critical and do not allow the team to develop solutions that even marginally deviate from the specifications. Any deviation, regardless of how minute, has an immediate and pervasive effect on the adjacent component, and thus affects the viability and integrity of the component developed by another team somewhere else in the world. As a consequence, the teams are strongly output driven. They are free to develop almost any technology, as long as it meets the strict output specification. The teams truly work on the boundaries of what is currently known and possible and are often required to push boundaries further. A great amount of creativity is required of all teams, while, simultaneously, clear and strict time and budget constraints have to be met. Although these requirements for creativity and efficiency were similar for all teams in the innovation network, some teams clearly were creative outperformers whereas some others noticeably outperformed on efficiency. In this article we compare the networks of two such obvious outperformers – one team highly creative but lacking in efficiency, the other excellently efficient but deficient in its creative performance. Given the similarity in task, task environment, team tenure and skill level, many of these differences are likely to reside in the social interaction patterns of the two teams. As we will show, the network ties maintained by the teams vary quite strongly. In order to uncover the interaction structure in the network, we interviewed both the innovation network management and the leaders of the various teams about the communication among the teams in the network. The resulting network is shown in Figure 1. A tie between two teams represents at least weekly communication between the two teams. If the interaction between two teams is mainly unidirectional, the arrowheads depict this direction. For example, the communication between team 11 and team 12 largely occurs in the direction from team 11 to team 12. Most likely, team 11 keeps team 12 abreast of developments, knowledge and pertinent information regarding the new
464
R.Th.A.J. Leenders, J. Kratzer and J.M.L. van Engelen
product. Overall, there is a much more intense flow of knowledge and information from team 11 to team 12 than vice versa. Alternatively, the flow of communication between teams 6 and 7 is in balance; they both give about as often as they receive. Team 10 occupies a special position in the network: although it is part of the innovation network, it only communicates with the other teams sporadically. The communication is too infrequent to justify the existence of a tie between team 10 and the other teams. Since the cut-off point for the existence of a tie in the network is weekly communication, communication that occurs less frequently (e.g., once a month) does not show in the network. Figure 1
Communication network among the teams in the innovation network 4
10
6
3 7
9 8
5
14
17 1
2 15 13 16
11
12
The two teams we will focus on are teams 6 and 7. Team 6 is highly creative; it is generally seen as highly innovative in the sense of generating new ideas, methods, approaches, inventions or applications. Team 7, on the other hand, is generally seen as consistently completing its tasks on time and within budget, but at the same time scoring low on innovativeness. Team 6 scores low on staying within time and budget.
4
Network structures and team performance
Many different kinds of structures can be uncovered from social networks. The structures we will focus on are common indicators of network position, can easily be understood and form a logical basis for managerial action. The network structures we will consider belong to the group of ‘centrality’ measures. Centrality indicates how teams differ in their
Innovation team networks: the centrality of innovativeness and efficiency
465
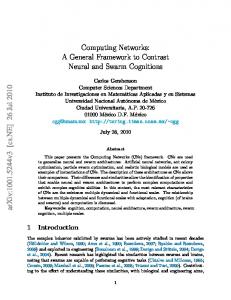
access to information and knowledge that flows through the network. Since such access potentially lends power to those who possess and control it, sociologists tend to consider centrality measures as indicators of power and prestige (Wasserman and Faust, 1994; Freeman, 1977; 1979; Freeman et al., 1979; 1991; Hage and Harary, 1995; White and Borgatti, 1994). As a result, in the literature centrality measures are frequently denoted as power measures (or measures of importance, prominence or status). Regardless, they measure differential access to information and knowledge of the teams in the innovation network – the topic of our study. Centrality captures the ‘location’ of an actor in the network. As far back as Moreno (1934), researchers have attempted to quantify the notions of sociometric ‘stars’ and ‘isolates’. Below we will discuss the most interesting definitions of centrality along with the operationalisations that the various definitions have spawned. We will discuss centrality based on Degree, Eigenvalue, Betweenness and Flow betweenness. These definitions yield actor indices that quantify the location of an individual actor embedded in the network. Such actor indices can also be aggregated over the network to obtain a single, network-level index that summarises the network of actors with respect to a given measure (Wasserman and Faust, 1994), which is then called measure of centralisation. Rather than describing the positional advantage of a given actor, centralisation denotes to which extent actors in the network as a whole differ in their centrality scores. In other words, centralisation is high when some actors are highly central and most others are not. Since the interest in the current article is on the difference in performance between two individual teams, we will consider centrality rather than centralisation. We will limit ourselves to describing the centrality measure without providing their mathematical formulae. The reader can easily calculate the measures by using one of the many available Social Network Analysis (SNA) software packages. For this paper we used the dedicated SNA package Ucinet 6 (Borgatti et al., 2002). When introducing the various centrality measures, we will apply them to three artificial network structures. These three structures nicely highlight the differences among the measures we will describe (Figure 2). These three networks, all containing seven actors, will be labelled star network (Figure 2a), circle network (Figure 2b) and line network (Figure 2c) (Freeman, 1980). In Figure 2 we depict both the graphical depiction of the network (left column) and the so-called adjacency matrix (right column). An adjacency matrix is a matrix containing 1’s and 0’s, depicting the presence or absence of a relation between two actors. A ‘1’ in cell [i,j] means that a tie is present from actor i to actor j; a 0 in that cell refers to the absence of that tie. The diagonal contains 0’s by definition. The 1 in cell [1,2] in the adjacency matrix of the star network thus means that a tie exists from actor 1 to actor 2. Since the tie is reciprocated, there is also a 1 in cell [2,1]. Since all ties in these three networks are reciprocated, the network can also be seen as undirected (i.e., there is no inherent asymmetric direction in the ties among the actors in the network; hence the absence of arrowheads in the network figures). Fully reciprocated or undirected networks are characterised by symmetric adjacency matrices (as can be seen in the right column of Figure 2).
466
R.Th.A.J. Leenders, J. Kratzer and J.M.L. van Engelen
Figure 2 a
Three exemplary network structures
Star network
2 3
7
0111111 1000000 1000000
1
1000000 1000000 1000000
6
4
1000000
4
0100001
5 b
Circle network
3 2 1010000 0101000 0010100
1
0001010
5
0000101 1000010
7 6 c
Line network 0100000 1010000 0101000
1
2
3
4
5
6
7
0010100 0001010 0000101 0000010
Innovation team networks: the centrality of innovativeness and efficiency
467
A quick glance at Figure 2 shows that the actors in the networks are quite different. For instance, all actors in the circle are interchangeable (from a network point of view) and hence should be equally central. In the line network, actor centrality increases from Actor 1 to Actor 2, with Actor 4 being the most central. Actors 1 and 7 are peripheral in this network. In Table 1 the centrality scores for each of the seven actors in the three networks are presented. Given the small and artificial nature of these three networks, the distribution of centrality is highly skewed as compared to ‘real’ social networks. Regardless, their archetypal structure helps to illuminate the different centrality measures. Table 1
Centrality scores for the three example networks Degree (indegree/outdegree)
Eigenvalue
Betweenness
Flow betweenness
Actor 1
6/6
.71
15
30
Actor 2
1/1
.29
0
0
Actor 3
1/1
.29
0
0
Actor 4
1/1
.29
0
0
Actor 5
1/1
.29
0
0
Actor 6
1/1
.29
0
0
Actor 7
1/1
.29
0
0
Actor 1
2/2
.38
3
15
Actor 2
2/2
.38
3
15
Actor 3
2/2
.38
3
15
Actor 4
2/2
.38
3
15
Actor 5
2/2
.38
3
15
Actor 6
2/2
.38
3
15
Actor 7
2/2
.38
3
15
Actor 1
1/1
.19
0
0
Actor 2
2/2
.35
5
10
Actor 3
2/2
.46
8
16
Actor 4
2/2
.50
9
18
Actor 5
2/2
.46
8
16
Actor 6
2/2
.35
5
10
Actor 7
1/1
.19
0
0
Star network
Circle network
Line network
Note:
Centrality measures can be standardised, but need not be. The scores in this table are nonstandardised; standardisation would produce different scores, but the order of centrality among the actors would remain identical.
468
R.Th.A.J. Leenders, J. Kratzer and J.M.L. van Engelen
4.1 Degree centrality Degree is the most straightforward description of the position of an actor in a network. An actor’s degree simply refers to the number of ties the actor maintains. Often a distinction is made between an actor’s indegree and outdegree. The indegree is the sum of all incoming ties. The outdegree measures the number of ties from the actor to others. In case of knowledge flowing through the network, the indegree represents the number of other actors the focal actor receives knowledge from; the outdegree indicates the number of actors the focal actor provides with knowledge. In an undirected network, indegree and outdegree are identical since every outgoing tie is matched by an incoming tie (and vice versa). An actor with an indegree (outdegree) larger than that of other actors is said to be more central than others in the knowledge-receiving (giving) network. This makes sense since this actor obviously is better connected to knowledge-providing (receiving) others than are actors with lower indegrees (outdegrees). Alternatively, indegree and outdegree can be added to obtain a prestige score. However, using this prestige score removes the analyst from the opportunity to distinguish between the directions of the knowledge flow. The three artificial networks provide clear-cut examples. In the star network, actor 1 is really at the core; it has degree 6. All others only have degree 1. In the circle all actors are equally (non-)central, all having the same degree (2). In the line network, degree centrality only distinguishes the actors on the edge of the network (Actors 1 and 7) from the rest. In terms of the number of relationships maintained, there is no difference between Actor 2 and Actor 4. In the team network, team 6 has an indegree of 2 and an outdegree of 5. This yields a prestige score of 7. Team 7 has an indegree of 1, an outdegree of 8 and a prestige score of 9. Given that there are 17 teams in the network, the maximum possible score for indegree or outdegree is 16. This means that team 7 provides 50% of the other 16 teams with information and knowledge. Team 6 does so for 30% of the teams. Both primarily send out knowledge to others. However, a directional tie does not mean that information and knowledge only flows in one direction. Although it does show that both teams give more than they receive, any knowledge-sharing activity in this network necessarily involves at least some bi-directional interaction. It therefore makes sense to consider the prestige score for both teams. The efficient team 7 is somewhat more central than the creative team 6, but differences appear to be small: 9 versus 7 out of 32. Even though they both perform well on different kinds of performance, both high performers are pretty well connected in the information- and knowledge-sharing network. In the network as a whole, team 6 scores average on degree, team 7 scores higher than that. This conforms to findings of research on intrateam networks; this research consistently reports that team members need a moderate level of communication for the team to be creative. Higher levels of communication generally are associated with falling creative performance (Kratzer, 2001; Leenders et al., 2003; Kratzer et al., 2005b). For efficiency purposes, higher levels of communication are likely to be beneficial, at least as long as they do not become so abundant as to distract members of teams from doing their work. It makes sense that similar effects govern creative versus efficient performance of teams in a team network.
Innovation team networks: the centrality of innovativeness and efficiency
469
4.2 Eigenvalue centrality Eigenvalue centrality (sometimes called ‘rank prestige’) is based on the thought that central (i.e., prestigious) actors may tend to be connected to other central (i.e., prestigious) actors. If one is surrounded by prestigious actors, one’s own prestige should also be high. In a knowledge-sharing network, if a team is directly related to other teams that have strong access to knowledge and information, the team’s own access to that knowledge and information should be high as well. If, alternatively, a team is connected to only peripheral actors (with very limited access to knowledge and information), then the team’s centrality in the knowledge network should be low as well. Sociologists often consider such centrality an indication of power: those actors are considered powerful who are directly connected to powerful others. The perceptive may notice that a by-product of the presence of such powerful mutually connected actors is that power tends to become concentrated among a happy few. As knowledge networks become increasingly centralised, a similar effect may happen by consolidating access to and availability of knowledge and information among a small set of actors who then act as a bridge to information-poor actors. In any case, eigenvalue centrality can be a powerful statistic in networks where access to knowledge and information is unevenly distributed. A star network (Figure 2) is an extreme example of this. In line with the previous argumentation, actor 1 has a much higher eigenvalue centrality than the others (Table 1). In the circle, all actors have equal grasp of the available knowledge; their centrality is the same. In the line network, middle actor 4 potentially has the most control. This actor has direct ties to the two next most central actors. As a result, centrality decreases the further actors are from the middle. Mathematically, these scores are typically interpreted as arising from a reciprocal process in which the centrality of each actor is proportional to the sum of the centralities of those actors to whom he or she is connected. This leads to a form of ‘infinite regress’: an actor’s centrality depends on the centrality of those the actor is connected to (generally in the sense of a tie existing from the others to the focal actor); but the prestige of those depends on the actors they are related to, and so forth. The mathematical solution is relatively straightforward; all proposed solutions revolve around computing the values of the first eigenvector of the adjacency matrix. The main difference between the methods is whether or not some sort of standardisation is applied (first or afterwards). In this article we employ Bonacich’s (1987) solution, which, in turn, is a normed version of the original eigenvalue centrality as proposed by Katz (1953). Bonacich’s eigenvalue centrality version is commonly applied in SNA and is implemented in most SNA software packages. For the two teams central to our study, we find that team 6 has a centrality score of 0.15 and team 7 has centrality 0.27. This makes team 7 one of the most central teams in the network with respect to this centrality measure and team 6 one of the lowest. The average among the teams in the network is 0.21. The eigenvalue centrality measure indicates that team 7 is at the heart of the knowledge- and information-sharing action. Active knowledge-sharing teams tend to be closely linked to team 7 and much less so with team 6. This could potentially be an indication that team 7 opts for knowledge quantity and team 6 chooses knowledge quality. However, without having more information on the actual details of the knowledge-sharing processes of these teams, this cannot be tested. These differences in centrality provide team 7 with two potential advantages over team 6: it has more potential control over the flow of knowledge and
470
R.Th.A.J. Leenders, J. Kratzer and J.M.L. van Engelen
information throughout the network and it has more ready access to available information. Although it is hard to imagine the benefit a new product team could draw from controlling the flow of knowledge through a network of collaborating teams (power is not an issue here), direct and active ties with many and important sources of knowledge and information do provide a new product team with timely access to pertinent information related to the new product task at hand. This should support the team’s ability to remain within budget and time schedule better than teams without such privileged access to sources of knowledge and information.
4.3 Betweenness centrality When two teams are not in direct communication, knowledge and information must flow between these teams through others. From the viewpoint of control and influence, those in-between teams have the potential to exert some control over the flow of knowledge between these two teams. For betweenness centrality the assumption is made that two actors tend to communicate with one another through the ‘shortest paths’ between them. For example, teams 3 and 8 are not directly linked to one another. But, since team 7 is directly tied to both of them, they can easily communicate through team 7. Information can also flow between them by using the path of teams 3-5-17-14-8, but this is clearly a much longer path. Especially in knowledge networks, longer paths are risky since knowledge can quickly become distorted along the way, even without the in-between teams doing so on purpose. Moreover, longer paths likely take longer to cross; knowledge flowing from one team to another over a longer path may be at risk of arriving late. Especially given the depth of knowledge involved in the development of complex new products, these risks are likely in the innovation network at hand: relayers of knowledge may become cognitively taxed (Shalley, 1995; Uzzi, 1996) and misinterpret the knowledge they have at their availability. This may cause them to relay false information (since the team did not understand the knowledge correctly) or not to relay knowledge that is important to another team (since the team had no idea it was of importance to be relayed) at all (or do so only partly). As a result, when given the choice, teams will generally opt for knowledge flows through the shortest paths possible. From this point of view, a team that is on many shortest paths connecting teams is highly central in the knowledge network. This ‘actor in the middle’ literally has high ‘betweenness’, hence the name of the measure. In the line network in Figure 2, actor 4 has the highest betweenness score. From a sociological point of view, such actors have the potential to exert control over the paths on which they are the go-between (Wasserman and Faust, 1994). Those on the edges of the paths do not have such potential control (Freeman, 1979; Friedkin, 1991). Besides betweenness being a source of power, others view it as a source of stress (Shaw, 1954; Shimbel, 1953); after all, the go-between has the responsibility of making sure knowledge passes on swiftly and correctly. For teams that need to dispatch much knowledge – either in volume or in frequency – betweenness can indeed become a burden, coming at the expense of less efficient team operation. On the other hand, presence on shortest paths between other teams does provide a team with first-hand knowledge and information. This is likely to keep the team abreast of the latest development, which should assist a team in being efficient. At the same time, high betweenness affords the team with exposure to knowledge that it might otherwise not immediately seek. It is exactly this kind of knowledge that often helps in creating new ideas; in other words, it may assist creativity.
Innovation team networks: the centrality of innovativeness and efficiency
471
In the studied network, teams 6 and 7 have fair betweenness centrality scores: 14 and 11 respectively. Seven teams are not on any shortest path. For example, team 12 is connected to only one other team and can therefore not be on a path between two teams. Team 9, on the other hand, is connected to several other teams but has only incoming ties. Since no knowledge is passed on from team 9 to other teams – at least not weekly or more often – it cannot play the role of a go-between. Careful examination of the network in Figure 1 shows that some teams are very central in the network (e.g., teams 2 and 17) whereas others are not on a single shortest path. Team 6 has a slightly higher betweenness score than team 7, 14.0 versus 11.0 respectively. This difference is small and can be disregarded. In sum, both high performers are on some shortest paths, but not to any exceptional degree. Betweenness centrality does not seem to capture differences between being highly creative and highly efficient.
4.4 Flow betweenness centrality The betweenness centrality measure (discussed above) assigns positional advantage to teams to the extent that they are on the shortest pathways between other pairs of teams. These teams are privileged in having natural and swift access to valuable knowledge. However, as we have seen, the fact that pairs of teams that are not directly connected have to rely on brokers for the transmission of vital knowledge poses distinct risks with respect to the quality and timeliness of the knowledge received. As they build experience communicating with the various in-between teams, they may find that some teams are less reliable than others. Regardless of whether this is due to unwillingness of the go-between to correctly pass on knowledge in a timely manner, or to that team’s inability, dependent teams may prefer to use alternative paths to communicate. If there exists another pathway, the two teams are likely to use it at least sometimes, even if it is longer and therefore ‘less efficient’. In general, actors may use all of the pathways connecting them, rather than just the shortest paths. Using multiple paths allows the teams to test the reliability of middle teams. In addition, it provides them with alternative routes that knowledge and information can still travel through in case the shortest path is blocked and it also permits triangulation: if knowledge flows through multiple paths it becomes easier to recognise when it has become distorted. The flow approach to centrality expands the notion of betweenness centrality. It assumes that actors will use all pathways that connect them, proportionally to their length. Flow betweenness is measured by the proportion of the entire flow between pairs of actors (through all of the paths connecting them) that occurs on paths a given actor is a part of. For each actor, then, the measure indicates how involved that actor is in all of the flows between all other pairs of actors. Since the magnitude of this index number would be expected to increase with the sheer size of the network and with network density, it is usually normalised by calculating the flow betweenness of each actor in ratio to the total flow betweenness that does not involve the actor. By this more complete measure of betweenness centrality, team 6 now has a (normalised) flow betweenness score of 5.1 whereas team 7 only has centrality 0.3. From this it is clear that team 6 (the highly creative but poorly efficient team) has a much stronger and extensive presence on the many different paths connecting pairs of new product teams in the network. When compared to the ‘regular’ betweenness centrality score – which compares presence on the shortest paths between teams – this shows that
472
R.Th.A.J. Leenders, J. Kratzer and J.M.L. van Engelen
the difference in flow betweenness between the highly creative and the highly efficient new product team mainly resides in the fact that team 7 mostly connects teams on their shortest paths. The highly creative team 6, on the other hand, has greater presence on the longer, less efficient, paths between pairs of teams. Knowledge travelling through these many longer paths may be less timely, but is also likely to be more varied. This offers the go-between the advantage of exposure to much and varied sources of knowledge and diverse subject matters, which is a known source of innovative thought.
5
Discussion and conclusions
SNA methods provide useful tools for addressing one of the most important (but also one of the most complex and difficult) aspects of social structure: the sources and distribution of resources – in our case, knowledge and information. The network perspective suggests that the knowledge a team has at its disposal is not only an attribute of the individual team, but also arises from its relations with other teams. And, the degree of inequality of access to project- and task-related knowledge in a network may be indexed. Power arises from occupying advantageous positions in networks of relations. Three basic sources of advantage are high degree, high closeness and high betweenness. In simple structures (such as the star, circle or line), these advantages tend to co-vary. In more complex and larger networks, there can be considerable disjuncture between these characteristics of a position – an actor may be located in a position that is advantageous in some ways, and disadvantageous in others. We have reviewed four basic approaches to the ‘centrality’ of the teams in an innovation network. What was found is that the highly efficient team 7 has very strong connections to well-connected teams (‘eigenvalue centrality’). Since it is connected to knowledgeable teams, team 7 need not maintain a large number of ties in order to constantly be in the know on what is going on in the knowledge network at large. It does maintain a few more weekly ties than team 6, but only marginally so. The highly creative team 6 has a clear presence on indirect paths between the other teams in the network (‘flow betweenness’). This presence provides the team with a variety of sources of knowledge and information. Such breadth of knowledge ties interferes with efficient team operation, but allows the team to develop innovative solutions through the inspiration that follows from the large variation in knowledge that flows through the team. It is clear from these analyses that both teams occupy very different positions in the innovation network. These different positions support very different kinds of performance, which explains why team 6 is highly creative but low on efficiency and why the highly efficient team 7 is weak on innovative performance. Of course, there may be other factors that determine the differential performance of these teams, but many such potential factors do not vary between these two teams. Much earlier research has shown that the creative performance of teams is strongly affected by the team member communication networks within the teams (e.g., Allen, 1971; 1977; Katz, 1997; Kratzer et al., 2005a; Leenders et al., 2002; 2007b); it only makes sense that the outside communication network should affect innovative team performance as well (Amabile, 1996; Eisenhardt and Tabrizi, 1995; Gladstein, 1984; Gloor, 2006). The question of how structural position confers performance advantages remains a topic for active research and considerable debate. Different definitions and measures can capture different ideas about where positional advantage comes from, and can result in some rather different insights about social structures. Moreover, the (political and
Innovation team networks: the centrality of innovativeness and efficiency
473
economic) sociology that has been central to the development of most centrality measures has focused mainly on how centrality affords power and prestige. Although power and centrality can certainly be important in the study of business-related networks – and indeed frequently are – many other kinds of performance and outcomes can derive from occupying central positions as well. In this article the differential performance deriving from network centrality has been team creativity and efficiency. How various centralities support or hinder these types of performance is still unanswered in the social network literature. We hope that this article may provide a starting point for more research on the basis of performance of teams that are part of a larger network. There have been studies that explain how organisations benefit from their network ties, but such studies tend to not focus on situations in which the various organisations under study are in fact part of a larger whole. In this article, we have used network analysis as a tool to understand favourable knowledge-sharing structures. Given the scope of the special issue, we have limited ourselves to pure SNA methodology. However, there are several approaches that can profitably be employed in conjunction with SNA methodology. We will briefly mention two areas where SNA can be enhanced. First, as pointed out in the Appendix, social network measures are difficult to apply when part of the network data is missing. Although missing data is inconvenient in many statistical or mathematical analyses, this is true for network measures in particular. The measures described in this article are difficult to calculate if information on the ties of one or several teams are missing. Besides the unwelcome step of removing those teams from the network, the only option an analyst has is to make an informed guesstimate of the missing values. In order to enhance the traditional SNA methodology of collecting network data through questionnaires, new methods have recently emerged. In particular, it has become technically feasible to collect communication network data by crawling telephone logs or e-mail logs. Software exists that can build different networks based on the topics included in e-mail messages or other written documents, using advanced forms of digital scanning. Of course, the use of such tools requires the consent of the organisation members being tracked. In addition, they do not capture communication that occurs through other media. For a full understanding of knowledge sharing and communication, multiple sources of information on multiple modes of communication are required (Leenders et al., 2007a). Second, there are many techniques that can be used to derive insight that adds to what can be gained through pure SNA. For example, there are many statistical tools that deal with ‘relational data’; these can often be applied to network data as well. For example, in the spatial sciences many techniques have been developed that deal with spatially distributed data (Anselin, 1988; 1992; Anselin and Griffith; 1988); spatial structures have much in common with social structures and spatial data are very similar to social network data. Many tools developed in geography and related sciences can successfully be applied to network data and add value to any SNA analysis (Doreian et al., 1984; 1989; Doreian, 1989; Doreian and Leinhardt, 1981; Dow, 1984; White et al., 1981; Leenders, 1995; 2002). A recent development is to apply simulation techniques to social network data. These studies address questions such as: What would the effect be of creating task dependency between a currently peripheral team to a central team? How likely is it for a random network structure to resemble the actual structure present in our study? And what could be learnt if the analyst would make additional assumptions that cannot be tested by the
474
R.Th.A.J. Leenders, J. Kratzer and J.M.L. van Engelen
present dataset, but the effects of which could be simulated? Such studies have slowly started to emerge (Monge and Contractor, 2003; Palazzolo et al., 2006), but network simulation is still only in its nascent stages. Understanding and facilitating innovativeness in teams is vital in the current knowledge-based economy. With markets becoming increasingly global and new products becoming increasingly complex, it is rare for individuals to possess all knowledge and information necessary to successfully compete in today’s marketplace. Perhaps the lion’s share of innovative success can be attributed to the way in which parties collaborate, share and develop knowledge, and innovate together. This both increases the need for managers to develop skills to create, manage and control innovative collaborative activity and increases the need for researchers to uncover the variables that support (or impede) collaborative endeavours. We believe that measures from SNA can provide useful insight into the reasons for differential performance of teams and organisations. Next to the four measures we have employed in this article there are, of course, many more measures that can be studied and that may provide even more useful insight. Hopefully this special issue will spawn a host of studies employing social network measures on a wide variety of studies on networks and virtual organisations.
References Adler, P.S., Goldoftas, B. and Levine, D.I. (1999) ‘Flexibility versus efficiency? A case study of model changeovers in the Toyota production system’, Organization Science, Vol. 10, pp.43–68. Agrell, A., Gustafson, R. and West, M.A. (1996) ‘Innovation and creativity in work groups’, Handbook of Work Group Psychology, New York: Wiley, pp.317–343. Allen, T.J. (1969) ‘Information flows in R&D labs’, Administrative Science Quarterly, Vol. 14, pp.12–20. Allen, T.J. (1971) ‘Communication networks in R&D Labs’, R&D Management, Vol. 1, pp.14–21. Allen, T.J. (1977) Managing the Flow of Technology, Boston: MIT Press. Amabile, T.M. (1983) The Social Psychology of Creativity, New York: Springer Verlag. Amabile, T.M. (1988) ‘A model of creativity and innovation in organizations’, Research in Organizational Behavior, Vol. 10, pp.123–167. Amabile, T.M. (1996) Creativity in Context, New York: Westview Press. Andriopoulis, C. (2001) ‘Determinants of organisational creativity: a literature review’, Management Decision, Vol. 39, pp.834–840. Andriopoulis, C. and Lowe, A. (2000) ‘Enhancing organisational creativity: the process of perpetual challenging’, Management Decision, Vol. 38, pp.734–742. Anselin, L. (1988) Spatial Econometrics: Methods and Models, Dordrecht: Kluwer. Anselin, L. (1992) ‘Space and applied econometrics: introduction’, Regional Science and Urban Economics, September, Vol. 22, No. 3, pp.307–316. Anselin, L. and Griffith, D.A. (1988) ‘Do spatial effects really matter in regression analysis?’, Papers, Regional Science Association, Vol. 65, pp.11–34. Bakker, M., Leenders, R.T.A.J., Gabbay, S.M., Kratzer, J. and Van Engelen, J. (2006) ‘Is trust really social capital? Knowledge sharing in product development projects’, The Learning Organization, Vol. 13, pp.594–605. Barrett, F.J. (1998) ‘Creativity and improvisation in jazz and organizations: implications for organizational learning’, Organization Science.
Innovation team networks: the centrality of innovativeness and efficiency
475
Belliveau, P., Griffin, A. and Somermeyer, S. (2002) The PDMA ToolBook 1 for New Product Development, New York: Wiley. Belliveau, P., Griffin, A. and Somermeyer, S. (2004) The PDMA ToolBook 2 for New Product Development, New York: Wiley. Bonacich, P. (1987) ‘Power and centrality: a family of measures’, American Journal of Sociology, Vol. 92, pp.1170–1182. Borgatti, S.P., Everett, M.G. and Freeman, L.C. (2002) ‘Ucinet for Windows: software for social network analysis’, Analytic Technologies, Harvard, MA. Cooper, R.G. (1990) ‘Stage-gate systems: a new tool for managing new products’, Business Horizons, Vol. 33, pp.44–55. Cooper, R.G. (1995) ‘Developing new product on time, in time’, Research Technology Management, Vol. 38, pp.49–58. Cooper, R.G. (1996) ‘Overhauling the new product process’, Industrial Marketing Management, Vol. 25, pp.465–482. Csikszentmihalyi, P. (1996) Creativity: Flow and the Psychology of Discovery and Invention, New York: HarperCollins. Csikszentmihalyi, P. and Sawyer, K. (1995) ‘Shifting the focus from individual to organizational creativity’, in C.M. Ford and D.A. Goia (Eds.) Creative Action in Organizations, Thousand Oaks: Sage, pp.167–173. DeMeyer, A.C.L. (1985) ‘The flow of technological innovation in an R&D department’, Research Policy, Vol. 14, pp.315–328. Doreian, P. (1990) ‘Network autocorrelation models: problems and prospects’, in D.A. Griffith (Ed.) Spatial Statistics: Past, Present, and Future, Monograph 12, Ann Arbor: Institute of Mathematical Geography. Doreian, P., Freeman, L.C., White, D.R. and Romney, A.K. (1989) ‘Models of network effects on social actors’, Research Methods in Social Network Analysis, George Mason University Press, pp.295–317. Doreian, P. and Leinhardt, S. (1981) ‘Estimating linear models with spatially distributed data’, Sociological Methodology, San Francisco: Jossey-Bass Publishers, pp.359–388. Doreian, P., Teuter, K. and Wang, C-H. (1984) ‘Network autocorrelation models’, Sociological Methods & Research, Vol. 13, pp.155–200. Dow, M.M. (1984) ‘Galton’s problem as network auto correlation’, American Ethnologist, Vol. 11, pp.754–770. Dym, C.L. (1994) Engineering Design: A Synthesis of Views, Cambridge: Cambridge University Press. Dym, C.L. and Little, P. (2000) Engineering Design: A Project-Based Introduction, Chichester: Wiley. Edwards, S.M. (2000) ‘The technology paradox: efficiency versus creativity’, Creativity Research Journal, Vol. 13, pp.221–228. Eisenhardt, K.M. and Tabrizi, B.N. (1995) ‘Accelarating adaptive processes: product innovation in the global computer industry’, Administrative Science Quarterly, Vol. 40, pp.84–110. Freeman, L.C. (1977) ‘A set of measures of centrality based on betweenness’, Sociometry, Vol. 40, pp.35–41. Freeman, L.C. (1979) ‘Centrality in social networks conceptual clarification’, Social Networks, Vol. 1, pp.215–239. Freeman, L.C. (1980) ‘The gatekeeper, pair-dependency and structural centrality’, Quality and Quantity, Vol. 14, pp.585–592. Freeman, L.C., Borgatti, S.P. and White, D.R. (1991) ‘Centrality in valued graphs: a measure of betweenness based on network flow’, Social Networks, Vol. 13, pp.141–154. Freeman, L.C., Roeder, D. and Mulholland, R.R. (1979) ‘Centrality in social networks: II. Experimental results’, Social Networks, Vol. 2, pp.119–141.
476
R.Th.A.J. Leenders, J. Kratzer and J.M.L. van Engelen
Friedkin, N.E. (1991) ‘Theoretical foundations for centrality measures’, American Journal of Sociology, Vol. 96, pp.1478–1504. Gersick, C. (1994) ‘Pacing strategic change: the case of a new venture’, Academy of Management Journal, Vol. 37, pp.9–45. Gilson, L.L. and Shalley, C.E. (2004) ‘A little creativity goes a long way: an examination of teams’ engagement in creative processes’, Journal of Management, Vol. 30, pp.453–470. Gladstein, D.L. (1984) ‘Groups in context: a model of task group effectiveness’, Administrative Science Quarterly, Vol. 29, pp.499–517. Gloor, P. (2006) Swarm Creativity: Competitive Advantage through Collaborative Innovation Networks, New York: Oxford University Press. Griffin, A. (1997) ‘PDMA research on new product development practices: updating trends and benchmarking best practices’, Journal of Product Innovation Management, Vol. 14, pp.429–458. Hage, P. and Harary, F. (1995) ‘Eccentricity and centrality in networks’, Social Networks, Vol. 17, pp.57–63. Hauptman, O. (1986) ‘Influence of task type on the relationship between communication and performance: the case of software development’, R&D Management, Vol. 16, pp.127–139. Hennessey, B.A., Amabile, T.M., West, M.A. and Farr, J.L. (1990) ‘The conditions of creativity’, Innovation and Creativity at Work, Chichester: Wiley, pp.11–38. Katz, L. (1953) ‘A new status index derived from sociometric analysis’, Psychometrika, Vol. 18, p.5. Katz, R. (1997) ‘Managing creative performance in R&D teams’, The Human Side of Managing Technological Innovation, New York: Oxford University Press, pp.177–186. Kratzer, J. (2001) Communication and Performance: An Empirical Study in Innovation Teams, Amsterdam: Tesla Thesis Publishers. Kratzer, J., Leenders, R.T.A.J. and Van Engelen, J.M.L. (2005a) ‘Informal contacts and performance in innovation teams’, International Journal of Manpower, Vol. 26, pp.513–529. Kratzer, J., Leenders, R.T.A.J. and Van Engelen, J.M.L. (2005b) ‘Keeping virtual R&D teams creative’, Research Technology Management, Vol. 48, pp.13–16. Leenders, R.T.A.J. (1995) Structure and Influence: Statistical Models for the Dynamics of Actor Attributes, Network Structure, and Their Interdependence, Amsterdam: Tesla Thesis Publishers. Leenders, R.T.A.J. (2002) ‘Modeling social influence through network autocorrelation: constructing the weight matrix’, Social Networks, Vol. 24, pp.21–47. Leenders, R.T.A.J., Kratzer, J., Hollander, J. and Van Engelen, J.M.L. (2002) ‘Managing product development teams effectively’, in P. Belliveau, A. Griffin and S. Somermeyer (Eds.) The PDMA Toolbook for New Product Development, New York: Wiley, pp.141–163. Leenders, R.T.A.J., Kratzer, J. and Van Engelen, J.M.L. (2003) ‘Virtuality, communication, and new product team creativity: a social network perspective’, Journal of Engineering Technology Management, Vol. 20, pp.69–92. Leenders, R.T.A.J., Kratzer, J. and Van Engelen, J.M.L. (2004) ‘Building creative virtual new product development teams’, in P. Belliveau, A. Griffin and S. Somermeyer (Eds.) PDMA Toolbook for New Product Development II, New York: Wiley, pp.117–147. Leenders, R.T.A.J., Kratzer, J. and Van Engelen, J.M.L. (2007a) ‘Media ensembles and new product team creativity: a tree-based exploration’, in S.P. MacGregor and T. Torres-Coronas (Eds.) Higher Creativity for Virtual Teams: Developing Platforms for Co-Creation, Hershey, PA: Information Science Reference. Leenders, R.T.A.J., Van Engelen, J.M.L. and Kratzer, J. (2007b) ‘Systematic design methods and the creative performance of new product teams: do they contradict or complement each other?’, Journal of Product Innovation Management, Vol. 24, pp.166–179. McDonough, E.F., III, Kahn, K.B. and Barczak, G. (1999) ‘Effectively managing global, co-located and distributed new product development teams’, IEEE Transactions on Engineering Management, Vol. 46, pp.375–386.
Innovation team networks: the centrality of innovativeness and efficiency
477
Moenaert, R.K., Caeldries, F., Lievens, A. and Wauters, E. (2000) ‘Communication flows in international product innovation teams’, Journal of Product Innovation Management, Vol. 17, pp.360–377. Monge, P.R. and Contractor, N.S. (2003) Theories of Communication Networks, New York: Oxford University Press. Moreno, J.L. (1934) Who Shall Survive?: Foundations of Sociometry, Group Psychotherapy, and Sociodrama, Washington, DC: Nervous and Mental Disease Publishing Co. Mumford, M.D. and Gustafson, S.B. (1988) ‘Creativity syndrome: integration, application and innovation’, Psychological Bulletin, Vol. 103, pp.27–43. Nemiro, J.E. (2000) ‘The glue that binds creative virtual teams’, in Y. Malhotra (Ed.) Knowledge Management and Virtual Organizations, Hershey: Idea Group Publishing, pp.101–123. Nemiro, J.E. (2002) ‘The creative process in virtual teams’, Creativity Research Journal, Vol. 14, pp.69–83. Palazzolo, E.T., Serb, D.A., Su, C. and Contractor, N.S. (2006) ‘Coevolution of communication and knowledge networks in transactive memory systems: using computational models for theoretical development’, Communication Theory, Vol. 16, p.223. Pirola-Merlo, A. and Mann, L. (2004) ‘The relationship between individual creativity and team creativity: aggregating across people and time’, Journal of Organizational Behavior, Vol. 25, pp.235–257. Rosenau, M.D., Griffin, A., Castellion, G. and Anschuetz, N. (1996) PDMA Handbook of New Product Development, Chichester: Wiley. Sethia, N.K. (1995) ‘The role of collaboration in creativity’, in C.M. Ford and D.A. Goia (Eds.) Creative Action in Organizations, Thousand Oaks: Sage, pp.100–105. Shalley, C.E. (1995) ‘Effects of coaction, expected evaluation, and goal setting on creativity and productivity’, Academy of Management Journal, pp.483–503. Shalley, C.E., Zhou, J. and Oldham, G.R. (2004) ‘The effects of personal and contextual characteristics on creativity: where should we go from here?’, Journal of Management, Vol. 30, pp.933–958. Shaw, M.E. (1954) ‘Group structure and the behavior of individuals in small groups’, Journal of Psychology, Vol. 39, p.11. Shimbel, A. (1953) ‘Structural parameters of communication networks’, Bulletin of Methematical Biophysics, Vol. 15, p.7. Simon, H.A. (1969) The Sciences of the Artificial, Cambridge: MIT Press. Taggar, S. (2002) ‘Individual creativity and group ability to utilize individual creative resources: a multilevel model’, Academy of Management Journal, Vol. 45, pp.315–330. Uzzi, B. (1996) ‘The sources and consequences of embeddedness for the economic performance of organizations: the network effect’, American Sociological Review, Vol. 61, pp.674–698. Van Engelen, J.M.L., Kiewiet, D.J. and Terlouw, P. (2001) ‘Improving performance of product development teams through managing polarity’, International Studies of Management and Organization, Vol. 31, pp.46–63. Wasserman, S. and Faust, K. (1994) Social Network Analysis: Methods and Applications, New York: Cambridge University Press. West, M.A. and Farr, J.L. (1990a) Innovation and Creativity at Work, Chichester: Wiley. West, M.A. and Farr, J.L. (1990b) ‘The social psychology of innovation in groups’, Innovation and Creativity at Work, Chichester: Wiley, pp.309–333. Wheelwright, S.C. and Clarke, K.B. (1992) Revolutionizing Product Development: Quantum Leaps in Speed, Efficiency, and Quality, New York: Free Press. White, D.R. and Borgatti, S.P. (1994) ‘Betweenness centrality measures for directed graphs’, Social Networks, Vol. 16, pp.335–346. White, D.R., Burton, M.L. and Dow, M.M. (1981) ‘Sexual division of labor in African agriculture: a network autocorrelation analysis’, American Anthropologist, Vol. 83, pp.824–849.
478
R.Th.A.J. Leenders, J. Kratzer and J.M.L. van Engelen
Appendix Network data collection procedure In this Appendix we provide some details on the procedure used to collect the network data in this article. In this article, the dataset is based on interviews with team members in team leadership positions. We provided each interviewee with a sheet of paper on which all teams were drawn – represented by a half-inch-sized dot with the team name attached to it – but without any lines connecting them. The teams were outlined as a circle, with the respondent’s team placed in the middle. We then asked the respondent to use a pen to draw his/her team’s communication network and denote which teams they communicate with at least weekly. We asked representatives from all teams to do this, building a picture of the entire communication network. We further gained insight into the team interaction network by asking the respondents a host of questions about this communication: what is the communication about, are there problems in the communication, why does communication occur, are teams task interdependent, etc. Many of these address questions beyond the scope of this article. The resulting dataset consisted of a presence/absence score for each tie. In a network of g actors, g(g – 1) directed relationships need to be measured – the relationship of a team with itself is usually not considered. In the current study, the interteam network of the 17 teams thus consists of 17 * 16 = 272 potential links of at least weekly interaction. Since these relationships were binary in nature – they were present or absent – we captured them in a 17 × 17 adjacency matrix (see Figure 2 for an example). This matrix was then read by the program Ucinet (Borgatti et al., 2002) for the calculation of the centrality measures. It is useful to note that team networks can also be fruitfully measured through questionnaires. We employed this method for collecting interaction networks within the teams (not used here). The procedure was as follows: All team members were provided with a roster of other members of their team and were asked with whom they communicated at least on a weekly basis. We asked this question several times, each time referring to a different content of communication. For example, one question was with whom they communicated regarding “the discussion, development, or evaluation of new ideas or approaches to technical problems, technical or scientific help or advice, or the distribution of scientific or technical information”. Hauptman (1986) classifies this type of communication as ‘innovative’. The downside of many social network measures is that they deal poorly with missing data. Although imputation methods exist and it is often possible to infer the value of a tie, problems arise when members of the network do not fill out the questionnaire. In the current article this problem did not occur since everyone agreed to an interview, was willing to draw their network structure, and we were physically present when they did.