IEEE TRANSACTIONS ON VEHICULAR TECHNOLOGY, VOL. 53, NO. 2, MARCH 2004
1
Innovative Iteration Algorithm for a Vehicle Simulation Program Joeri Van Mierlo and Gaston Maggetto
n NOx PDF PHEV
SHEV
Index Terms—Acceleration control, fuel optimal control, road vehicle propulsion, simulation software.
VCS VSP
ABBREVIATIONS Ah
APU
CHEV CNG CO ECE 15 EV FCEV FCHEV HC HEV ICE
Total mass (kg). Attenuation factor. Nitrogen oxides. Acceleration power ( ). Power distribution factor. Parallel hybrid–electric vehicle. Maximum power ( ). Power reduction. Resistive power ( ). Required pPower ( ). Resistive power at wheel side ( ). Resistive power at energy-source side ( Set-point power ( ). Series hybrid–electric vehicle Acceleration torque ( ). Inertia torque ( ). Maximum torque ( ). Resistive torque ( ). Set-point torque ( ). Vehicle control system. Vehicle simulation program. Rotational speed (rad/s).
).
IE E Pr E oo f
Abstract—Resulting from Ph.D. research, a vehicle simulation program is proposed and continuously developed, which allows simulation of the behavior of electric, hybrid, fuel cell, and internal combustion vehicles while driving any reference cycle. The goal of the simulation program is to study power flows in the drivetrains of vehicles and the corresponding component losses, as well as to compare different drivetrain topologies. This comparison can be realized for energy consumption and emissions, as well as for performance (acceleration, range, maximum slope, etc.). The core of this program, consisting of a unique iteration algorithm, will be highlighted in this paper. This algorithm not only allows the calculation of the limits of vehicle acceleration in the function of drivetrain component characteristics, but at the same time is able to develop and evaluate the different power-management strategies of hybrid vehicles, combining combustion engines and electric motors. Furthermore, the comprehensive iteration algorithm is demonstrated to be very efficient in handling any type of working limit for all components in different types of drivetrains, which results in an accurate and modular vehicle simulation program with high data flexibility.
Amperehours. Maximum acceleration . Possible acceleration . Auxiliary power unit (engine generator group). Acceleration reduction. Attenuated acceleration reduction. Required acceleration . Combined hybrid–electric vehicle. Compressed natural gas. Carbon oxide. Carbon dioxide. European-type approval cycle. Electric vehicle. Inertial force ( ). Fuel cell electric vehicle. Fuel cell hybrid–electric vehicle. Efficiency (%). Hydrocarbons. Hybrid–electric vehicle. Internal combustion engine.
Manuscript received July 19, 2001; revised July 2, 2003, November 28, 2003, and December 1, 2003. The authors are with the Department of Electrotechnical Engineering and Energy Technology (ETEC), Vrije Universiteit Brussels, Brussels 1050, Belgium (e-mail:
[email protected]). Digital Object Identifier 10.1109/TVT.2004.823534
I. INTRODUCTION
R
ESULTING from Ph.D. research [1], a vehicle simulation program (VSP) is proposed and continuously developed. It is a modular user-friendly interactive program that allows simulation of the behavior of electric (battery, hybrid, and fuel cell) as well as internal combustion vehicles [petrol, diesel, compressed natural gas (CNG), etc.]. The goal of the simulation program is to study power flows in the drivetrains of vehicles and their corresponding component losses, as well as to compare different drivetrain topologies. This comparison can be realized for consumption (fuel and elec, HC, NOx, CO, particles, etc.), as tricity) and emissions ( well as for performances (acceleration, range, maximum slope, etc.). VSP has already been used in several European and national research programs [2]–[6]. Different concepts of the simulation program are described in [7]–[12]. This paper describes the innovative comprehensive iteration algorithm that calculates vehicles’ performance and limits and allows the implementation and evaluation of any kind of power-management strategy in hybrid drivetrains. Following this introduction, the general characteristics of VSP, as a longitudinal VSP, are described in Section II. The need for an intelligent iteration algorithm is highlighted and
0018-9545/04$20.00 © 2004 IEEE
2
IEEE TRANSACTIONS ON VEHICULAR TECHNOLOGY, VOL. 53, NO. 2, MARCH 2004
some definitions, which are required to understand the next section of the paper, are introduced. For a better understanding of the methodology, an example of a hybrid drivetrain is explained in Section III. In Section IV, a comprehensive overview of the iteration process is described in detail. Finally, validation of the methodology is illustrated in Section V, followed by the conclusion. II. VSP AS A VEHICLE SIMULATOR
Fig. 1.
Component boundary.
A. Software Language of identical speed profiles is not possible without a speed controller. • The effect–cause method, also called either the wheel-toengine or front-to-rear method, operates backward. With an imposed speed cycle, one calculates the forces acting on the wheels and processes backward through the drivetrain up to the primary energy sources, which are either fuel or electricity. Both methodologies can include feedback loops. The way in which these loops are developed determines, in essence, the overall calculation speed of the software tool. The iteration process in VSP allows high calculation speed and high simulation accuracy (see below). Complementary to the basic backward approach, the implemented iteration algorithm also leads to forward approach features, such as simulating driver behavior and control algorithms, are possible as well. Other simulation programs, such as ADVISOR [16], [21], [22], combine backward and forward modeling. VSP differs fundamentally from these types of software tools in the following ways. • It is a closed-loop simulation with a unique comprehensive and standardized iteration algorithm dedicated for the flexible implantation of a different type of hybrid drivetrain topologies and power-flow control algorithms, taking into account each component’s operating boundaries or desired operating conditions. • Due to this iteration process, very accurate results are possible. • It has an in-depth worked-out program modularity in which almost all parameters are only accessible in the simulation module of each component itself. • It has a flexible database structure, integrated in the component models, allowing the easy implementation of a different kind of component data in the form of lookup table, maps, theoretical equations, or empirical formula, in function of the available data.
IE E Pr E oo f
The VSP runs in a LabVIEW environment. The software tool described in this paper could also be developed in MATLAB/SIMULINK or a traditional text-based programming languages such as, e.g., C++, but text-based programming languages are less flexible for using a modular simulation program. Modifications in this type of model, other than changing parameter values, will usually lead to a major reprogramming effort and reformatting of input files. LabVIEW is mostly used for the development of data-acquisition software, but can also be used for other purposes, such as simulation software. LabVIEW is a high-level programming tool, with the advantage of having a user-friendly interface with a high graphical performance. With these features, LabVIEW makes the best use of the concept of modular programming. An application is to be divided into a series of tasks, which can be divided again until this application, as complicated it can be, becomes a series of simple subtasks. B. Data Flow—Longitudinal Dynamics Simulation
The basic modeling strategy used in VSP is the well-tried and trusted method [13]–[17] of dividing the drive cycle into a number of time steps and calculating the characteristics of the vehicle at the end of each time interval, which is called the longitudinal dynamics simulation. The longitudinal dynamics simulation serves to calculate the time characteristics of several quantities in a vehicle. Therefore, it is a good tool to detect the weak points in the drivetrain and, moreover, to further assess the improvements of single drive components [18]. The simulator approximates the behavior of a vehicle in a continuous series of discrete steps (time increments), during each of which the components are assumed to be in steady state. The smaller this step is, the higher the accuracy. In handling the modeling process, it is important that the energy flow can have a forward as well as a reverse direction, corresponding with driving or using the brake of the vehicle [19]. Two main modeling methods can be distinguished: the forward and the backward calculation [20]. • The forward method, also called either the cause–effect, engine-to-wheel, or rear-to-front method, starts at the set point set by a driver (acceleration pedal) or controller. With this set point, one can calculate the force acting on the wheels. The speed profile of the vehicle thus depends on the set point. This method is interesting to test control algorithms (for example, PID controller). Also, the behavior of the driver can be evaluated. A reproduction
C. Drivetrain Performance Limits While simulating the behavior of a drivetrain performing a chosen speed cycle, it is possible that one of the components cannot satisfy the demanded requirements (see Fig. 1). For instance, if a motor can reach its maximum torque or can run in overspeed, a battery or inverter can be overloaded. In that case, it is necessary to reduce the acceleration resulting from the imposed speed cycle chosen for the simulation and, hence, to evaluate the maximum performance (possible
VAN MIERLO AND MAGGETTO: INNOVATIVE ITERATION ALGORITHM FOR A VEHICLE SIMULATION PROGRAM
Fig. 2. Possible speed calculation.
•
parameters value (e.g., power levels) higher than the imposed limit, which will influence the end results. In VSP, all parameters are calculated in function of the simulated possible speed and acceleration. When, for instance, the battery of an electric vehicle is not able to deliver the required power, not only the inverter power should be decreased, but also all other parameters (torque, power, etc.) of the drivetrain downstream components. Should this effect be neglected, then the efficiency of, e.g., the motor would be calculated in the function of power requirements that differ from the power defined by the battery limits. Hybrid backward/forward approaches require two different models for one single component: a forward model and a backward model. With an iteration loop, this is not necessary. Another advantage is the calculation speed. Using one global feedback loop will allow faster simulation than using several small feedback loops, as are used in forward calculation models. Additionally, the standardized comprehensive iteration process allows a very modular and flexible simulation model.
IE E Pr E oo f
speed, acceleration, etc.) of the drivetrain. At this time, drivetrain performance (maximum acceleration) can be assessed, but the results corresponding to fuel economy cannot be used as a comparison with, e.g., type-approval data because these vehicles have to be evaluated based on speed cycles (e.g., ECE15, EUDC, FTP, USo6, etc.), which have regulatory constraints. Hence, these speed cycles should be followed within accuracy limits. However, VSP is developed to assess fuel economy as well as maximum acceleration. To ensure that all components operate within defined boundaries, corresponding to loading limitations, acceleration reductions are introduced in the VSP software. This acceleration reduction (AR) is used in the closed-loop simulation to iterate toward the possible vehicle acceleration defined by the characteristics of the drivetrain components or chosen by the user. Hence, the required torque, as well as the corresponding power, will decrease. Fig. 2 illustrates the reduction of the required but unfeasible acceleration , corresponding to a desired velocity into the possible acceleration , resulting in a possible velocity . In the case of hybrid vehicles, different solutions are possible to keep the operating points of a component within limits. In [11], descriptions of the definition, the different hybrid vehicle drivetrain topologies (which are modeled in the software), and the corresponding power-management algorithms are provided. The power-flow control strategy of hybrid drivetrains is implemented with the same iteration process. The power distribution between the several mechanical shafts or energy sources is controlled with the help of a power distribution factor (PDF). When exceeding the operating boundaries, a power reduction (PR) will be implemented, instead of using an acceleration reduction, to regulate the power split (the PDF) in the different components that are in charge of the power flow in the hybrid drivetrain (e.g., DC-bus controller or gear). This results in controlling the power management with an overall control with the help of the vehicle control system (VCS) unit, which defines the total power management and a local action acting on the level of drivetrain components characteristics. For instance, in a series hybrid drivetrain it can be necessary to reduce the power delivered by the generator in order to not overcharge the battery. In the model, the maximum battery voltage limit will define a PR factor to decrease the generator power in the next iteration step. This innovative iteration algorithm allows the handling of all these possibilities in a uniform way with the help of one global feedback loop. Using one global feedback loop has several advantages in comparison with models (e.g., ADVISOR), which first simulates backward and then forward to calculate the vehicle maximum performance or models that only use forward calculation methods. • When the output of a component is limited to its maximum performance, it will not require more power from an upstream1 component than it can use. However, all downstream components characteristics are still calculated with 1Upstream components are components closer to the energy source. Downstream components are components closer to the wheels.
3
•
•
•
D. Drivetrain Subsystems
To be able to explain the philosophy of the iteration process, some definitions should first be introduced. Each hybrid drivetrain is theoretically divided in three parts: a “common subsystem,” an ‘acceleration subsystem,” and a “power subsystem” (see also Fig. 4 in Section IV). • The acceleration subsystem defines, in essence, via the AR factor, the mechanical quantities of the vehicle. • The power subsystem is characterized principally by power flow, which is controlled in the simulation program with the help of the PDF via the PR factor. • The total traction effort driving the wheels, developed by the acceleration subsystem as well as by the power subsystem, goes trough the common subsystem. The name given to these subsystems is related to the simulation methodology and not necessarily to the function of the components that are part of that subsystem. The components can have different functions. These definitions are theoretical names to explain the iteration algorithm. Table I defines to which part of the drivetrain the components of the different vehicle types belong. The acceleration subsystem always contains the battery and the power subsystem
IEEE TRANSACTIONS ON VEHICULAR TECHNOLOGY, VOL. 53, NO. 2, MARCH 2004
IE E Pr E oo f
4
Fig. 3.
Block diagram of the combined hybrid–electric vehicle model.
always contains the generator (or other energy source). The terminology is defined in the list of abbreviations. When calculating the force acting on the vehicle, the acceleration and resistive forces are calculated separately. The resistive force includes the friction, aerodynamic, and climbing forces. The acceleration force is proportional to the vehicle acceleration and inertia. By keeping the acceleration force separated from the resistive force, it is possible to calculate the possible accelera-
tion. This process is always performed in the acceleration subsystem. The power subsystem always delivers “resistive” power: this basic philosophy allows for control of the acceleration as well as the PDF. The fact that the acceleration subsystem is responsible for the acceleration of the vehicle does not mean that the power delivered by the power subsystem is not used for acceleration. The power of the power subsystem will reduce the required power of the acceleration subsystem and, hence, it will
Fig. 4.
5
IE E Pr E oo f
VAN MIERLO AND MAGGETTO: INNOVATIVE ITERATION ALGORITHM FOR A VEHICLE SIMULATION PROGRAM
AR and PR of acceleration subsystem or power subsystem.
take part in the acceleration process in an indirect way (see Section IV-B)
TABLE I ACCELERATION AND POWER SUBSYSTEMS
III. EXAMPLES TO ILLUSTRATE THE METHODOLOGY A. Example of a Model of a Complex Hybrid Drivetrain
To explain the methodology of the iteration process, a combined hybrid drivetrain will be used. The combined hybrid drivetrain, as in the Toyota Prius, is one of the most complex models of the VSP, which combines a series hybrid drivetrain with a parallel hybrid drivetrain. A detailed description of this combined hybrid model can be found in [10]. Fig. 3 contains a sequence structure of three frames showing block diagrams for different subprograms. The upper frame shows an initialization faze as well as the selection whether or not the engine should be engaged (in function of the VCS). The input parameters (actual speed, number of passengers, slope, and required speed) come from the main program (described in [7] and [12]). The speed of the vehicle is defined by the imposed speed cycle that the vehicle has to follow. The middle frame shows the actual iteration loop and the different components of the combined hybrid drivetrain, which is built up with the subprograms for the drivetrain components. One can first recognize the elements of the common subsystem: the body, wheels, and the differential. Besides, one can find the torque splitter (toothed gear), which divides the required traction torque between the planetary gear on one side and electric
motor, inverter, and battery (8) on the other. The torque division is controlled via the power distribution factor 1 . Additionally, the planetary gear introduces a second degree of freedom in comparison with a parallel hybrid drive. The planetary gear set divides the engine driving torque into two torques:
6
IEEE TRANSACTIONS ON VEHICULAR TECHNOLOGY, VOL. 53, NO. 2, MARCH 2004
one that drives the wheels, via the torque splitter, and the other that drives a generator. The electrical energy, produced by the generator, is reconverted into mechanical energy through the electric motor or is stored in the battery. Within the iteration will control the power path of the genprocess, a second is not entirely independent of , due to erator. This the fact that the generator power is dependent from the power division in the torque splitter (see Fig. 3). The generator velocity setting determines the speed of the engine. Hence, the working of the internal combustion engine can be fully controlled independently from the required traction force and vehicle velocity [1]. Finely one can also find the model for the auxiliaries and the model controlling the iteration process. In the lowest frame, the possible speed is calculated. The corresponding delivered power as well as the delivered fuel power and the power from a third power unit, such as a flywheel, is stored in a cluster as an output. B. Some Examples of Component Operating Limits
• An AR is necessary when a motor is overloaded or overspeeded, or when a battery current too high, etc. • When driving at constant speed and a sudden slope occurs, the drive system may not be able to deliver the required power and must decelerate (AR smaller than one). • One is driving at high speed with a moderate acceleration and suddenly the battery minimum voltage limit is reached. At this moment, a negative AR higher than 1 is required to decelerate the vehicle. • One is driving at high speed with a moderate deceleration, but the battery current is not yet reversed, which means that the battery is still being discharged. Suddenly, the battery minimum voltage limit is reached. At this moment, a positive AR higher than 1 is necessary to decelerate the vehicle more and, hence, recharge the battery and increase the battery voltage. • When the maximum power is smaller than the resistive part of the power while the vehicle is asked to accelerate, the vehicle needs to drive slower, thus a negative AR is necessary. This is the case, for instance, when driving with a moderate acceleration and the road inclination increases heavily. 2) Hybrid Vehicles:
IV. MATHEMATICAL IMPORTANCE AND COMPREHENSIVE OVERVIEW OF THE ITERATION PROCESS A. Reduction Parameters In Section II, the principles of the calculation methodology and iteration process are described. In this section, a comprehensive overview of the iteration process is described in detail in function of all possible drivetrain limitations. The iteration process is structured taking into account three types of limits: speed ( -max), torque ( -max) and power ( -max). All other limits (current and voltage) are in the simulation model that are transformed into power limits. Hence, the iteration process has been uniformed. Also, the speed and torque could be converted into a power limit, but this would decrease the iteration accuracy. Due to the straightforward relationship between the acceleration on one side and the velocity and torque on the other, one should keep this close liaison rather than passing through a power-limit conversion. Each type of , or both. The next paragraphs limit can result in an AR, a will describe the different possibilities. Fig. 4 illustrates these possibilities. Basically, the AR is used as a feedback to control the vehicle acceleration. Mostly, the AR will be defined in the common subsystem or the acceleration subsystem. The PR controls the PDF and is, hence, used in the feedback loop defining the power distribution between acceleration and power subsystem. PRs will never be generated in the common subsystem but, however, can be defined in either the acceleration or power subsystem. 1) Torque Reduction: a) Acceleration subsystem: Acceleration reduction: During the iteration process (at a certain time increment) the vehicle velocity will remain constant, which corresponds to a constant resistive torque. When the required torque is higher than the maximum torque, the iteration process will act on the acceleration to reduce the acceleration torque , which is proportional to the acceleration . When the required torque , the AR will be calculated exceeds the maximum torque by taking the ratio between the part of maximum torque that and the can be effectively used for acceleration [(1)]. Indeed, due to the fact required acceleration torque that the vehicle is running at a certain velocity, the resistive is being delivered in any case. Thus, the possible torque acceleration torque is the remaining part of the maximum torque that is not assigned to the resistive torque. Hence,
IE E Pr E oo f
Some real-life examples of possible component operating limits follow. 1) Electric or ICE Vehicles:
• When an engine of a parallel hybrid vehicle is operating at a rotation speed lower than the idle speed, the engine cannot deliver power and a PR equal to 0 is required. At this moment, the electric traction motor will deliver all the power. • In a parallel hybrid vehicle, an AR can be introduced in the battery model or an AR can come from the engine model. When this engine rotational speed exceeds its maximum allowed value, an AR is required to limit the speed of the total drivetrain.
• A PR is necessary when a flywheel is turning too fast, a super capacitor is overcharged, the required engine power is too high, the current variation in time of a fuel cell is too high, etc. • If one wants to start an engine with the generator in a series hybrid vehicle, a negative PR is necessary to iterate to a PDF corresponding to the startup power, which should be delivered by the battery. • In a series hybrid vehicle, when the battery voltage is too high, a PR can be necessary to reduce the generatorcharging power.
VAN MIERLO AND MAGGETTO: INNOVATIVE ITERATION ALGORITHM FOR A VEHICLE SIMULATION PROGRAM
acceleration is only possible if the maximum torque is bigger than the resistive torque (1) (2) The reduction of the vehicle required acceleration is performed in a subprogram that controls the iteration process and is called “Iteration Algorithm .vi.” While calculating backward through the drivetrain, the resistive torque reference changes in the functions of the transmission ratio of gear units and of the efficiency of the components. of (1), which is necessary to calThe acceleration torque culate the AR, has to be derived indirectly due to the fact that the inertia of each component will also influence its value. The acceleration torque can be obtained by subtracting the resistive torque from the required torque
All rotating components of the power subsystem will contribute to the inertia torque. Equation (6) defines the required torque of the power subsystem mechanical components. To reduce the number of parameters, (7) will be used to calculate the PR in which the same parameters as for the calculation of AR are employed. Similar to the AR, no parameters that changes due to inertia are chosen to define the AR and PR. These parameters are the acceleration torque (acceleration subsystem) and the inertia torque (power subsystem). Only parameters that change due to efficiency and transmission ratio are used. In this way, the power and acceleration reduction can be calculated in a uniform way in all components. (6) (7) c) Acceleration subsystem: Power reduction: In hybrid drivetrains, not only the acceleration and resistive wheel torque define the required torque of the components that are part of the acceleration subsystem, but also the torque of the power subsystem. Indeed, due to the fact that the power subsystem is also supplying a part of the total traction torque, the required is the sum of torque of the acceleration subsystem and the resistive torque the vehicle acceleration torque minus this additional torque (example of a parallel hybrid drivetrain)
IE E Pr E oo f
(3) Equations (1)–(3) illustrate the fundamental approach for the calculation of the acceleration reduction in the case of a torque limit. b) Power subsystem: Power reduction: For a component to be part of the power subsystem, it makes no sense to limit the acceleration. At this moment, the only way to get the operating point of the component within its maximum limits is by reducing the PDF with the help of a PR factor. In the case of a parallel or combined hybrid drivetrain, this PDF imposes a certain torque that can be seen as a pure resistive torque. As result of the fundamental philosophy of the iteration process, the torque to accelerate the vehicle is delivered by the acceleration subsystem. The reference to calculate the PR in this iteration defined by the PDF out process will be the torque set-point of the VCS and the required input torque at wheel side (4)
In the “Iteration Algorithm .vi”, the calculation process can first iterate toward the possible acceleration with the help of the AR; afterward, it iterates toward the possible PDF. In parallel and combined hybrid drivetrains, the acceleration of the power subsystem is related to the acceleration of the vehicle [1] due to the mechanical connection between power and the acceleration subsystem. This acceleration leads to additional inertia torques . Thus, the possible torque set point is the remaining part of the maximum torque that is not assigned to the inertia torque. When the required torque is higher than the maximum torque , the iteration process will act on the PDF to reduce the . Then the PR is calculated by taking the torque set-point ratio between the part of maximum torque that can be effectively used and the torque set point (5)
7
(8)
Instead of reducing the vehicle acceleration, it could be some) to first reduce this additimes better (e.g., when tional power subsystem torque with the help of a PR acting on the PDF until the PDF no longer has an effect on the torque limit (e.g., PDF equals zero). d) Power subsystem: Acceleration reduction: Considering that the power subsystem provides a torque corresponding to the torque set point, it makes no sense to reduce the vehicle acceleration (performance); rather, one should always reduce the torque set point via PDF and PR to keep the components of the power subsystems within their boundaries. 2) Speed Reduction: Components not have only to operate within torque limits, but are also not allowed to exceed their maximum speed limits. a) Acceleration subsystem: Acceleration reduction: At each step of the drive-cycle loop, the current velocity is used as input of the drivetrain model. During the AR–PR iteration process, this velocity will be kept constant (to have a constant and the required reference). Based on the speed value acceleration , one can calculate what the next velocity will be when the iteration is finished. In the next speed-cycle step, this new actual speed could be higher than the maximum allowed [(9), with the time increment of the speed velocity cycle] (9)
8
IEEE TRANSACTIONS ON VEHICULAR TECHNOLOGY, VOL. 53, NO. 2, MARCH 2004
When a component is going to exceed this maximum speed limit, the required acceleration thus has to be reduced to the , as defined maximum acceleration (10) For the components that are part of the acceleration subsystem, a reduction of the vehicle acceleration will result automatically in a proportional reduction of the components acceleration. Equation (11) defines the corresponding AR as
rent or voltage, flywheel overloaded, etc.).2 Hence, this allows the design of a uniform iteration process. is the power corresponding to all The resistive power forces acting on the vehicle minus the acceleration force. is the power defined by the PDF. At The power set-point the moment a component transforms mechanical power into electric power (or vice versa), the resistive power and power set point are, respectively, calculated based on the speed , the as resistive torque , and the torque set-point (14) (15)
(11)
a) Acceleration subsystem: Acceleration reduction: It is not always possible to unequivocally define a resistive power , due to, e.g., the energy conversion from mechanical to electrical. In the different components, the resistive power will be calculated in function of the efficiency (16)
IE E Pr E oo f
b) Power subsystem: Power reduction: In hybrid vehicles, the velocity of some components can be a function of the required torque; e.g., in a series hybrid vehicle, the velocity of the engine (part of the APU) can be defined in the function of the required APU output power in such a way that it corresponds to the lowest fuel consumption. Hence, it is required to reduce the PDF to get the velocity within its limits. In the power subsystem, the acceleration imposes additional , which can be defined by inertia torques (12)
The maximum velocity defines a maximum acceleration [see (10)]. The maximum allowed inertia torque is thus proportional to the maximum acceleration. The maximum corresponding can thus be calculated with (13), with AR as detorque fined in (11) and the required PR can be calculated in the same way as the PR of the torque limitation (see Section IV-A.1b). (13) (7)
In not all hybrid drivetrains the reduction of the PDF (or torque set point) will result in a reduction of the component acceleration; e.g., when one wants to keep the engine speed within range in the case of a parallel hybrid vehicle, reducing the torque will have no effect on the velocity. In this case, an acceleration reduction is required. c) Acceleration subsystem: Power reduction: It makes no sense to reduce the PDF for a speed limitation of the acceleration subsystem components, since the velocity of these components is only defined by the vehicle’s acceleration and is independent . of the PDF and corresponding torque set-point d) Power subsystem: Acceleration reduction: The only case in which a component of the power subsystem has to impose an AR is when this component velocity depends on the vehicle velocity (e.g., parallel hybrid vehicle). When one has a power (see below) or torque (see above) limitation in a component of the power subsystem, it is always with the PR that the possible value is calculated, not via the AR. The AR is calculated in an analog way, as is done in the components of the acceleration subsystem. 3) Power Reduction: Most of the limits can be converted into a power-limit implementation (e.g., maximum battery cur-
There seldom is a linear relationship between acceleration and power; rather, it is often a quadratic relation. When one would define the AR in the same way as the reduction in the case of a torque limit, this could result in a too-stringent reduction of the acceleration and, thus, in a possible speed that is lower than the maximum value corresponding to the power limit (17)
The AR [defined by (17) in the same way as the AR provoked by a torque limit] must be attenuated in the case of a power limit. When the AR is positive, this attenuation is implemented by extracting the th root of AR or when AR is negative by taking the th power of AR [see(18)]. The higher the , the higher the attenuation, but the slower the iteration process converges to possible value (18)
b) Power subsystem: Power reduction: Similar to a torque limitation in the power subsystem, once the component’s required power reaches its maximum limit, the PDF will be reduced with the help of a PR. The reference to calculate , the PR in this iteration process will be the power set point defined via the PDF. , When the required power exceeds the maximum power the PR is calculated by taking the ratio between the part of the maximum power that can be assigned to the power set point, thus taking into account the inertia power of the rotating components and the required power set point (19)
2For electric components, the power limit is mainly due to the multiplication of a voltage limit and a current limit. Furthermore, the two limits also exist separately. In the latter case, the voltage or current limit, respectively, is multiplied with the required current voltage.
VAN MIERLO AND MAGGETTO: INNOVATIVE ITERATION ALGORITHM FOR A VEHICLE SIMULATION PROGRAM
9
The possible power set point is the remaining part of the maximum torque that is not assigned to the inertia torque (20)
B. Iteration Sequence
IE E Pr E oo f
There is no need to have an attenuation of the PR, as there is for the AR, due to the fact that there is a better linear relation between PDF and power. Only when the efficiency of a component changes very much (e.g., from 80 to 30%) during the iteration process that an unstable iteration process can possibly occur. At this moment, the user has the possibility to attenuate the PR. c) Acceleration subsystem: Power reduction: Also similar to the torque limitation in the acceleration subsystem due to a too-high torque set point, a PR is required for a power limitation. In, e.g., the series hybrid drivetrain, the battery power is defined by the traction power (resistive and acceleration power) plus the power delivered by the generator. The battery is a component of the acceleration subsystem and the generator is a part of the power subsystem. When the battery voltage becomes too high during regenerative braking, one can first decrease the generator power set point and, afterward, when the battery voltage is still too high, one can implement an AR to reduce the electric regeneration braking. d) Power subsystem: Acceleration reduction: When a power limit happens in the power subsystem, only the PDF will be reduced via the PR and the vehicle acceleration will never be reduced via an AR.
The order of a hybrid system is the number of different subsystems necessary to build the drive system [23]. In the case of an electric or thermal vehicle, there is only one motor or engine driving the vehicle. These drivetrains are from the first order. Also, fuel cell vehicles without a battery are first order systems. A parallel hybrid built up with one engine and one motor is a second order hybridization as well as a series hybrid–electric vehicle containing a battery and another energy source. When a peak power unit, such as a flywheel or supercapacitor, is next added to the generator and battery, the vehicle is from the third order. All complex hybrid drivetrains are third or higher order systems. A combined hybrid drivetrain (e.g., Prius) can also be seen as a third order hybridization. Although there are only two energy sources, there are three subsystems: the engine, the generator, and the electric motor. All three are mechanically connected to the wheels. Next to the definition of the system order, one can define the iteration sequence for each system. The iteration process is very complex. A PR can change the PDF or the AR can reduce the acceleration. Which one has to be implemented first makes part of an intelligent iteration sequence. 1) First Order System: In the case of a first order system, e.g., battery electric vehicle or conventional vehicle with an internal combustion engine (ICE), the only way to keep the operating points within limits is by controlling the acceleration. Only an AR will be used and no iteration sequence is required. 2) Secnd Order System: In a second order hybrid system, different limitations can occur simultaneously, but are not allowed to reduce the corresponding ARs or PRs at the same time.
Fig. 5. Iteration sequence and end of iteration flowchart.
For example, it can be possible that by reducing the acceleration due to a limit of a component of the acceleration subsystem, the power limit in the power subsystem is already solved or vice versa. Should they be implemented in the iteration process at the same time, this would result in a nonrequired reduction of PDF. An iteration sequence is necessary, illustrated as follows. 1) When a limit occurs in the acceleration subsystem, it is sensible to first change the PDF to reduce in this way the, e.g., generator power, before reducing the vehicle acceleration. 2) Once the PDF has no longer has an effect on the limit in the acceleration subsystem, a further reduction of the operating point can be obtained with an AR, which will reduce the possible acceleration and, hence, the corresponding acceleration torque and power. Once the vehicle acceleration is known, the acceleration of the components of the power subsystem is identified. This acceleration corresponds with a torque and power due to inertia. In the power subsystem, the total required torque can exceed the maximum torque and a PR is implemented. Should this PR
10
IEEE TRANSACTIONS ON VEHICULAR TECHNOLOGY, VOL. 53, NO. 2, MARCH 2004
TABLE II SPEED CYCLE: SIMULATION VERSUS MEASUREMENTS
Fig. 7. Acceleration simulation versus measurement.
IE E Pr E oo f
be introduced to control the vehicle acceleration and power flow. When the user has selected to first reduce the PDF and afterward the acceleration, the “sequence” Boolean is true. When all ARs and PRs equal one, the iteration process stops. C. Front Panel of the “Iteration Algorithm .vi”
Fig. 6. Front panel of “Iteration Algorithm .vi.”
be applied before the vehicle acceleration is known, then the PR would be calculated on the basis of an inertia power, which would correspond to an unattainable acceleration. Hence, the PR would be too high. These last two steps (2 and 3) have to be repeated until the entire reduction equals one (all working points are within limits). Should the first step be repeated also, then it could be possible that one gets two conflicting power reductions: one from the power subsystem (e.g., decreasing PDF due to lack of engine power) and another from the acceleration subsystem (e.g., increasing the PDF due to a lack of battery power). At this moment, the power subsystem reduction would have priority. It is clear that this iteration sequence gives priority to an optimal vehicle performance at the expense of the, e.g., APU operating point (first reducing the PD, then the acceleration). However, the user can find it more important that the APU operating point dominates vehicle performance. One can, for instance, choose to operate the APU at a constant working point, even when this means slower vehicle acceleration or less regeneration of braking energy. For this reason, one can select the iteration sequence on the front panel of the model of each hybrid vehicle. With the help of the flowchart in Fig. 5, the above-described iteration methodology can be summarized. Based on the speed-cycle requirements, the input of the drivetrain is calculated. Within the drivetrain, different ARs and PRs can
Fig. 6 illustrates the front panel of the “iteration Algorithm .vi”. On the top, one can find the power-control criteria or iteration-sequence selection. Three indicators (LEDs) specify the position of the iteration process. In the middle, one can find the required and reduced acceleration and PDF 1 and 2, as well as the iteration accuracy, threshold levels, and maximum number of iterations. In the middle of the figure, the three iteration clusters, which are controlling the iteration process, can be found. At the bottom of Fig. 6, in the graph, the results of the iteration process converging toward the possible solution are illustrated. V. VALIDATION
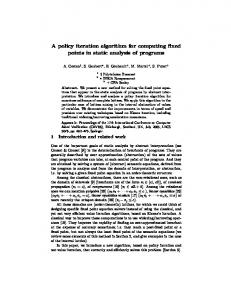
As for each simulation software, a validation process is necessary. The example chosen here is an onroad driven Europeant-type approval (ECE) cycle performed by an electric passenger car. This car is equipped with a directional coupler (DC) separated excited motor and an NiCd battery. Since the real speed can differ from the theoretical ECE speed, the speed is measured during driving and is used as an input file for VSP. Hence, the same cycle is simulated as the one that is driven on the road. The comparison of both simulated and measured parameters demonstrates a good correlation (see Table II). The relative error is less than 5%. One of the most difficult experiments to simulate is an acceleration test. Contrary to a comparison based on a predefined speed cycle, one is not performing a straightforward step-by-step calculation, but for each point the simulation has to iterate toward the possible working point. A small error in the beginning can, due to integration, result in a large deviation at the end of the simulation. In Fig. 7, one can find the measured speed compared with the simulation results when the acceleration of the vehicle is at
VAN MIERLO AND MAGGETTO: INNOVATIVE ITERATION ALGORITHM FOR A VEHICLE SIMULATION PROGRAM
Fig. 8.
11
Deceleration simulation versus measurement.
Fig. 10.
Battery voltage and current.
IE E Pr E oo f
ponent. Engine-to-wheel or forward VSPs that contain several feedback loops, which sometimes makes them slower. In this paper, a comprehensive iteration algorithm is described, allowing us to combine backward and forward simulation techniques. The algorithm is able to handle all kind of working limits of all types of components in different types of drivetrains. Furthermore, complex power-management strategies in hybrid vehicles can be evaluated. The unique iteration algorithm is also dedicated for the flexible implantation of a different kind of hybrid drivetrain topologies and power-flow control algorithms taking into account the component operating boundaries or desired operating conditions. It has an indepth worked-out program modularity in which nearly all parameters are only accessible in the module of the component itself. It has a flexible database structure, integrated in the component models, allowing an easy implementation of a different kind of component description, in the form of lookup tables, maps, theoretical equations, and empirical formulas, in function of the available data. Nevertheless, the approach is principally based on a backward approach; due to the iteration algorithm, the simulation is also able to mimic the actual driving of the vehicle with a driver and controllers, as is done in forward simulation programs. A good correlation between measurements and simulation results is found, which demonstrates high simulation accuracy. To conclude, it should be noticed that once all components are able to deliver the required power and follow the speed cycle, no iteration is required and fast simulation is possible. When the desired performance (torque, speed, or power) exceeds the maximum available performance in the system, the iteration algorithm allows us to calculate this maximum performance with a very high accuracy and without double modeling.
Fig. 9. DC motor current and voltage comparison.
its maximum. The boundaries of the motor are the maximum speed and torque. This motor was current controlled. A current limit (as a function of the revolutions per minute) is also introduced. Simulated values are marked with “ s” and measured values with “ m.” The good correlation between the measurement and the simulation demonstrates the performance of the iteration algorithm. An average deviation of 2% is found. In Fig. 8, one can see the deceleration test. During this test, only regenerative braking by the motor was performed, without using any mechanical brakes. The graph of Fig. 9 compares the DC motor current (Imot) and DC voltage (Umot) for the acceleration and deceleration tests. The small deviation in current can be explained by a possible minor wind and road inclination during the onroad measurement. The graph of Fig. 10 shows, for the same acceleration test, the variations in current (Ibat) and voltage (Ubat) of the battery. VI. CONCLUSION
For years, the automotive industry and several research institutes have developed simulation models to evaluate vehicle performance, fuel consumption, and emissions. Most wheel-to-engine or backward simulation programs do no have an iteration algorithm. Some use algorithms to limit the actual performance when the desired performance (torque, speed, power) exceeds the maximum available performance in the system. However, as stated in this paper, without an closed— loop iteration process, the results are less accurate due to the fact that, e.g., the efficiency of downstream components is calculated with parameters that do not take into account the available best performances of the upstream components. Additionally, these hybrid backward/forward algorithms require two models for the same com-
REFERENCES [1] J. Van Mierlo, “Simulation software for comparison and design of electric, hybrid electric and internal combustion vehicles with respect to energy, emissions and performances,” Ph.D. dissertation, Dept. Elect. Eng., Vrije Universiteit, Brussels, Belgium, Apr. 2000. [2] , “Influence of driving behavior on traffic emissions: Quantification and measures,” Ministry of the Flemish Community, Dept. Environ. Infrastructure (AMINAL), division General Environmental and Nature Policy. Partner: TNO , Tech. Rep., 2001.
IEEE TRANSACTIONS ON VEHICULAR TECHNOLOGY, VOL. 53, NO. 2, MARCH 2004
[3]
[4]
[5]
[6] [7] [8]
[9]
[10] [11] [12]
[13] [14] [15] [16]
[17]
, “Modular simulation of environmental, energetical and mobility aspects of traffic policies,” DWTC, Federal Services for Scientific, Technical and Cultural Matters. Partner: TRITEL , Tech. Rep., 1998–2000. , “PRAZE: Personal zero emission transport for the city of the future,” 5th Framework Programme of the E.C. Partners: PML Flightlink (GB), Peugeot Motocycles (F), Sorapec (F), Vrije Universiteit Brussel (B), and CITELEC (B), Tech. Rep., 1999–2002. , “Development and on-road testing of a natural gas-electric hybrid city bus prototype with extra low emissions,” Contract TAUT-CT920007, Com. Eur. Communities. Partners: ALTRA SpA, TNO Road Veh. Inst., Tech. Rep., 1993–1995. , “Reduced energy consumption and environmental impact from road vehicles through the development and implementation of simulation tools,” Tech. Rep., JOULE-THERMIE; DG-XII, 1995–1998. J. Van Mierlo and G. Maggetto, “Vehicle simulation programme,” in Proc. Autotech, I-Mech-E AU: PLEASE PROVIDE PAGE NUMBERS —ED., Birmingham, U.K., Nov. 1995. , “How to compare and evaluate electric and thermal vehicles?,” in Proc. EPE-97 AU: PLEASE PROVIDE PAGE NUMBERS —ED.. Trondeim, Norway: Norwegian Univ. Science and Technology, Sept. 1997. J. Van Mierlo, B. Kamba Bimbi, and G. Maggetto, “Comparison of different power flow control algorithms in hybrid vehicles,” in Proc. EVS-15 AU: PLEASE PROVIDE PAGE NUMBERS —ED., Brussels, Belgium, Oct. 1998. J. Van Mierlo and G. Maggetto, “Simulation of a complex parallel-series hybrid drive train,” in Proc. EVS-16 AU: PLEASE PROVIDE PAGE NUMBERS —ED., Beijing, China, Oct. 1999. , “Views on hybrid drivetrain power management strategies,” in Proc. EVS-17 AU: PLEASE PROVIDE PAGE NUMBERS —ED., Montreal, QC, Canada, Oct. 15–18, 2000. , “Vehicle simulation program: a tool to evaluate hybrid power management strategies based on an innovative iteration algorithm,” Proc. Inst. Mech. Eng. Part D—J. Automobile Engineering AU: PLEASE PROVIDE PAGE NUMBERS —ED., vol. 215, no. D9, pp. 1043–1052, 2001. SIMPLEV, Simulation of Electric and Hybrid Vehicles. Idaho Nat. Eng. Environ. Lab., ID 83415, Idaho Falls. Available: http://ev.inel.gov/simplev/desc.html [Online] Electric and Hybrid Vehicle Simulation Programme. University of Hawaii, Honolulu. Available: http://eve.ev.hawaii.edu/Simulation/HEVST/about.html [Online] “Development of a hybrid vehicle performance emissions and efficieny model. Final report, SwRI IR&D project 03-9788,” Southwest Research Institute, Detroit, MI, June 1995. Using an advanced vehicle simulator (advisor) to guide hybrid vehicle propulsion system development. National Renewable Energy Laboratory (NREL). Golden, CO. Available:, K. B. Wipke. (1998). http://www.ctts.nrel.gov/analysis/documents/NESEA/ [Online] R. Noons, J. Swann, and A. Green, “The use of simulation software to asses advanced power trains and new technology vehicles,” in Proc. EVS-15 AU: PLEASE PROVIDE PAGE NUMBERS —ED., Brussels, Belgium, Oct. 1998.
[18] P. Mauracher, “System-optimization of the drivetrain of electric vehicles to reduce the energy consumption,” in Proc. EVS-13 AU: PLEASE PROVIDE PAGE NUMBERS —ED., Osaka, Japan, Oct. 13–16, 1996. [19] J. Swann, “Reduced energy consumption and environmental impact from road vehicles through the development and implementation of simulation tools,” Tech. Rep. TR3 of WP3 Systems modeling, Fleets Energy Programme, JOULE (JOE3960031). Motor Industry Research Association Ltd, Nuneaton-Warwickshire, U.K., 1998. [20] J. W. Biermann, “Innovative modular computer program for calculation of vehicle—Longitudinal dynamics,” in Proc. Conf. Vehicle Dynamics and Power Train Engineering AU: PLEASE PROVIDE PAGE NUMBERS —ED.. Strasbourg, France, June 1991. [21] T. Markel et al., “ADVISOR: A systems analysis tool for advanced vehicle modeling,” J. Power Sources, vol. 110, no. 2, pp. 255–266, 2002. [22] K. B. Wipke et al., “Advisor 2.1: A user-friendly advanced power train simulation using a combined backward/forward approach,” IEEE Trans. Veh. Technol., vol. 48, pp. 1751–1761, Nov. 1999. [23] J. Beretta, “New classification on electric-thermal hybrid vehicles AU: PLEASE PROVIDE PAGE NUMBERS —ED.,” in Proc. EVS-15, Brussels, Belgium, October 1–3, 1998.
Joeri Van Mierlo received the AU: PLEASE PROVIDE TYPE OF DEGREE —ED. in electromechanical engineering and the Ph.D. degree with greatest distinction from Vrije Universiteit Brussels (V.U.B.), Brussels, Belgium, in 1992 and 2000, respectively. His dissertation was entitled “Simulation Software for Comparison and Design of Electric, Hybrid Electric and Internal Combustion Vehicles with Respect to Energy, Emissions and Performances.” As a Research Assistant in the Department of Electrical Engineering, V.U.B., he was in charge of several national and international research projects, mainly regarding the testing and evaluation of electric and hybrid–electric vehicles. He was engaged in different boards of the V.U.B., as well as in several demonstration and PR projects of CITELEC and AVERE, European scientific association hosted by the University on the bases of contracts. Currently, his research interests include traffic and emissions models, as well as the comparison of the environmental damage of vehicles with different kinds of drivetrains and fuels.
IE E Pr E oo f
12
Gaston Maggetto AU: PLEASE PROVIDE BRIEF BIOGRAPHY AND AUTHOR PHOTO IN EITHER .TIFF, .EPS, OR .PS FORMAT, AT 220 DPI —ED.