Plant and Soil 263: 297–309, 2004. © 2004 Kluwer Academic Publishers. Printed in the Netherlands.
297
Integrated effect of irrigation frequency and phosphorus level on lettuce: P uptake, root growth and yield G. Xu1 , I. Levkovitch2, S. Soriano2 , R. Wallach3 & A. Silber2,4 1 College
of Resources and Environmental Sciences. Nanjing Agricultural University, Nanjing, 210095, China. of Soil, Water and Environmental Sciences, Agricultural Research Organization, The Volcani Center, Bet Dagan, 50250, Israel. 3 The Seagram Center for Soils and Water Sciences, Faculty of Agricultural, Food, and Environmental Quality Sciences, The Hebrew University of Jerusalem, Rehovot 76100, Israel. 4 Corresponding author∗
2 Institute
Received 4 August 2003. Accepted in revised form 11 December 2003
Key words: fertigation, phosphorus uptake, quartz sand, root length, root/shoot ratio, transpiration flux
Abstract The objective of the present research was to assess the effects of fertigation frequency on plant phosphorus and water uptake. Special attention was given to root measurement in order to elucidate the mechanism that relates the fertigation frequency to P uptake and plant growth. Lettuce (Lactuca sativa L., cv. Iceberg) grown in pots filled with quartz sand was chosen as a test plant. The experiment comprised six treatments, with two concentrations of P in irrigation water (0.2 mM and 1.0 mM), and three daily fertigation frequencies (one, four and ten). It was found that high irrigation frequency induced a significant increase in plant-P concentration at low solution-P concentration, whereas at high P concentration the effect of irrigation frequency was insignificant. Increasing the irrigation frequency significantly enhanced the transpiration flux so that the transpiration flux of plants under low irrigation-P level at 10 daily irrigation events was similar to that of plants under high solution-P. The increases with irrigation frequency of P concentration in lettuce organs and of P influx to the roots, at the low P level, were attributed to the elimination of the depletion zone at the root-soil interface by the supply of fresh nutrient solution, and the enhancement of P uptake. The higher P uptake resulted from higher convective flux of dissolved P from the substrate solution to the root surface owing to the higher average moisture content associated with frequent irrigation. The only significant correlation revealed by multiple stepwise regressions relating nutrient concentrations in the plant to yield was that between plant-P concentration and the yield. On the basis of a quadratic regression, 97% of the dry weight variation could be explained by differences in P uptake, indicating that the main effect of fertigation frequency was related to an improvement in P mobilization and uptake. Thus, frequent irrigations may compensate for P shortage.
Introduction Phosphorus, an essential nutrient for plant production is a non-renewable natural resource that is produced from mineral deposits and continuously depleted over years of use. The annual global phosphate production at the end of the millennium approached 40 million tons of P2 O5 , produced from 150 million tons of rock (Harris, 1998). The estimated global phosphate re∗ FAX No: 972-3-9604017. E-mail:
[email protected]
serves amount to 4000–8000 million tons of P2 O5 (Cathcart, 1980; Steen, 1998), and therefore, even an underestimate of the global annual growth of P consumption indicates that within 60–70 years about half of the world P resources will be depleted (RungeMetzger, 1995; Steen, 1998). The expected depletion of P resources will probably lead to declining quality of the P resources used, accompanied by increased quantities of waste material produced during the industrial process and, consequently, to higher prices. While some European countries have recently applied
298 limits to heavy metal – especially cadmium – levels in fertilizers (Steen, 1998), the declining quality of P ores in the future may further increase the heavy metal contaminants. In many case nutrients deficiency is prevented by increasing their concentrations in the irrigation water to levels that ensure maximum uptake by plants. Thus, the nutrient concentrations in the rhizosphere may be high or even excessive immediately after irrigation and may fall to deficit levels as time proceeds as a result of adsorption on the solid phase and precipitation of insoluble compounds. Hence, reducing the period between following irrigations, e.g., applying frequent fertigations to supply nutrients at rates that match the plant requirements throughout the potential photosynthesis cycle, may reduce the quantities of fertilizer needed to achieve optimal production and, at the same time, minimize the ecological damage. In modern agricultural systems, especially under arid or semi-arid conditions, or in greenhouses where artificial substrates are used, water and nutrients are supplied simultaneously (fertigation), mainly by drip irrigation devices (Bar-Yosef, 1999). The general wish to increase crop yields has led to frequent fertigation and, therefore, the time intervals between successive fertigation events has diminished to hours, or even less. Solute transport to the root surface takes place by both convection (with the water flow drawn by transpiration) and diffusion (along the concentration gradient created by the active uptake). The restricted root zone of fertigated plants grown in soilless culture in greenhouses and the frequent supply of water and nutrients usually practiced in such systems induce high water fluxes from the medium to the root surface, compared with those in traditional systems of soil-grown plants, in which the intervals between irrigations is longer and nutrients are supplied independently. Therefore, the relative contribution of convection to the nutrient uptake of fertigated plants is much higher than that of diffusion, in contrast to the situation of non-fertigated soil-grown plants, in which diffusion is considered to be the significant mechanism (Barber, 1995; Claassen and Steingrobe, 1999). The simultaneous application of irrigation water and nutrients, together with the high values of saturated hydraulic conductivity for container media ensure that the root surface and its vicinity are frequently supplied with fresh nutrients in solution during the irrigation events and the subsequent redistributions. These frequent replenishments eliminate the depletion zone formed at the root surface by uptake of nutrients
during the period between successive irrigation events, decrease the concentration gradient between the medium solution and the root interface, and diminish the role of diffusion in nutrient transport toward the roots. We demonstrated previously that a fertigation frequency increase induces a significant increase in plant yield, mainly at low nutrient concentrations (Silber et al., 2003). Yield improvement was primarily related to enhanced uptake of nutrients, especially P. In the present study we focused on the effect of fertigation frequency on plant phosphorus and water uptake. Special attention was given to the effect of fertigation frequency on root growth, in order to elucidate the mechanism that relates the fertigation frequency to P uptake and plant growth.
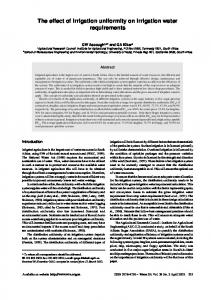
Materials and methods Plant growth condition The experiment was conducted in a screen house (10% shade) at the Volcani Center, Israel from April 2 to May 15, 2002. During the entire growing period, the day and night air temperatures varied between 14 and 30 ◦ C and 13 and 20 ◦ C, respectively, with 100– 200 W m−2 of daily mean irradiance inside the screen house. There was no rainfall during the growth period. Variations of irradiance, relative humidity and air temperature during a representative day, when the rate of growth was accelerated at the end of the growth period are presented in Figure 1. Each seedling of lettuce (Lactuca sativa L., cv. Iceberg) was transplanted in a 10-dm3 plastic pot (25cm height × 23-cm diameter) filled with quartz sand at a density of 1.58 kg dm−3 . The moisture content distribution along the container height was measured after complete free drainage took place following saturation of the substrate and is shown in Figure 2. The container capacity at that stage (before further drying was allowed) was 0.136 dm3 dm−3 . The experiment comprised six treatments (3 × 2) with two concentrations of P in the irrigation water (0.2 mM and 1.0 mM, designed as P1 and P2, respectively), and three daily fertigation frequencies (one, four and ten, designed as I1, I2 and I3, respectively), allocated to five randomized blocks. Each replicate included a total of 10 pots with plants and two pots without plants, all of which were placed on the same bed and individually irrigated with nutrient solution via two drippers located on the sand surface.
299 EDTA-based. The initial pHs of the irrigating solutions with P1 and P2 were 7.0 ± 0.1 and 6.9 ± 0.1, respectively. The irrigating solutions were prepared in two 2500-L tanks for the respective concentration of P. An identical daily amount of irrigation water was used in all treatments. Pressure-compensated drippers supplying 2.0 L h−1 (Netafim Inc., Israel) were used. The irrigation scheduling, which was automatically implemented by a computer was: at 06.00 for the I1 treatment; at 06.00, 09.00, 12.00 and 15.00 for the I2 treatment; and every hour from 06.00 to 15.00 for the I3 treatment. The daily irrigation volumes per plant were 500 mL during days 1–32 after transplanting (DAT) and 700 mL during days 33–43 DAT, with excess at least equal to the evapotranspiration. Monitoring of medium moisture content and change of pot weight induced by irrigation and plant growth
Figure 1. Irradiance, relative humidity and air temperature during a representative day at the end of the experiment.
In each of the six treatments in the middle block, two pots were selected for continuous monitoring of the medium moisture content and pot weight change. Two tensiometers were installed horizontally 5 and 10 cm, above the bottom of each of the 12 pots. These pots were placed on a weight-recording scale (1040 TadeaHuntling, Israel). The drainage rate from each of these pots was measured with tipping buckets (Pronamic Co., Ltd., Denmark). Water suction and pot weight were measured every 10 s, and the values averaged over 5-min time intervals were stored in a data logger (Criox Campbell Sci., Utah, USA). The frequent readings of the pot weight and water tension in the medium enabled close tracking of the variation of these quantities with time during the course of the growth period. Monitoring leaf and root temperatures, radiation and humidity
Figure 2. Water content of the sand substrate as a function of the negative pressure head.
Nutrients and irrigation The N and K concentrations were 13.5 mM (constant NO3 -N/NH4 -N ratio of 3:1) and 6 mM, respectively in all six treatments. The tap water contained (mg L−1 ): 80 Ca, 34 Mg, 104 Na, 150 CO3 , and 150 Cl. Micronutrient concentrations (mg L−1 ) applied were: 0.6 Zn, 0.65 Mn, 0.8 Fe, 0.04 Cu, 0.4 B, and 0.03 Mo, all
During 26–43 DAT, the leaf-temperature variations in treatments I1P1, I1P2, I3P1 and I3P2 were measured, together with the sand medium (roots) temperatures in treatments I1P1 and I3P1; the measurements were made on two sun-exposed outer leaves of two different plants in each treatment. The temperature sensors in the medium were inserted 5 cm above the pot bottom. The air temperature, humidity and radiation intensity in the screen house were recorded every 15 min during this period, by two phytomonitor stations (LPS-03MA Phytomonitor Station, PhyTech Ltd., Israel).
300 Sampling of irrigating solution, leachate and lettuce canopy and roots Irrigating solution and leachate from the pots, with and without growing plants, were collected once a week and monitored for changes in volume, EC, pH and nutrient concentrations. Transpiration was calculated from the difference between leachate volumes of the pots with and without plants. One plant of each treatment was sampled at 12, 19, 26 and 33 DAT, respectively. The plants were removed from the pots by carefully sliding out the most of the root mass, and the complete fresh head was weighed immediately after sampling. Then the substrate, containing the residual part of the roots was immersed in a large water-filled container and shaken thoroughly in order to free the roots to float in the upper water phase, from which they were collected. All the collected roots were sprayed with water to remove as much sand as possible. Sieves of 2.0, 0.5 and 0.1 mm mesh sizes were used to prevent the loss of fine roots. After weighing, the entire root system of each plant was cut with scissors into about 1-cm segments and 0.30 g of randomly sampled fresh roots were placed in a 50mL tube containing 35% ethanol solution. The lettuce head and the rest of the roots were dried in an oven at 60 ◦ C, and ground for chemical analysis. The calculations of the plant water content were based on their fresh and dry weights. The remaining six plants of each treatment were harvested 43 DAT by separating the outer leaves that were fully or partially exposed to the sun and the inner leaves that were fully folded in the head center. Measurement of root geometry characteristics by image analysis Measurement of root geometry characteristics was performed as described in Costa et al. (2000) with minor modifications. Briefly, we used DELTA-T Scan (DELTA-T Devices Ltd., Cambridge, UK), an interactive scanner-based image analysis of root samples. Scans could be analyzed immediately or stored as TIFF files. A Microsoft Windows-based PC, Pentium 100 system, with 32 MB RAM, and a Hewlett-Packard scanner (ScanJet 3c), set to 300 dots per inch scanning resolution was used in the present experiment. Each root sample of 0.30-g FW was stained for 15 min with 0.1% (w/v) toluidine blue just prior to analysis. The roots were placed in the Plexiglas trays (200 by 300 mm) with a 4-mm layer of water. A preliminary measurement demonstrated that the 0.3-g FW
sample of lettuce roots resulted in a minimum amount of crossing over and overlapping, while requiring only a short time for analysis. Measurements of leaf photosynthesis rate, leaf stomatal conductance and chlorophyll content Photosynthesis in the leaves was measured at 36 DAT by a photosynthesis system (instrument model: CI510, CIDD Inc., USA). In each treatment, nine sunexposed, fully expanded leaves, one from each of nine plants (1 leaf per plant × 3 plants per block × 3 blocks) were monitored. The measurements were conducted in two to four cycles, continuously from 1000 to 1400, the period of radiation saturation. Stomatal conductance of leaves was measured at 37 DAT with a steady-state porometer (model LI1600, Li-COR Inc., USA). The same leaves that had been used for photosynthesis measurement, as described above, were used for the measurement of leaf conductivity. The measurements were also conducted in two to four cycles, continuously from 1000 to 1400. The chlorophyll of the sun-exposed fully expanded leaves was extracted with N,N-dimethylformamide and determined at wave lengths of 647 and 664.5 nm with a spectrophotometer (UV-Visible model DMS 100) fitted with a cuvette having a path length of 1-cm. The concentrations of chlorophyll a and b and total chlorophyll were calculated as described by Inskeep and Bloom (1985). Chemical analysis methods Plant leaves and roots were digested by the H2 SO4 H2 O2 method, for N, P and K analysis. A Quikchem Automated Ion Analyzer (LACHAT Instruments, USA) was used to determine the solution NO3 N content by the diazotizing colorimetric method, its NH4 -N and plant total organic N contents by the indophenol-blue colorimetric method, and the solution and plant total P contents by the molybdenum blue colorimetric method. Solution and plant K contents were determined by flame emission spectrometry. Plant leaves were digested by the HNO3 -HClO4 method and analyzed for Ca, Mg, Na, Zn, Mn, Fe, Cu, B and Si by ICP (ICAP61E Trace Analyzer, USA). Free nitrate in the dry leaf powder was extracted by deionized water with weight ratio of 3/1 (water/leaves), vigorously shaken for one hour at room temperature. The extractant was filtered and diluted 10 times by deionized water before measurement by a nitrate/nitrite meter (Merck RQflex).
301 Statistical analysis and calculations Differences between means were tested with the standard least squares mode of ANOVA, followed by a Tukey pair-wise comparison by means of the JMP software (SAS Institute, 2002). Differences with probability larger than 95% were taken as significant. Ion speciation in leachate solutions was calculated with the MINEQL+ software (Schecher and McAvoy, 2002).
Results Plant growth and yield Lettuce fresh weight (FW) increased in the course of time (Table 1). Increasing the solution-P concentration from 0.2 to 1.0 mM significantly increased the canopy yield as early as 12 DAT (Table 1) for all irrigation frequencies. Increasing the P concentration in the irrigation water increased the canopy FW at the end of the experiment by 49, 15 and 25% in the I1, I2 and I3 treatments, respectively. The effect of irrigation frequency on lettuce growth was statistically smaller than that of P concentration (except for 12 DAT, Table 1). Increasing the daily irrigation frequency from one to four (I1 and I2, respectively) at the low solution-P level increased the FW at the end of the experiment by 29%, but a further increase of daily irrigation frequency to 10 had no significant effect on the yield. Note that irrigation frequency had a negligible effect on yield in the high-P treatments, except in the early growth stages (12 DAT). The lettuce-head water content was relatively high throughout the experiment (96 ± 0.06 g per 100 g DW), independently of irrigation frequency or P level (not presented).
Figure 3. Root/shoot ratio of lettuce plants: (a) P1 plants during the growth period; and (b) P1 and P2 plants at the 33rd day after transplanting (DAT). Vertical bars indicate the standard error (not shown where their size was smaller than the symbol).
(Barber, 1995; Bates and Lynch, 2001; Claassen and Steingrobe, 1999; Itoh and Barber, 1983; Raghothama, 1999). Low irrigation frequency (I1) tended to decrease the root fresh weight and length, especially at the low P concentration; however, this effect was statistically less significant than the P effect (Table 2). The root length per root unit fresh weight was not affected by the irrigation frequency.
Root fresh weight and length
Root/shoot ratio
The root FW significantly increased with increasing solution-P concentration (except at 19 DAT, Table 2). A similar trend was observed for the total root length, although it was significant only for the 26 DAT measurements. The root FW response to solution-P concentration was stronger than that to the root length (Table 2). Therefore, the root unit length (m/g root FW) of plants irrigated with higher P concentration was shorter than that of plants irrigated with lower P concentration, which indicates that plants irrigated with lower P concentration had thicker roots. This is a known and useful reaction of a plant to P deficiency
The upper part of the plants grew faster than the roots, resulting in a decline of the root/shoot ratio (g g−1 FW) (only data for the low P level are included, Figure 3a). The root/shoot ratio fell significantly as the P concentration in the irrigation water increased from 0.2 mM to 1 mM (only data for 33 DAT are presented, Figure 3b). This type of root/shoot ratio dependence on the irrigation water P concentration matches the findings of Lynch and Brown (1997); Marschner (1995); Plaxton and Carswell (1999); and Raghothama (1999). The effect of irrigation frequency on the root/shoot ratio was smaller than that of P
302 Table 1. The effects of irrigation frequency and P level on top fresh weight accumulation during the growth season (sampling at 12, 19, 26, 33 and 43 DAT) FW (g/plant) 12
19
26
33
43
I1P1 I2P1 I3P1 I1P2 I2P2 I3P2 LSD0.05
4.1 4.4 5.4 4.9 5.2 7.6 1.11
12.2 16.3 17.2 19.8 20.1 22.9 5.67
35.0 40.4 51.4 68.5 62.6 81.2 12.81
102.8 138.5 148.1 173.6 173.8 189.9 46.37
270.3 347.8 360.3 402.7 399.2 449.3 76.02
Mean of irrigation I1 I2 I3
4.5 4.8 6.5
16 18 20
52 52 66
138 156 169
336 373 405
Mean of P P1 P2
4.6 5.9
15 21
42 71
130 179
326 417
∗∗∗
ns
∗∗
ns
∗∗∗
∗∗∗
∗∗
∗∗∗
∗∗∗
∗∗∗
ns
ns
ns
ns
∗
Source of variation Irrigation P Irrigation ∗ P
∗ , ∗∗ , ∗∗∗ Significant at P ≤ 0.05, 0.001, and 0.0001, respectively; ns
– not significant.
concentration, except in the early stage of growth, at 12 DAT. The reasons for the decreasing effect of irrigation frequency on root FW with passing time (Figure 3a) could be: (i) at the early growth period the roots were mainly located at the top of the pots and were more sensitive to the drying and rewetting processes; and (ii) the young roots in the early stages were mostly active roots, whereas in the later stages part of the roots became inactive and probably masked the measurements. Accumulation of phosphorus and other nutrients in lettuce organs Leaf- and root-P concentrations increased in the course of the growth period, for both solution-P levels (Figure 4). Increasing the irrigation frequency at low P level notably enhanced plant-P concentrations, whereas at high solution-P level the effect of irrigation frequency was insignificant (Figures 4a and b). The phosphorus concentration in the fully folded inner leaves was significantly higher than that in the outer leaves, the mature part of the lettuce (Figure 4c). The
reduced leaf-P concentrations in the outer leaves were probably a result of P translocation from the mature organs toward newly growing inner leaves The phosphorus concentration in the irrigation water had a significant effect on P accumulation in the lettuce head during the growth period (Figure 5a) and on P influx to the roots (Figure 5b), whereas irrigation frequency affected these variables only in the low-P treatments. The P influx rate (mg (km root)−1 d−1 ) of P1 plants was considerably increased as daily irrigation frequency increased in the course of the growth period (only 33 DAT is presented in Figure 5b). Irrigation frequency had a lower effect on P influx to the roots in the P2 treatments. Total N and NO3 -N concentrations in the outer and inner leaves significantly decreased as the solution P level increased, and were not affected by the irrigation frequency (Table 3). However, this decrease probably stemmed from a dilution effect, since the total N quantities accumulated in P2 plants were higher than those in P1 plants and the leaf-N concentrations of P2 plants were within the adequate range for lettuce growth (Jones et al., 1991). Alternatively, since nitrate
303 Table 2. The effects of irrigation frequency and P level on root fresh weight, and total root length during the growth season (sampling at 12, 19, 26 and 33 DAT) Treatments
FW (g/plant)
Total length (m/plant)
12
19
26
33
19
26
33
I1P1 I2P1 I3P1 I1P2 I2P2 I3P2 LSD0.05
2.5 2.5 2.4 2.7 2.6 3.3 0.55
4.9 6.1 5.5 5.7 5.3 6.3 1.25
12.0 12.8 14.1 17.2 16.5 20.4 4.29
21.3 25.7 25.5 26.7 29.0 30.2 6.32
41 49 47 45 41 49 6.6
101 104 110 116 126 145 19.9
197 257 232 246 243 265 39.9
Means of irrigation I1 I2 I3
2.6 2.5 2.8
5.3 5.7 5.9
15 15 17
24 27 28
43 45 48
109 115 128
221 250 249
Means of P P1 P2
2.4 2.9
5.5 5.8
13 18
24 29
45 45
105 129
229 251
ns
ns ns
∗
ns
∗
∗∗∗
∗
∗∗∗
∗
ns
∗∗∗
ns
∗
ns
ns
∗
∗∗
Source of variation Irrigation P Irrigation ∗ P
Ns Ns Ns
∗ , ∗∗ , ∗∗∗ Significant at P ≤ 0.05, 0.001, and 0.0001, respectively; ns – not
significant.
has a role in the turgor regulation in lettuce leaves, the decreases in leaf NO3 -N concentrations may have resulted from variations in the contents of soluble sugars and organic acids in the leaves, as suggested by Buwalda and Warmenhoven (1999). The decreases in leaf (outer and inner)-Mn concentrations in P2 plants probably resulted from decreasing Mn availability in the rhizosphere, caused in turn by precipitation of Mn-P compounds in the substrate. Leaf-K, -Ca, -Mg, -Zn and -Fe concentration were within the appropriate ranges for normal lettuce growth (Jones et al., 1991). Leachates chemical composition The average NH4-N concentration in the leachate from the unplanted pots over the growth period was 0.5 ± 0.04 mM compared with 3.4 mM in the irrigating solutions. As the NH4 -N concentration decreased, the NO3 -N concentration simultaneously increased, keeping the total N concentration in the leachate from the unplanted pots almost equal to that in the irrigation water. The reduction of NH4 -N concentration in the unplanted pots is attributed to nitrification processes. The NH4 -N concentrations in the leachate from the
planted pots over the growth period were lower than those in the unplanted pots (average of 0.4±0.04 mM), indicating that in addition to the nitrification processes there was uptake of NH4 -N by the plants. The averaged NO3 -N concentration in the leachate from the planted pots over the growth period was 12 ± 1 mM and was almost not affected by the treatments applied. The pH of leachates from pots without plants decreased continuously during the growth period, and a value of 5.8 was attained under frequent irrigation with the high P-level solution – treatment I3P2 (Figure 6). The concentrations of NH4 -N and other elements (except P) in leachates were almost equal and were not affected by solution-P levels. Therefore, the significant pH decreases in leachates from P2 treatments could be attributed solely to the differences in the P concentration in the leachate solution. The phosphorus concentrations in the leachate from unplanted pots fell to 0.07 and 0.3 mM (P1 and P2 treatments, respectively) early in the experiment (12 DAT) and increased steadily until they equaled the concentrations in the irrigation water at the end of the experiment. The P retention in the unplanted pots could be at-
304 Table 3. The effects of irrigation frequency and P level on nutrient concentrations in outer and inner leaves at harvest (43 DAT) Treatments
Total-N
NO3 -N K g kg−1
Ca
Mg
Fe
Zn Mn µg g−1
Outer leaves Mean of irrigation I1 I2 I3
49 48 47
12 11 11
106 113 104
11 11 11
4.5 4.5 4.5
618 654 632
340 337 330
301 310 329
Mean of P P1 P2
50 46
12 10
111 105
11 11
4.4 4.7
621 648
347 324
360 265
ns ns
ns ns
ns ns
ns ns
ns
Source of variation Irrigation P conc.
ns
ns
ns
∗∗∗
∗
∗
∗∗∗
Inner leaves Mean of irrigation I1 I2 I3
46 48 47
4.5 4.3 4.3
78 80 80
3.3 3.4 3.1
2.6 2.6 2.5
270 295 282
253 261 268
140 150 149
Mean of P P1 P2
48 45
4.8 4.0
81 78
3.0 3.5
2.5 2.6
294 263
247 274
170 121
ns ns
ns ns
ns ns
ns ns
ns
Source of variation Irrigation P conc.
ns
ns
∗∗
∗
ns ns
∗∗∗
∗ , ∗∗ , ∗∗∗ Significant at P ≤ 0.05, 0.001, and 0.0001, respectively; ns – not significant.
tributed to two mechanisms: (a) adsorption on the sand particle surfaces; and (b) precipitation of metal-P compounds. P adsorption would cause a pH increase through the displacement of hydroxyls, whereas precipitation would do so through proton consumption. The continuous decreases with time in the pH of the leachates from the unplanted pots, especially in the P2 treatments (Figure 6), clearly illustrates that P solubility in the sand substrate was mainly governed by precipitation reactions. Indeed, the activity product of Ca2+ and PO3− 4 in the leachate exceeded the Ksp of hydroxyapatite (Ca5 (PO4 )3 OH), β-TCP (Ca3 (PO4 )2 ) and OCP (Ca4 H(PO4 )3 2.5(H2O). The pH in the leachate from the planted pots was generally higher than in those from the unplanted pots for all P and irrigation treatments (Figure 6). This difference resulted from the balance between proton and hydroxyl releases to the liquid phase. The pH increase
in the presence of plants was probably induced by excess anion uptake or excretion of organic acids by the plant (Bar-Yosef, 1999; Marschner, 1995). Figure 7 presents the daily P quantities retained in the substrates in the various solution-P and irrigation treatments. The retained quantities were calculated by subtracting the difference in P contents between the irrigation and leachate solutions from the P quantities in the plant, throughout the growth period and represent the quantities of P adsorbed or precipitated in the medium. It was clearly shown that in the early growth periods the quantities of applied P were higher than the plant demand but that in the later stages the P acquisition was augmented in response to plant growth and the plants even utilized some of the P retained in the substrate (Figure 7).
305
Figure 4. Phosphorus concentrations in: (a) Leaves during the growth period; (b) Roots during the growth period; and (c) Outer and inner leaves at harvest. Vertical bars indicate the standard error (not shown where their size was smaller than the symbol).
Variations of water content and suction in the substrates The daily variations of pot weight and water tension as measured by the tensiometers 10 cm above the bottom for irrigation frequencies of 1, 4 and 10 events per day (I1, I2 and I3, respectively) in the low-P treatment (P1) are shown in Figure 8 for 33 DAT. The pot weights increased sharply during the irrigation events and decreased significantly shortly afterwards, mainly by free drainage through the bottom of the pot. The subsequent moderate weight decrease, over a longer period, was due to water uptake by the roots (Figure 8). Note that the surface of the medium was entirely covered by the lettuce head at 33 DAT, therefore, it can be postulated that the evaporation rate from the substrate surface was very low and that the weight decrease during the later stages could be attributed mainly to transpiration. The amplitudes of container weight variations decreased as irrigation frequency increased (Figure 8), because the water volume supplied
Figure 5. Total P accumulation in the canopy (a) and P influx (b) at the 33rd day after transplanting (DAT) as a function of the daily irrigation frequency. Vertical bars indicate the standard error (not shown where their size was smaller than the symbol).
at each irrigation event diminished as the irrigation frequency increased, since the daily irrigation volume was the same for all treatments. The sharp weight decrease that followed the irrigation events was greatest and extended for the longest time in treatment I1, was moderate in I2 and was barely discernible in I3. Water suction decreased during the irrigation events, as the water content increased, and increased afterwards together with the fall in water content. The accumulative drainage volumes for two representative treatments (I1P1 and I3P1) are shown in Figure 9. The smaller decrease rate of the I3 pot weight soon after the cessation of irrigation (Figure 8) indicates that the drainage flux from these pots was low and long-lasting. Thus, the rate of weight loss between successive irrigations for this treatment cannot be attributed solely to water consumption. Note that water did not drain from the I3 pot after the first two irrigations, and that drainage started at 08.00 only by the third irrigation (Figures 8 and 9). The difference between the accumulative drainage
306
Figure 6. Variations of pH in leachates during the experiment: (a) Unplanted pots; and (b) Planted pots.
Figure 8. Variation with time of pot weight (a) and tensiometer readings 10 cm above the bottom (b) during the 33rd day after transplanting (DAT) for the various irrigation frequencies and low P concentration (P1).
Figure 7. Phosphorus retention in the substrate during the growth period.
volumes in Figure 9 indicates that of the plants grown in pots above the tipping buckets, the one that was irrigated 10 times a day (I3) transpired 90 mL more than the one irrigated once a day (I1).The common assumption about growing in container media is that drainage from the bottom indicates that the substrate bottom layer is saturated and that when the free drainage terminates it indicates that the moisture content distribution along the container height is at container capacity (Raviv et al., 2002). Therefore, the differ-
Figure 9. Accumulative volumes of pot drainage during the 33rd day after transplanting (DAT) from pots with plants exposed to low P level (P1) and to two irrigation frequencies (I1 and I3).
307 ences among the different treatments, in pot weight gain and in drainage rate (pot weight loss) following the irrigation events (Figure 9) could be related to the differences in the substrate volumes whose moisture content had significantly increased during the irrigation event. Since drippers were used in the present study, it is assumed that the wetted volume at the end of an irrigation event can be represented as a cylinder whose axis passes through the dripper location. The diameter of the wetted cylinder increased with increasing volume of water added to the substrate during the irrigation event: it was larger in the less frequent irrigation treatment and smaller for the more frequent treatment, since the water volume per irrigation was inversely related to the irrigation frequency. Thus, the excess water in the pot at the moment when the irrigation stopped drained at a higher rate and for a longer time as the irrigation frequency decreased. Leaf photosynthesis, stomatal conductance and water use efficiency
Figure 10. (a) Pot weight variation, measured and fitted by the logistic model for a single irrigation per day (I1) and two P concentrations during the 33rd day after planting (DAT). (b) rate of water uptake calculated by the derivative of the fitted curves. The fitting parameters were: for I1P1, R 2 = 0.97, fit standard error = 0.0067; and for I1P2, R 2 = 0.99 and fit standard error = 0.006.
There was no significant effect of irrigation frequency or P supply on the leaf stomatal conductance (232–253 mmol m−2 s−1 ), photosynthesis rate (12.8– 14.5 µmol m−2 s−1 ) or chlorophyll contents (Chl a: 1.0–1.16 g kg−1 FW and Chl b: 0.30–0.34 g kg−1 FW). The averaged water use efficiency at harvest was 216 ± 13 L/kg DW and was there was no significant difference among the six treatments.
Discussion
Figure 11. Relationships between transpiration flux and daily irrigation frequency at two P levels at the 33rd day after transplanting (DAT).
The increased FW yield obtained when the P concentration in irrigation water increased (Table 1) in the low irrigation frequency treatment (I1) required a higher instantaneous rate of water uptake in the P2 than in the P1 treatment. The instantaneous water uptake rate is calculated as the numerical derivative of the measured weight from the point at which free drainage ends and the pot weights decrease solely owing to transpiration (Figure 8). Measured data are usually noisy, as can be seen in Figure 8, and a numerical derivative of noisy data significantly amplifies the noise to such an extent that the instantaneous water uptake rate could barely be followed (Wallach and Raviv, 2003). A means to overcome this difficulty is to smooth the data prior to differentiation. Wallach and Raviv (2003) examined various non-parametric filtering and regression methods to smooth measured data
308 and discussed the resulting water uptake rate patterns obtained by differentiation of the resulting smooth curves. Since the weight decrease in the I1 treatment during the relevant stage exhibited a transient asymmetry pattern, as depicted in Figure 8, we used the logistic model that is widely used to fit measured data in biology and plant science. The measured and fitted data for treatments I1P1 and I1P2 are shown in Figure 10a. The derivatives of the fitted curves are shown in Figure 10b, and indicate that the rate of water uptake by the I1P2 plants was much higher than that of those in the I1P1 treatment. This agrees with the overall water balance for these treatments (averaged transpiration of I1P1 and I1P2 plants during the 33 DAT were 174 and 245 mL per plant, respectively). Since the amounts of irrigation water supplied to these two treatments were equal, the difference between the two patterns of uptake rate was due to the bigger plants at the high-P treatment. The increasing deviation between the two uptake patterns around midday (Figure 10b) indicates that water availability was not the limiting factor in either treatment. Increasing the irrigation frequency significantly enhanced the transpiration flux (L/km root∗ day) so that the transpiration flux of P1 plants, which received 10 irrigation events daily, was similar to that of P2 plants (Figure 11). Phosphorus concentrations in the transpiration flow at the end of the experiment were 19.5 and 29.2 mg L−1 , for P1 and P2 plants, respectively, compared with concentrations in the irrigation and drainage flows of 6 and 31, and 1.9 and 22.2 mg L−1 , respectively. These data clearly emphasize the high efficiency of the plants in overcoming P-deficiency conditions through modifications of the root/shoot ratio, and the root length and diameter (Table 2; Figure 3), in addition to other mechanisms reviewed by Plaxton and Carswell (1999) and Raghothama (1999). The only significant correlation revealed by multiple stepwise regressions relating nutrient concentrations in the plant to yield, was that between P concentration in the leaves and the yield. This agrees with results obtained in a previous study (Silber et al., 2003) in which lettuce was grown in a perlite medium under several different nutrient concentrations and irrigation frequencies. A significant quadratic regression was obtained between the canopy DW and the P concentration in the leaves (not presented). On the basis of the quadratic regression, 97% of the DW variation could be accounted for by differences in P uptake, indicating that the main effect of fertigation
frequency was related to improvements in P mobilization and uptake. Thus, frequent irrigations compensate for P shortage. The lower yield obtained at the lowest frequency resulted mainly from P deficiency rather than from water shortage. The increases with increasing irrigation frequency in the P concentration in the lettuce organs and in the P influx to the roots, throughout the growth period in the low-P treatment (P1) (Figures 4 and 5) support the hypothesis of Silber et al. (2003) that frequent irrigation eliminates the depletion zone at the rootsoil interface by supplying fresh nutrient solution, and so enhances the P uptake. The higher P uptake is a result of the higher convective flux of dissolved P flux from the substrate solution to the root surface, which results, in turn, from the higher average moisture content associated with frequent irrigation. By extrapolation, the curve for P influx in the P1 treatments should approach the curve for P2 treatments as irrigation frequency increases. Higher frequencies could not be applied with the sand substrate used in the present study, since anaerobic conditions would have developed. Phosphorus concentration in the vicinity the root surface for P2 plants was probably sufficient to ensure proper uptake, and was far above the threshold value needed to achieve maximum influx, therefore, irrigation frequency did not strongly affect yield production, root/shoot ratio, P concentrations in plant organs, or P and water influx (Table 1, Figures 3–5, and 11). Acknowledgements The authors are grateful to the anonymous reviewers for critical readings of the article and their constructive comments. This work was supported by the Israeli Agricultural Science Foundation. This paper is contribution No, 614/03 of the Agricultural Research Organization of The Volcani Center, Israel. References Bates T R Lynch J P 2001 Root hairs confer a competitive advantage under low phosphorus availability. Plant Soil 236, 243–250. Barber S A 1995 Soil Nutrient Bioavailability. Wiley, New York. Bar-Yosef B 1999 Advances in fertigation. Adv. Agron. 65, 1–79. Buwalda F and Warmenhoven M 1999 Growth-limiting phosphate nutrition suppresses nitrate accumulation in greenhouse lettuce. J. Exp. Bot. 335, 813–821. Cathcart J B 1980 World phosphate reserves and resources. In The Role of Phosphorus in Agriculture. Eds. F E Khasawneh, E C Sample and E J Kamprath. pp. 1–18. ASA-CSSA-SSSA, WI.
309 Claassen N and Steingrobe B 1999 Mechanistic simulation models for a better understanding of nutrient uptake from soil. In Mineral Nutrition of Crops, Fundamental Mechanisms and Implications. Ed. Z Rengel. pp. 327–367. Haworth Press, New York. Costa C, Dwyer L M, Hamilton R, Hamel, C, Nantais L and Smith D L 2000 A sampling method for measurement of large root systems with scanner-based image analysis. Agron. J. 92, 621–627. Harris G 1998 An analysis of global fertilizer application rates for major crops. IFA Annual Conference, Agro-Economics Committee Fertilizer Demand Meeting, Toronto. Inskeep WP and Bloom PR 1985 Extinction coefficients of chlorophyll a and b in N,N-dimethylformamide and 80% acetone. Plant Physiol. 77, 483–485. Itoh S and Barber S A 1983 Phosphotus uptake by six plant species as related to root hairs. Agron. J. 75, 457–461. Jones J B Jr, Wolf B and Mills H A 1991 Plant Analysis Handbook. Micro-Macro Publishing, GA. Lynch J and Brown K M 1997 Ethylene and plant responses to nutritional stress. Physiol. Plant. 100, 613–619. Marschner H 1995 Mineral Nutrition of Higher Plants. 2nd ed. Academic Press, New York. Plaxton W C and Carswell C 1999 Metabolic aspects of the phosphate starvation response in plants. In Plant Responses to Environmental Stress. Ed. H Lerner. pp. 350–372. Marcel Dekker, New York.
Raghothama, K G 1999 Phosphate acquisition. Annu Rev. Plant Physiol. Plant Mol. Biol. 50, 665-693. Raviv M, Wallach M, Silber A and Bar-Tal A 2002 Substrates and their analysis. In Hydroponic Production of Vegetables and Ornamental. Eds. D Sarvas and H C Passam. pp. 25–101. Embryo Publications. Athens. Runge-Metzger A 1995 Closing the cycle: Obstacles to efficient P management for improved global food security. In Phosphorus in the Global Environment; Transfers, Cycles and Management. Ed. H Tiessen. pp. 27–42. John Wiley and Sons, NY. SAS Institute Inc. 2002 JMP User’s Guide, Version 5.0 SAS Institute Inc., Cary, NC. Schecher W and McAvoy D C 2002 MINEQL+: A Chemical Equilibrium Modeling System, Version 4.5 for Windows, Environ. Res. Software, Hallowell, ME. Silber A, Xu G, Levkovitch I, Soriano S, Bilu A and Wallach R 2003 High fertigation frequency: The effects on uptake of nutrients, water and plant growth. Plant Soil, 253 (2), 467–477. Steen I 1998 Phosphorus availability in the 21st century. Management of a non-renewable resources. Phosph. Potas., 217, 1998. Wallach R and Raviv M 2003 Using time-series techniques for determination of the momentary rates of water uptake and water-tension variation from high resolution measurements. Plant Soil, submitted. Section editor: G. Keerthisinghe