Available online at www.sciencedirect.com
ScienceDirect Procedia Engineering 120 (2015) 372 – 375
EUROSENSORS 2015
Integrated multi-sensor system for parallel in-situ monitoring of cell nutrients, metabolites and cell mass in biotechnological processes Stefan Mrossa,*, Tom Zimmermanna, Nadine Winkinb, Michael Kraftc, Holger Vogta a Fraunhofer Institute for Microelectronic Circuits and Systems, Duisburg, Germany Institute of Materials in Electrical Engineering, Chair 1, RWTH Aachen University, Germany c Montefiore Institute, Department of Electrical Engineering and Computer Science, University of Liège, Belgium b
Abstract We report on a multi-sensor system for the parallel in-situ monitoring of cell nutrients, metabolites and cell mass in biotechnological processes. The integration of enzyme sensors and impedance spectroscopy on one chip for applications in bioreactors is demonstrated for the first time to our best knowledge. Measurements of glucose and lactate concentrations in a wide range are shown with linear ranges up to 600 mM and 900 mM, respectively. The glucose and cell mass sensor in parallel are successfully employed in a cell culture of Saccharomyces cerevisiae to monitor glucose consumption and increasing mass of the cells. ©2015 2015The The Authors. Published by Elsevier Ltd. © Authors. Published by Elsevier Ltd. This is an open access article under the CC BY-NC-ND license (http://creativecommons.org/licenses/by-nc-nd/4.0/). Peer-review under responsibility of the organizing committee of EUROSENSORS 2015. Peer-review under responsibility of the organizing committee of EUROSENSORS 2015
Keywords: Bioprocess monitoring; multi-sensor system; in-situ monitoring; enzymatic sensors; cell mass sensor
1. Introduction In order to meet the rising requirements of biotechnological processes in production and research, precise control is crucial. This involves the measurement of a multitude of parameters which influence the process, including pH, temperature, concentration of nutrients (e.g. glucose) and metabolites (e.g. lactate), oxygen and carbon dioxide levels, biomass concentration, temperature and pressure [1]. For many of these parameters, a continuous real time measurement directly inside the bioreactor is preferable because this allows detecting small changes quickly, adjusting relevant parameters and maintaining the process at optimum condition.
* Corresponding author. Tel.: +49 203 3783 254; fax: +49 203 3783 266. E-mail address:
[email protected]
1877-7058 © 2015 The Authors. Published by Elsevier Ltd. This is an open access article under the CC BY-NC-ND license
(http://creativecommons.org/licenses/by-nc-nd/4.0/). Peer-review under responsibility of the organizing committee of EUROSENSORS 2015
doi:10.1016/j.proeng.2015.08.642
373
Stefan Mross et al. / Procedia Engineering 120 (2015) 372 – 375
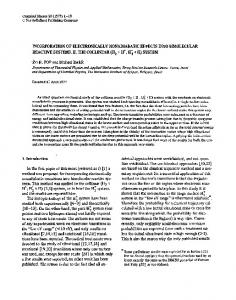
Multi-sensor platforms offer a promising way to simultaneously monitor a wide range of parameters since these are considerably smaller, cheaper and simpler to use than multiple single sensors. While such platforms have been demonstrated for bioreactors [2,3], sensors for the measurement of important analytes such as glucose, lactate, glutamine or glutamate have not been integrated yet in these platforms to our knowledge. In this contribution, we propose a multi-sensor system for the parallel in-situ monitoring of glucose, lactate and cell mass in biotechnological processes. The integration of these sensor principles on a single chip, which is demonstrated for the first time, has some distinct advantages. It miniaturizes the measurement setup, reduces cost and occupied space and makes applications in small bioreactors such as cell culture flasks possible. The integrated glucose and lactate sensors allow for in-situ monitoring of these analytes in the wide concentration ranges found in bioprocesses, eliminating the need for sample taking and external measurement equipment. Furthermore, the close proximity of the integrated sensors enables measurement of all parameters in the same small volume, eliminating possible signal deviations caused by concentration differences in the bioreactor. 2. Sensor Chip and Experimental Method The design of the multi-sensor chip consisted of two amperometric enzyme sensors for glucose and lactate, a cell mass sensor and a pH sensor not discussed here. Sensor prototypes as depicted in Fig. 1 were fabricated on chip comprising gold or platinum electrodes on an oxidized silicon substrate using a lift-off process. The chip size was 7.16 mm x 7.16 mm. The amperometric enzyme sensors were based on the selective conversion of glucose or lactate molecules by an enzyme, subsequent oxidation of the generated H2O2 and detection of the oxidation current by a potentiostat [4]. The enzyme electrodes were designed as three electrode configurations with concentric working (WE), counter (CE) and reference (RE) electrodes. The WE had a diameter of 566 μm, while CE and RE had a width of 100 μm. For functionalization of the electrodes, a solution of 10 mg glucose oxidase (GOx) or lactate oxidase (LOx), 10 mg bovine serum albumin and 25 μl glutaraldehyde in 500 μl phosphate buffered saline (PBS) was prepared. 0.1 μl of the solution were dispensed on the three electrode configuration and dried in air. On top of the enzyme layer, a diffusion-limiting polyurethane (PU) membrane was applied to achieve a wide linear measurement range. In order to evaluate the influence of different fabrication parameters on the linear range, a series of membranes was produced. PU solutions in concentrations of 4 %, 6 %, 8 % and 10 % were prepared with a mixture of tetrahydrofuran (THF) and dimethylformamide (DMF). The THF-DMF ratio was adjusted to 9:1, 7:3, 5:5 or 3:7, giving four series of solutions. 0.15 μl of the PU solution were deposited on the enzyme layer and dried in air. The cell mass sensor measured the conductance of a cell suspension below and above the characteristic frequency fchar of the cells. While the conductance below fchar is a function of the viable cell mass, the upper frequency conductance is not influenced by the cells [2]. Therefore, the conductance ratio can be taken as a measure for the cell mass. Interdigitating electrodes were designed to have an impedance spectrum with an ohmic plateau around 1000
pH Cell mass
Impedance [Ohm]
800 600 400
Increasing influence of double layer capacitance Increasing Ohmic plateau around influence of characteristic frequency fchar electrode of yeast cells capacitance
200 0
4
10
5
6
10 10 Frequency [Hz]
fchar 107
Fig. 1 (a) Photograph of multi-sensor chip; chip size 7.16 mm x 7.16 mm; (b) Impedance curve of interdigitating electrodes in buffer solution with ohmic plateau from 100 kHz to 20 MHz
374
Stefan Mross et al. / Procedia Engineering 120 (2015) 372 – 375
fchar of yeast cells (approx. 5 MHz). To this end, the lower and upper cutoff frequencies of the impedance spectrum in PBS were estimated as a function of the number of interdigitating fingers, finger length, width and spacing. The final design was chosen to have 22 fingers with a length of 2 mm, a width of 37 μm and a spacing of 20 μm. Impedance measurements were performed using a network analyzer (Anritsu MS4630B). The conductance at 1 MHz and 10 MHz was calculated from the impedance value and the phase angle and the ratio G10MHz/G1MHz taken as a measure for the cell mass. For the cell culture monitoring, the conductance values at each point of time were normalized to their initial values before the ratio G10MHz/G1MHz was calculated. 3. Results 3.1. Enzyme sensors A series of calibration measurements with glucose sensors was performed with the PU concentrations and THFDMF ratios given in section 2. With THF-DMF ratios changing from 9:1 to 5:5, an increasing linear measurement range and a decreasing sensitivity was found, with the optimum linear range up to 600 mM and a sensitivity of 0.15 nA/mM being at a solvent ratio of 5:5. The THF-DMF ratio 3:7 gave the same linear range as the ratio 9:1. Increasing PU concentrations up to 10 % always gave a higher linear range and lower sensitivity. For the lactate sensors, the optimized THF-DMF ratio of 5:5 was used which gave a linear measurement range up to 900 mM and a sensitivity of 0.07 nA/mM. The calibration curves for the optimized glucose and lactate sensors are shown in Fig. 2. 250
160 140
Current [nA]
Current [nA]
6%
100
8%
80 60
10 %
40
0
100
200
300 400 500 Glucose [mM]
600
PU 4 %
150
6%
100
8%
50
THF:DMF 5:5
20 0
200
PU 4 %
120
700
0
10 % THF:DMF 5:5 0
200
400 600 Lactate [mM]
800
1000
Fig. 2 Calibration curves of glucose and lactate sensors with polyurethane (PU) membranes; PU concentrations 4 % to 10 %, ratio THF:DMF 5:5
3.2. Cell mass sensor Impedance curves were recorded in PBS to determine the frequency response of the interdigitating electrodes. The measurements showed an ohmic plateau from approx. 100 kHz to 20 MHz which enabled the detection of changes in conductance in the relevant frequency range of 1 MHz to 10 MHz for yeast cell suspensions without adverse capacitive influences (Fig. 1b). 3.3. Parallel monitoring The parallel operation of enzyme sensors and impedance sensors integrated on the same chip can lead to interferences between the single sensors. In order to assess possible interferences, a parallel monitoring of glucose and conductance was performed in a stirred 50 mM glucose solution. The measurement was started with a conductance measurement. After 6 h, the amperometric glucose detection was added. From Fig. 3a it can be seen that the signal of the conductance ratio showed some noise in the first part of the experiment but otherwise remained stable with a slight decline from 1 to 0.99 over the whole experiment. The amperometric signal stabilized after approx. 3 h and then remained stable (with some noise) at an amplitude of approx. 3 nA. No mutual influences
375
Stefan Mross et al. / Procedia Engineering 120 (2015) 372 – 375
between the sensors could be found except the fact that the noise of the conductance signal decreased at the time the potentiostat was turned on. This behavior was also observed in measurements in PBS without glucose and can therefore be attributed to electrical interferences which however do not impair the sensor performance.
Amperometry turned on
0.3
4
Amperometry
60 40 20 0
5
10 15 Time [h]
1.015
Reference measurement
1.010 Conductance
2
0.2 Glucose [mM]
Current [nA]
0.4
6
20
25
Glucose
30
150 Current
100 50 0 0
1.005 1.000 40
200
80
0
0.5
Cell mass
8
G10MHz/G1MHz
Conductance
1.020 Cell mass [g/l]
0.6
20
Reference measurement 1
2
3 4 Time [h]
10 5
6
Current [nA]
1.010 1.005 1.000 0.995 0.990 0.985 0.980
Absorbance [a.u.]
G10MHz/G1MHz
After the parallel mode of operation had been shown feasible, parallel monitoring of a culture of Saccharomyces cerevisiae was performed. The culture was prepared in PBS with an initial cell mass of 2 g/l and a glucose concentration of 200 mM. Before measurements were started, the yeast was allowed to rehydrate for 2 h. During the culture, temperature and pH were held constant at 31 °C and pH 5, respectively, and the culture was continuously aerated and stirred. Samples were taken every 30 min for reference measurements. Glucose concentration was measured in 50-fold dilution using a spectrophotometric assay (Sigma Aldrich, USA) while cell mass was determined in 40-fold dilution by measurement of absorbance (FP 8500, Jasco). The signal of both sensors showed good correlation with the reference measurements as depicted in Fig. 3b. Especially the signal of the cell mass sensor showed the typical growth curve of a yeast culture with lag phase, exponential growth and stationary phase. The results of the cell culture monitoring demonstrate the feasibility of the proposed device for parallel in-situ monitoring of biotechnological processes.
0
Fig. 3 Parallel monitoring of conductance/cell mass and glucose (a) in glucose solution; (b) in a yeast culture; curves: sensor signals, red dots: reference measurements
4. Conclusion A multi-sensor system for the parallel in-situ monitoring of biotechnological processes has been demonstrated. Enzyme sensors for high glucose and lactate concentrations were fabricated and showed linear behavior up to concentrations of 600 mM and 900 mM, respectively. The parallel operation of the glucose and cell mass sensor was shown feasible without significant mutual interferences. Glucose and cell mass of a yeast culture were monitored in parallel and good correlation with the reference measurements was found. Further studies of the parallel application of the sensors, including pH sensing, and of the long-term stability of the system are currently being conducted. References [1] M. Pohlscheidt, S. Charaniya, C. Bork, M. Jenzsch, T.L. Noetzel, A. Luebbert, Bioprocess and Fermentation Monitoring, in: Upstream Industrial Biotechnology, vol. 2, 1st ed., M.C. Flickinger, Hoboken, NJ: Wiley, 2013, ch. 5, sec. 69, pp. 1471-1491. [2] E.E. Krommenhoek et al., Lab-Scale Fermentation Tests of Microchip With Integrated Electrochemical Sensors for pH, Temperature, Dissolved Oxygen and Viable Biomass Concentration, Biotechnol. Bioeng. 99 (2008) 884-892. [3] C.Ress, A. Adamia, L. Lorenzelli, C. Collini, A. Tindiani, A. Maglione, G. Soncini, Development and characterization of a multiparametric microsensor for yeast cell growth monitoring, Proc. Eurosensors XXIII (2009) 1059-1062. [4] N.J. Ronkainen, H.B. Halsall, W.R. Heineman, Electrochemical biosensors, Chem. Soc. Rev. 39 (2010) 1747-1763.